EX-99.12
Published on
Exhibit 99.12
FORM 51-102F3
Material Change Report
| Item 1 |
Name and Address of Corporation |
Aris Mining Corporation (formerly GCM Mining Corp.) (the Company) c/o 550 Burrard Street, Suite 2900 Vancouver, British Columbia V6C 0A3
| Item 2 |
Date of Material Change |
November 14, 2022
| Item 3 |
News Release |
A news release relating to the material change described herein was disseminated on November 14, 2022 through the services of PRNewswire and subsequently filed on the Company’s SEDAR profile at www.sedar.com.
| Item 4 |
Summary of Material Change |
On November 14, 2022, the Company announced updated mineral resource and reserve estimates and a Preliminary Feasibility Study (PFS) for the Marmato expansion project, which estimates are effective June 30, 2022 (the 2022 PFS).
| Item 5 |
Full Description of Material Change |
On November 14, 2022, the Company announced updated mineral resource and reserve estimates and the 2022 PFS for the Marmato expansion project, which estimates are effective June 30, which includes significant growth and refinement over the 2020 PFS.
Highlights of the 2022 PFS for the Marmato Expansion
The Marmato expansion project includes the development of a new underground mine and 4,000 tonne per day (tpd) processing facility to add to the current 1,250 tpd Upper Mine. Total recovered gold ounces are estimated at 3.0 million. The deposit remains open at depth and along strike, and has a high expansion potential from future underground drilling programs. The construction capital is estimated at $280 million as detailed in Table 3, and the project economics presented in Table 1 are inclusive of the stream financing, where for upfront deposits of $53 million received and $122 million to be received during construction, Wheaton Precious Metals International (WPMI) purchases gold and silver at reduced prices.
Table 1: 2022 PFS - Marmato Project Economics1
|
Gold price (US$/oz) |
$1,400 | $1,500 | $1,6002 | $1,700 | $1,800 | |||||
|
Project NPV @ 5% (after-tax) |
$150 | $246 | $341 | $438 | $533 | |||||
|
Project IRR (after-tax) |
16.1% | 22.8% | 29.7% | 37.1% | 45.2% | |||||
1 Project economics inclusive of precious metal streaming agreement with WPMI. In exchange for the upfront deposits of $175 million, WPMI purchases 10.5% of gold produced from the Marmato mine until 310,000 ounces of gold have been delivered, after which the volume reduces to 5.25% for the life of mine. WPMI will also purchase 100% of silver produced from the Marmato mine until 2.15 million ounces of silver have been delivered, after which the volume reduces to 50% for the life of mine.
2 Base case assumption
1
Figure 1: Marmato annual gold production by Upper Mine and Lower Mine
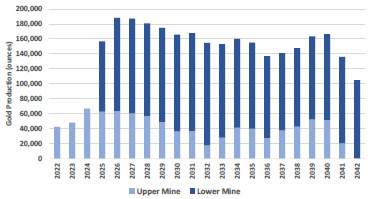
Note 1: Full year 2022 includes 14,830 ounces gold produced from the Upper Mine during the six-month period ended June 30, 2022
Marmato Optimization and Project Management
Following the mineral resource estimate (MRE) effective June 30, 2021 and announced in November 2021 that demonstrated significant growth over the previous MRE prepared for the 2020 PFS1, the Marmato mine has been thoroughly reviewed and the results have been incorporated into the 2022 PFS. The Company and its consultants are currently finalizing the 2022 PFS technical report in accordance with NI 43-101 and the Company expects to file the report on SEDAR and the Company’s website during November 2022.
Following cost and business risk studies, optimizations and updates were made to the overall development strategy including:
| • |
Selecting a contractor-mining approach for the Lower Mine over the previous owner-operator approach, which enhances scalability and accelerates the development timeline while reducing initial capital requirements; |
| • |
Relocating the underground crusher to the surface and eliminating the underground conveyor systems, thereby improving operational flexibility with some increase in operating costs; |
| • |
Designing the dry-stack tailings facilities for the increased volumes realized from the extended mine life; and |
| • |
The cost estimates for the economic analysis now include annualized capital expenditures for the processing plant and other infrastructure, a distinction between fixed and variable costs, and better consideration for the effects of taxation and the stream financing. |
Table 2 provides highlights of the 2022 PFS, and a comparison to the 2020 PFS, which includes an increased mine life of 20 years (previously 14 years) and life of mine gold production of 3.0 million ounces (previously 1.9 million ounces).
1 See the Qualified Person and Technical Disclosure section for a reference to the 2020 PFS
2
Table 2: 2022 PFS Highlights and Comparison to the 2020 PFS
| 2022 PFS | 2020 PFS4,5 | |||
|
Proven + Probable gold mineral reserves |
31.3 Mt at 3.2 g/t for 3.2 Moz | 19.7 Mt at 3.2 g/t for 2.0 Moz | ||
|
Measured and Indicated gold mineral resources |
61.5 Mt at 3.0 g/t for 6.0 Moz | 39.4 Mt at 3.2 g/t for 4.1 Moz | ||
|
(inclusive of reserves) |
||||
|
Inferred gold mineral resources |
35.6 Mt at 2.4 g/t for 2.8 Moz | 26.4 Mt at 2.6 g/t for 2.2 Moz | ||
|
Mine life |
20 years | 14 years | ||
| Upper Mine: 1,250 | Upper Mine: 1,500 | |||
|
Processing rates (tpd) |
Lower Mine: 4,000 | Lower Mine: 4,000 | ||
|
Average LOM gold recovery |
94% | 92% | ||
|
Total LOM gold production (koz) |
2,986 | 1,865 | ||
|
Average annual production (koz/year) |
162 | 166 | ||
|
AISC (US$/oz)1 |
$1,003 | $880 | ||
|
Construction capital (US$ million) (see Table 3) |
$279.6 | $269.4 | ||
|
Committed stream financing (US$ million)2 |
$122.0 | $72.0 | ||
|
Net construction capital (US$ million) |
$157.6 | $197.4 | ||
|
At base case prices of $1,600/oz gold and $19/oz silver |
||||
|
Free cash flow1,2 (US$ million) |
$648 | |||
|
NPV @ 5% (after-tax, US$ million) |
$341 | N/A 3 | ||
|
IRR (after-tax) |
29.7% | |||
1: AISC ($ per oz sold) and free cash flow are non-IFRS financial measures and do not have any standardized meaning prescribed under IFRS, and therefore may not be comparable to other issuers. Please refer to the Non-IFRS Measures section of the Company’s Management’s Discussion and Analysis for the three and nine months ended September 30, 2022, which is available on the Company’s profile on SEDAR at www.sedar.com, for full details
2: WPMI stream financing commitment during the project construction period. In 2020, the stream commitment included two installments of $36 million each. In April 2022, the stream was amended to include three installments that total $122 million.
3: Free cash flow is after-tax and includes, construction capital, and stream financing.
4: The 2020 PFS was completed prior to completion of the stream financing, therefore, like-for-like comparison is not available
5. The 2020 PFS has an effective date of March 17, 2020 and was filed by Aris Gold Corporation (Formerly Caldas Gold Corp.) in September 2020.
Table 3 – Marmato Lower Mine Project Capital Cost Summary
|
Category |
Amount (US$ million) | |
| Process plant |
$92.9 | |
| Mine development and infrastructure |
62.4 | |
| Non process infrastructure |
42.1 | |
| Owner’s costs, G&A, and other indirect |
45.3 | |
| Paste plant |
18.4 | |
| Tailings facility |
16.0 | |
| Mining EPCM |
2.5 | |
| Total, capital cost including contingency |
279.6 | |
| Committed stream financing1 |
122.0 | |
|
Net construction capital |
$157.6 |
1: Includes three installments of $40 million, $40 million, and $42 million based on project completion milestones of 25%, 50% and 75%, respectively
The Upper Mine operations are supported by fully developed site infrastructure. Ore mined from the Upper Mine by conventional cut and fill and long hole stoping is processed in the existing 1,250 tpd processing facility using three stage crushing, ball mill grinding, gravity concentration, flotation, flotation and gravity concentrate regrind, cyanidation of the flotation and gravity concentrates, and Merrill Crowe precipitation and smelting to produce a gold-silver doré. Optimizations have been underway during 2022 to increase metallurgical recoveries and the processing rate to 1,250 tpd from 1,100 tpd.
3
The major new project facilities for the Lower Mine will include the mine portal, crusher, stockpiles, processing facility, two dry stack tailings storage facilities, mining services, accommodation, access roads, power and water management and distribution facilities, and office buildings. The overall timeline for project construction is estimated to be 2.5 years. Aris Mining plans to manage procurement and construction.
The new Lower Mine porphyry style mineralization will be mined using long hole stoping with paste backfill at a targeted mining rate of 4,000 tpd following a quick ramp up period. Ore will be hauled up a new decline to the new Lower Mine processing plant approximately three km by road from the Lower Mine. The new processing plant, designed by Ausenco Engineering, includes 4,000 tpd capacity two-stage crushing, semi-autogenous and ball mill grinding, gravity concentration, cyanidation of the gravity tailings, a carbon in pulp circuit, and electrowinning and refining to produce a gold-silver doré. Metal recoveries are estimated at 95.0% for gold and 57.0% for silver.
2022 Mineral Resource Estimate Update and Comparison to the 2020 PFS
The table below summarizes the updated MRE effective June 30, 2022 and a comparison to the 2020 MRE included in the 2020 PFS. The full break down of the 2022 MRE is provided after the comparison tables.
| Measured | Indicated | Measured & Indicated | Inferred | |||||||||||||||||||||||||||||||||||||||||||||
| Tonnes (Mt) |
Grade Au (g/t) |
Oz Au (koz) |
Tonnes (Mt) |
Grade Au (g/t) |
Oz Au (koz) |
Tonnes (Mt) |
Grade Au (g/t) |
Oz Au (koz) |
Tonnes (Mt) |
Grade Au (g/t) |
Oz Au (koz) |
|||||||||||||||||||||||||||||||||||||
| 2022 MRE |
2.8 | 6.0 | 545 | 58.7 | 2.9 | 5,452 | 61.5 | 3.0 | 5,997 | 35.6 | 2.4 | 2,787 | ||||||||||||||||||||||||||||||||||||
|
2020 MRE |
2.1 | 5.6 | 387 | 37.3 | 3.1 | 3,699 | 39.4 | 3.2 | 4,086 | 26.4 | 2.6 | 2,172 | ||||||||||||||||||||||||||||||||||||
| Change |
+158 | +1,753 | +1,911 | +615 | ||||||||||||||||||||||||||||||||||||||||||||
| (koz,%) |
+41% | +47% | +47% | +28% | ||||||||||||||||||||||||||||||||||||||||||||
Notes: Mineral resource estimates were prepared under the supervision of, or were reviewed by, Pamela De Mark, P.Geo, Senior Vice President Technical Services of Aris Mining, who is a Qualified Person as defined by National Instrument NI 43-101. Mineral resources are not mineral reserves and do not have demonstrated economic viability. Mineral resource estimates are reported inclusive of mineral reserves. Totals may not add due to rounding. The 2022 MRE was estimated using a gold price of US$1,700 per ounce and the 2020 PFS MRE was estimated using US$1,500 per ounce.
2022 Mineral Reserve Estimate Update and Comparison to the 2020 PFS
The table below summarizes the updated mineral reserve estimate effective June 30, 2022 and a comparison to the PFS mineral reserve estimate effective March 17, 2020. The full break down of detail for the 2022 mineral reserve estimate is shown below this comparison table.
| Proven | Probable | Proven & Probable | ||||||||||||||||||||||||||||||||||
| Tonnes (kt) |
Grade Au (g/t) |
Oz Au (koz) |
Tonnes (kt) |
Grade Au (g/t) |
Oz Au (koz) |
Tonnes (kt) |
Grade Au (g/t) |
Oz Au (koz) |
||||||||||||||||||||||||||||
| 2022 MRE |
2,196 | 4.3 | 304 | 29,082 | 3.1 | 2,874 | 31,277 | 3.2 | 3,178 | |||||||||||||||||||||||||||
|
2020 MRE |
802 | 5.1 | 133 | 18,898 | 3.1 | 1,888 | 19,700 | 3.2 | 2,021 | |||||||||||||||||||||||||||
| Change |
+171 | +986 | +1,157 | |||||||||||||||||||||||||||||||||
| (koz,%) |
+129% | +52% | +57% | |||||||||||||||||||||||||||||||||
Notes: The mineral reserve estimates were prepared under the supervision of, or were reviewed by, Pamela De Mark, P.Geo, Senior Vice President Technical Services of Aris Mining, who is a Qualified Person as defined by National Instrument NI 43-101. Totals may not add due to rounding. The 2022 mineral reserve was estimated using a gold price of US$1,500 per ounce and the 2020 mineral reserve was estimated using US$1,400 per ounce.
Marmato Mine Mineral Resources, effective June 30, 2022
|
Area |
Category |
Tonnes (Mt) |
Grade Au (g/t) |
Grade Ag (g/t) |
Contained Au (koz) |
Contained Ag (koz) | ||||||
| Upper |
Measured |
2.8 | 6.04 | 27.8 | 545 | 2,509 | ||||||
| Mine |
Indicated |
12.7 | 4.14 | 16.8 | 1,691 | 6,847 | ||||||
| Measured Indicated |
15.5 | 4.49 | 18.8 | 2,236 | 9,356 | |||||||
| Inferred |
2.6 | 3.03 | 15.4 | 250 | 1,265 |
4
|
Lower Mine |
Measured |
0.0 | 2.73 | 17.8 | 0 | 3 | ||||||||||||||||
|
Indicated |
46.0 | 2.54 | 3.3 | 3,761 | 4,912 | |||||||||||||||||
| Measured + Indicated |
46.0 | 2.54 | 3.3 | 3,761 | 4,914 | |||||||||||||||||
|
Inferred |
33.1 | 2.39 | 2.3 | 2,537 | 2,418 | |||||||||||||||||
| Marmato Total |
Measured |
2.8 | 6.04 | 27.8 | 545 | 2,512 | ||||||||||||||||
|
Indicated |
58.7 | 2.89 | 6.2 | 5,452 | 11,758 | |||||||||||||||||
|
Measured + Indicated |
61.5 | 3.03 | 7.2 | 5,997 | 14,270 | |||||||||||||||||
|
Inferred |
35.6 | 2.43 | 3.2 | 2,787 | 3,682 |
Notes:
| 1. |
Measured and Indicated mineral resources are inclusive of mineral reserves. |
| 2. |
Mineral resources are not mineral reserves and have no demonstrated economic viability. |
| 3. |
The mineral resource estimate was prepared by Benjamin Parsons, MSc, of SRK, who is a Qualified Person as defined by National Instrument 43-101. Mr. Parsons has reviewed and verified the drilling, sampling, assaying, and QAQC protocols and results, and is of the opinion that the sample recovery, preparation, analyses, and security protocols used for the mineral resource estimate are reliable for that purpose. |
| 4. |
Totals may not add up due to rounding. |
| 5. |
Mineral resources are reported above a cut-off grade of 1.8 g/t Au for the Upper Mine and 1.3 g/t Au for the Lower Mine. The cut-off grades are based on a metal price of US$1,700 per ounce of gold, and gold recoveries of 90% for the Upper Mine and 95% for the Lower Mine. |
| 6. |
The Upper Mine is defined as the current operating mine levels above the 950 m elevation and the Lower Mine is defined as below the 950 m elevation. |
| 7. |
There are no known environmental, permitting, legal, title, taxation, socio-economic, marketing, political, or other relevant factors that could materially affect the mineral resources. |
Marmato Mine Mineral Reserves, effective June 30, 2022
|
Area |
Category |
Tonnes (kt) | Grade Au (g/t) |
Grade Ag (g/t) |
Contained Au (koz) |
Contained Ag (koz) |
||||||||||||||||
| Upper |
Proven |
2,195.5 | 4.31 | 16.4 | 304 | 1,157 | ||||||||||||||||
|
Mine |
Probable |
4,946.9 | 4.09 | 14.3 | 650 | 2,273 | ||||||||||||||||
| Lower |
Proven + Probable |
7,142.3 | 4.16 | 14.9 | 954 | 3,431 | ||||||||||||||||
|
Proven |
- | - | - | - | - | |||||||||||||||||
|
Mine |
Probable |
24,135.0 | 2.87 | 3.5 | 2,224 | 2,707 | ||||||||||||||||
| Marmato Total |
Proven + Probable |
24,135.0 | 2.87 | 3.5 | 2,224 | 2,707 | ||||||||||||||||
|
Proven |
2,195.5 | 4.31 | 16.4 | 304 | 1,157 | |||||||||||||||||
|
Probable |
29,081.8 | 3.08 | 5.3 | 2,874 | 4,980 | |||||||||||||||||
|
Proven + Probable |
31,277.3 | 3.16 | 6.1 | 3,178 | 6,138 | |||||||||||||||||
Notes:
| 1. |
The Upper Mine mineral reserve estimate was prepared by Anton Chan, BEng, M.Sc., P.Eng, MMSAQP and the Lower Mine mineral reserve estimate was prepared by Joanna Poeck, BEng Mining, SME-RM, MMSAQP, both of whom are Qualified Persons as defined by NI 43-101. |
| 2. |
All figures are rounded to reflect the relative accuracy of the estimate. Totals may not add up due to rounding. Mineral Resources are reported inclusive of the Mineral Reserves. |
| 3. |
Upper Mine mineral reserves are reported above a cut-off grade of 2.05 g/t Au and Lower Mine mineral reserves are reported above a cut-off grade of 1.62 g/t. The cut-off grades are based on a metal price of US$1,500 per ounce of gold, gold recoveries of 90% for the Upper Mine and 95% for the Lower Mine, and costs of US$89 per tonne for the Upper Mine and US$74.3 per tonne for the Lower Mine. |
| 4. |
There are no known environmental, permitting, legal, title, taxation, socio-economic, marketing, political, or other relevant factors that could materially affect the mineral reserves. |
Qualified Person and Technical Disclosure
The technical information in this news release was reviewed and approved by Pamela De Mark, P.Geo, Senior Vice President, Technical Services of Aris Mining, who is a Qualified Person as defined by NI 43-101.
Scientific and technical information concerning the 2020 Marmato PFS is summarized, derived, or extracted from the Marmato Technical Report entitled “Revised NI 43-101 Technical Report Pre-Feasibility Study Marmato Project Colombia” dated September 18, 2020 with an effective date of March 17, 2020. The 2020 Marmato PFS was prepared by Ben Parsons, MSc, MAusIMM (CP), Eric J. Olin, MSc Metallurgy, MBA, SME-RM, MAusIMM, Fernando Rodrigues, BS Mining, MBA, MAusIMM, MMSAQP, Jeff Osborn, BEng Mining, MMSAQP, Joanna Poeck, BEng Mining, SME-RM, MMSAQP, Fredy Henriquez, MS Eng, SME, ISRM, Breese Burnley, P.E., Cristian A Pereira Farias, SME-RM, David Hoekstra, BS, PE, NCEES, SME-RM, David Bird, PG, SME-RM, Mark Allan Willow, MSc, CEM, SME-RM, and Tommaso Roberto Raponi, P.Eng, each of whom is independent of Aris Mining within the meaning of NI 43-101 and is a “Qualified Person” as such term is defined in NI 43-101.
5
Cautionary Language
This material change report contains “forward-looking information” or “forward-looking statements” within the meaning of Canadian securities legislation. All statements included herein, other than statements of historical fact, including without limitation statements relating to the results of the 2022 PFS, the expected production and life of mine at the Marmato operation following construction of the Lower Mine, the timing of the environmental permitting process and entry into the construction process, Lower Mine project construction details and timeline, the expected production at the Toroparu Project and the Company’s plans and strategies are forward-looking. Generally, the forward-looking information and forward looking statements can be identified by the use of forward looking terminology such as “plans”, “expects” or “does not expect”, “is expected”, “budget”, “scheduled”, “estimates”, “forecasts”, “intends”, “anticipates” or “does not anticipate”, “will continue” or “believes”, or variations of such words and phrases or state that certain actions, events or results “may”, “could”, “would”, “might” or “will be taken”, “occur” or “be achieved”. Statements concerning mineral resource estimates may also be deemed to constitute forward looking information to the extent that they involve estimates of the mineralization that will be encountered. The material factors or assumptions used to develop forward looking information or statements are disclosed throughout this presentation.
Forward looking information and forward looking statements, while based on management’s best estimates and assumptions, are subject to known and unknown risks, uncertainties and other factors that may cause the actual results, level of activity, performance or achievements of Aris Mining to be materially different from those expressed or implied by such forward-looking information or forward looking statements, including but not limited to: the success of business integration, the ability of the Company’s management team to successfully integrate with the current operations, the Company’s ability to generate sufficient cash flow from operations and capital markets to meet its future obligations, no significant disruption affecting operations, whether due to labour disruptions, supply disruptions, power disruptions, damage to equipment or otherwise, risks related to international operations, risks related to general economic conditions, actual results of current exploration activities; changes in project parameters as plans continue to be refined; fluctuations in prices of metals including gold; the ability to convert mineral resources to mineral reserves; fluctuations in foreign currency exchange rates or interest rates and stock market volatility, increases in market prices of mining consumables, risks associated with holding derivative instruments (such as credit risks, market liquidity risk and mark-to-market risk), possible variations in mineral reserves, grade or recovery rates; failure of plant, equipment or processes to operate as anticipated; changes in national and local government legislation, taxation, controls, regulations, regulations and political or economic developments in Canada or Colombia, accidents and operations, labour disputes, title disputes, claims and limitations on insurance coverage and other risks of the mining industry; delays in obtaining governmental approvals including obtaining required environmental and other licenses, or in the completion of development or construction activities, changes in national and local government regulation of mining operations, tax rules and regulations, and political and economic developments in countries in which the Company operates, as well as those factors discussed in the section entitled “Risk Factors” in Aris Mining’s most recent AIF available on SEDAR at www.sedar.com.
Although Aris Mining has attempted to identify important factors that could cause actual results to differ materially from those contained in forward-looking information and forward-looking statements, there may be other factors that cause results not to be as anticipated, estimated or intended. There can be no assurance that such information or statements will prove to be accurate, as actual results and future events could differ materially from those anticipated in such information or statements. The Company has and continues to disclose in its Management’s Discussion and Analysis and other publicly filed documents, changes to material factors or assumptions underlying the forward-looking information and forward-looking statements and to the validity of the information, in the period the changes occur. The forward-looking statements and forward-looking information are made as of the date hereof and Aris Mining disclaims any obligation to update any such factors or to publicly announce the result of any revisions to any of the
6
forward-looking statements or forward-looking information contained herein to reflect future results. Accordingly, readers should not place undue reliance on forward-looking statements and information.
Source: Aris Mining Corporation
| Item 6 |
Reliance on subsection 7.1(2) of National Instrument 51-102 |
Not Applicable.
| Item 7 |
Omitted Information |
Not Applicable.
| Item 8 |
Executive Officer |
Name of Executive Officer: Ashley Baker, LLB
General Counsel & Corporate Secretary
Telephone number: 604.764.5870
| Item 9 |
Date of Report |
November 23, 2022
7