EX-99.28
Published on
Exhibit 99.28
NI 43-101 Technical Report
Prefeasibility Study
Segovia Project
Antioquia, Colombia
Effective Date: December 31, 2021
Report Date: May 6, 2022
Report Prepared for
GCM Mining Corp.
401 Bay Street, Suite 2400,
Toronto, Ontario,
Canada, M5H 2Y4
Report Prepared by
SRK Consulting (U.S.), Inc.
999 Seventeenth Street, Suite 400
Denver, CO 80202
SRK Project Number: USPR001047
Signed by Qualified Persons:
Ben Parsons, MSc, MAusIMM (CP), Practice Leader/Principal Resource Geologist
Eric Olin, MSc, MBA, MAusIMM, SME-RM, Principal Metallurgist
Cristian A. Pereira Farias, SME-RM, Principal Hydrogeologist
David Bird, MSc, PG, SME-RM, Associate Principal Geochemist
Fredy Henriquez, MS Eng, SME, ISRM, Principal Consultant, Rock Mechanics
Jeff Osborn, BEng Mining, MMSAQP, Principal Mining Engineer
Fernando Rodrigues, BS Mining, MBA, MAusIMM, MMSAQP, Practice Leader/Principal Mining Engineer
Giovanny Ortiz, BS Geology, FAusIMM, Principal Resource Geologist
Joshua Sames, PE, BEng Civil, Principal Consultant
Mark Allan Willow, MSc, CEM, SME-RM, Practice Leader/Principal Environmental Scientist
Jeff Parshley, P.G., Practice Leader/Corporate Consultant
Reviewed by:
Scott Burkett, BSc Geology, Principal Consultant (Exploration Geologist)
Anton Chan, BEng Mining, MS Earth Science, Peng, MMSAQP, Senior Consultant (Mining Engineer)
| SRK Consulting (U.S.), Inc. NI 43-101 Technical Report – Segovia 2021 PFS Update |
Page ii |
| Table of Contents | ||||
| 1 Summary |
1 | |||
| 1.1 Property Description and Ownership |
1 | |||
| 1.2 Geology and Mineralization |
1 | |||
| 1.3 Status of Exploration, Development and Operations |
2 | |||
| 1.4 Mineral Processing and Metallurgical Testing |
4 | |||
| 1.5 Mineral Resource Estimate |
4 | |||
| 1.6 Mineral Reserve Estimate |
10 | |||
| 1.7 Mining Methods |
11 | |||
| 1.7.1 Geotechnical |
11 | |||
| 1.7.2 Groundwater |
12 | |||
| 1.7.3 Dewatering System |
12 | |||
| 1.7.4 Mine Design |
12 | |||
| 1.8 Recovery Methods |
13 | |||
| 1.9 Project Infrastructure |
14 | |||
| 1.9.1 Tailings Management Area |
14 | |||
| 1.10 Environmental Studies and Permitting |
15 | |||
| 1.10.1 Geochemistry |
16 | |||
| 1.10.2 Closure Water Treatment |
16 | |||
| 1.11 Capital and Operating Costs |
16 | |||
| 1.12 Economic Analysis |
20 | |||
| 2 Introduction |
23 | |||
| 2.1 Terms of Reference and Purpose of the Report |
23 | |||
| 2.2 Qualifications of Consultants |
23 | |||
| 2.3 Details of Inspection |
24 | |||
| 2.4 Sources of Information |
26 | |||
| 2.5 Effective Date |
27 | |||
| 2.6 Units of Measure |
27 | |||
| 3 Reliance on Other Experts |
28 | |||
| 4 Property Description and Location |
29 | |||
| 4.1 Property Location |
29 | |||
| 4.2 Mineral Titles |
30 | |||
| 4.3 Surface Land Rights |
34 | |||
| 4.4 Royalties, Agreements and Encumbrances |
36 | |||
| 4.5 Environmental Liabilities and Permitting |
38 | |||
| 4.5.1 Environmental Liabilities |
38 | |||
|
BP/KD |
May 2022 |
| SRK Consulting (U.S.), Inc. NI 43-101 Technical Report – Segovia 2021 PFS Update |
Page iii |
| 4.5.2 Required Permits and Status |
38 | |||
| 4.6 Other Significant Factors and Risks |
39 | |||
| 5 Accessibility, Climate, Local Resources, Infrastructure and Physiography |
40 | |||
| 5.1 Accessibility and Transportation to the Property |
40 | |||
| 5.2 Climate and Length of Operating Season |
42 | |||
| 5.3 Sufficiency of Surface Rights |
42 | |||
| 5.4 Infrastructure Availability and Sources |
42 | |||
| 5.4.1 Power |
42 | |||
| 5.4.2 Water |
42 | |||
| 5.4.3 Mining Personnel |
42 | |||
| 5.4.4 Potential Tailings Storage Areas |
42 | |||
| 5.4.5 Potential Waste Disposal Areas |
43 | |||
| 5.4.6 Potential Processing Plant Sites |
43 | |||
| 6 History |
44 | |||
| 6.1 Prior Ownership and Ownership Changes |
44 | |||
| 6.2 Exploration and Development Results of Previous Owners |
45 | |||
| 6.3 Historic Mineral Resource and Reserve Estimates |
45 | |||
| 6.4 Historic Production |
48 | |||
| 7 Geological Setting and Mineralization |
51 | |||
| 7.1 Regional Geology |
51 | |||
| 7.2 Local Geology |
52 | |||
| 7.3 Property Geology |
55 | |||
| 7.3.1 Segovia RPP License |
55 | |||
| 7.3.2 Vera Project |
66 | |||
| 7.3.3 Mineralization Relationships |
66 | |||
| 7.3.4 Carla Licenses |
67 | |||
| 7.4 Significant Mineralized Zones |
68 | |||
| 8 Deposit Type |
70 | |||
| 8.1 Mineral Deposit |
70 | |||
| 8.2 Geological Model |
70 | |||
| 9 Exploration |
71 | |||
| 9.1 Historical Exploration |
71 | |||
| 9.2 GCM Exploration Work |
73 | |||
| 9.3 Sampling Methods and Sample Quality |
74 | |||
| 9.4 Significant Results and Interpretation |
79 | |||
| 10 Drilling |
84 | |||
|
BP/KD |
May 2022 |
| SRK Consulting (U.S.), Inc. NI 43-101 Technical Report – Segovia 2021 PFS Update |
Page iv |
| 10.1 Segovia |
84 | |||
| 10.2 Carla |
91 | |||
| 10.3 Vera |
92 | |||
| 10.4 Procedures |
94 | |||
| 10.4.1 Collar Surveys |
94 | |||
| 10.4.2 Downhole Surveys |
94 | |||
| 10.4.3 Core Logging |
94 | |||
| 10.4.4 Drillhole Orientation |
98 | |||
| 10.5 Interpretation and Relevant Results |
99 | |||
| 11 Sample Preparation, Analysis and Security |
104 | |||
| 11.1 Core Logging |
104 | |||
| 11.2 Sample Preparation for Analysis |
106 | |||
| 11.2.1 Channel/Chip Sampling at Mine Laboratory, Pre-2015 |
106 | |||
| 11.2.2 Mine Laboratory, 2015 - Present |
106 | |||
| 11.2.3 Exploration Channel Sampling and Diamond Drilling SGS (Colombia) Laboratory |
106 | |||
| 11.3 Sample Analysis |
107 | |||
| 11.3.1 Mine Laboratory, Pre-2013 |
107 | |||
| 1.1.1 Mine Laboratory, 2015 |
107 | |||
| 11.3.2 SGS Laboratory |
108 | |||
| 11.4 Specific Gravity (Density) |
109 | |||
| 11.5 Quality Assurance/Quality Control Procedures |
110 | |||
| 11.5.1 Certified Standard Reference Material (CSRM) |
111 | |||
| 11.5.2 Blanks |
117 | |||
| 11.5.3 Duplicates |
120 | |||
| 11.5.4 Umpire Laboratory Checks |
127 | |||
| 12 Data Verification |
131 | |||
| 12.1.1 GCM Verification |
131 | |||
| 12.1.2 Verifications by SRK |
131 | |||
| 12.2 Limitations |
133 | |||
| 12.3 Opinion on Data Adequacy |
133 | |||
| 13 Mineral Processing and Metallurgical Testing |
134 | |||
| 13.1 Sample Source |
134 | |||
| 13.2 Sample Characterization |
136 | |||
| 1.2 Comminution Testwork |
136 | |||
| 13.3 Flotation Testwork |
136 | |||
| 13.4 Flotation Concentrate Cyanidation Testwork |
138 | |||
| 1.3 Whole-Ore Cyanidation Testwork |
140 | |||
|
BP/KD |
May 2022 |
| SRK Consulting (U.S.), Inc. NI 43-101 Technical Report – Segovia 2021 PFS Update |
Page v |
| 13.5 Estimated Recovery |
142 | |||
| 14 Mineral Resource Estimate |
143 | |||
| 14.1 Drillhole Database |
144 | |||
| 14.2 Geologic Model |
145 | |||
| 14.3 Assay Capping and Compositing |
150 | |||
| 14.3.1 Outliers |
151 | |||
| 14.3.2 Compositing |
162 | |||
| 14.4 Density |
171 | |||
| 14.5 Variogram Analysis and Modeling |
171 | |||
| 14.6 Block Model |
177 | |||
| 14.7 Estimation Methodology |
178 | |||
| 14.7.1 Sensitivity Analysis |
178 | |||
| 14.7.2 Final Parameters |
179 | |||
| 14.8 Model Validation |
184 | |||
| 14.8.1 Visual Comparison |
184 | |||
| 14.8.2 Comparative Statistics |
188 | |||
| 14.8.3 Swath Plots |
198 | |||
| 14.9 Resource Classification |
216 | |||
| 14.10 Mining Depletion |
222 | |||
| 14.11 Mineral Resource Statement |
225 | |||
| 14.12 Mineral Resource Sensitivity |
228 | |||
| 14.12.1 Grade Tonnage Sensitivity |
228 | |||
| 14.12.2 Comparisons to Previous Estimate |
233 | |||
| 14.13 Relevant Factors |
242 | |||
| 15 Mineral Reserve Estimate |
243 | |||
| 15.1 Conversion Assumptions, Parameters and Methods |
244 | |||
| 15.1.1 Dilution |
244 | |||
| 15.1.2 Recovery |
244 | |||
| 15.1.3 Additional Allowance Factors |
245 | |||
| 15.2 Reserve Estimate |
245 | |||
| 15.3 Relevant Factors |
245 | |||
| 16 Mining Methods |
247 | |||
| 16.1 Current Room and Pillar Mining Method |
247 | |||
| 16.1.1 Primary Mining |
247 | |||
| 16.1.2 Secondary Mining |
249 | |||
| 16.2 Current Cut and Fill Mining Method |
249 | |||
| 16.3 Cut-off Grade Calculations |
250 | |||
|
BP/KD |
May 2022 |
| SRK Consulting (U.S.), Inc. NI 43-101 Technical Report – Segovia 2021 PFS Update |
Page vi |
| 16.4 Geotechnical |
253 | |||
| 16.4.1 Geotechnical Gap Assessment |
256 | |||
| 16.5 Hydrogeology |
256 | |||
| 16.6 Surface Water |
258 | |||
| 16.7 Mine Dewatering |
258 | |||
| 16.7.1 Water Data Sources |
259 | |||
| 16.7.2 Dewatering System |
261 | |||
| 16.8 Geochemistry |
275 | |||
| 16.9 Identifying Minable Areas |
275 | |||
| 16.10 Mine Design |
275 | |||
| 16.11 Productivities |
281 | |||
| 16.12 Mine Production Schedule |
282 | |||
| 16.13 Mining Operations |
288 | |||
| 16.13.1 Mine Access |
288 | |||
| 16.13.2 Mine Development |
292 | |||
| 16.14 Ventilation |
293 | |||
| 16.14.1 Basic Airflow Quantity Considerations |
293 | |||
| 16.14.2 Airflow Calculations |
295 | |||
| 16.14.3 Ventilation System Design and Layout |
296 | |||
| 16.14.4 Auxiliary Ventilation Systems |
302 | |||
| 16.14.5 Main Fan Summary |
303 | |||
| 16.14.6 Component Costing Information |
303 | |||
| 16.15 Mine Services |
303 | |||
| 16.15.1 Health & Safety |
303 | |||
| 16.15.2 Labor |
304 | |||
| 16.15.3 Mobile Equipment |
305 | |||
| 17 Recovery Methods |
307 | |||
| 17.1 Processing Methods |
307 | |||
| 17.1.1 Grinding Circuit |
312 | |||
| 17.1.2 Flotation and Regrind Circuit |
312 | |||
| 17.1.3 Cyanidation and Counter-Current-Decantation (CCD) Circuit |
312 | |||
| 17.1.4 Merrill-Crowe and Refining |
313 | |||
| 17.1.5 Tailings |
313 | |||
| 17.2 Production Performance |
313 | |||
| 17.2.1 Historical Plant Production |
313 | |||
| 17.2.2 Current Plant Production |
314 | |||
| 17.3 Process Plant Consumables |
314 | |||
|
BP/KD |
May 2022 |
| SRK Consulting (U.S.), Inc. NI 43-101 Technical Report – Segovia 2021 PFS Update |
Page vii |
| 17.4 Process Plant Operating Costs |
315 | |||
| 18 Project Infrastructure |
317 | |||
| 18.1 Infrastructure and Logistic Requirements |
317 | |||
| 18.1.1 Access, Airports, and Local Communities |
317 | |||
| 18.1.2 Facilities |
320 | |||
| 18.1.3 Compressed Air Systems |
325 | |||
| 18.1.4 Diesel Supply and Storage |
326 | |||
| 18.1.5 Natural Gas and Propane Supply |
327 | |||
| 18.1.6 Power Supply and Distribution |
327 | |||
| 18.1.7 Security |
330 | |||
| 18.1.8 Communications |
330 | |||
| 18.1.9 Logistics Requirements |
330 | |||
| 18.1.10 Site Water Management |
330 | |||
| 18.1.11 Water Management |
330 | |||
| 18.1.12 Water Supply |
331 | |||
| 18.2 Tailings Management Area |
332 | |||
| 18.2.1 General Description |
332 | |||
| 18.2.2 Operation |
334 | |||
| 18.2.3 Phase 2A Construction Procedures and Design |
337 | |||
| 18.2.4 Foundation |
338 | |||
| 18.2.5 Water Management |
338 | |||
| 18.2.6 Review of Previous Relevant and Updated Recommendations |
340 | |||
| 19 Market Studies and Contracts |
344 | |||
| 19.1 Summary of Information |
344 | |||
| 19.2 Commodity Price Projections |
344 | |||
| 20 Environmental Studies, Permitting and Social or Community Impact |
345 | |||
| 20.1 Environmental Studies |
345 | |||
| 20.1.1 Environmental Setting |
345 | |||
| 20.1.2 Baseline Environmental Data |
345 | |||
| 20.1.3 Geochemistry |
346 | |||
| 20.2 Mine Waste Management |
348 | |||
| 20.2.1 Waste Rock |
348 | |||
| 20.2.2 Tailings |
348 | |||
| 20.2.3 Site Monitoring |
349 | |||
| 20.3 Project Permitting Requirements |
349 | |||
| 20.3.1 General Mining Authority |
349 | |||
| 20.3.2 Environmental Authority |
349 | |||
|
BP/KD |
May 2022 |
| SRK Consulting (U.S.), Inc. NI 43-101 Technical Report – Segovia 2021 PFS Update |
Page viii |
| 20.3.3 Environmental Regulations and Impact Assessment |
350 | |||
| 20.3.4 Water Quality and Water Rights |
351 | |||
| 20.3.5 Air Quality and Ambient Noise |
352 | |||
| 20.3.6 Fauna and Flora Protection |
353 | |||
| 20.3.7 Protection of Cultural Heritage or Archaeology |
353 | |||
| 20.3.8 Segovia Concession and Permit Status |
353 | |||
| 20.3.9 Performance and Reclamation Bonding |
355 | |||
| 20.4 Environmental and Social Management |
356 | |||
| 20.4.1 Stakeholder Engagement |
358 | |||
| 20.4.2 Artisanal and Small-Scale Mining Operations |
358 | |||
| 20.5 Mine Closure and Reclamation |
361 | |||
| 20.5.1 Closure Costs |
362 | |||
| 21 Capital and Operating Costs |
364 | |||
| 21.1 Capital Cost Estimates |
364 | |||
| 21.1.1 Basis for the Capital Cost Estimates |
365 | |||
| 21.2 Operating Cost Estimates |
368 | |||
| 21.2.1 Basis for the Operating Cost Estimate |
368 | |||
| 22 Economic Analysis |
371 | |||
| 22.1 External Factors |
371 | |||
| 22.2 Principal Assumptions and Input Parameters |
371 | |||
| 22.3 Taxes, Royalties and Other Interests |
373 | |||
| 22.4 Results |
373 | |||
| 22.5 Sensitivity Analysis |
375 | |||
| 23 Adjacent Properties |
378 | |||
| 24 Other Relevant Data and Information |
379 | |||
| 25 Interpretation and Conclusions |
381 | |||
| 25.1 Geology and Resources |
381 | |||
| 25.2 Mineral Processing and Metallurgical Testing |
382 | |||
| 25.3 Mining & Reserves |
383 | |||
| 25.3.1 Geotechnical |
383 | |||
| 25.3.2 Mine Design |
383 | |||
| 25.4 Recovery Methods |
383 | |||
| 25.5 Project Infrastructure |
384 | |||
| 25.6 Water Management |
384 | |||
| 25.7 Environmental Studies and Permitting |
384 | |||
| 25.7.1 Geochemistry |
386 | |||
| 25.8 Economic Analysis |
386 | |||
|
BP/KD |
May 2022 |
| SRK Consulting (U.S.), Inc. NI 43-101 Technical Report – Segovia 2021 PFS Update |
Page ix |
| 25.9 Foreseeable Impacts of Risks |
387 | |||
| 26 Recommended Work Programs |
388 | |||
| 26.1 Geology and Resources |
388 | |||
| 26.2 Mining and Mineral Reserve Estimate |
389 | |||
| 26.2.1 Mining |
389 | |||
| 26.2.2 Geotechnical |
389 | |||
| 26.3 Recovery Methods |
390 | |||
| 26.4 Project Infrastructure |
390 | |||
| 26.4.1 General Infrastructure |
390 | |||
| 26.4.2 Tailings |
390 | |||
| 26.5 Water |
391 | |||
| 26.5.1 Geochemistry |
391 | |||
| 26.5.2 Surface Water |
392 | |||
| 26.5.3 Groundwater |
392 | |||
| 26.6 Environmental Studies and Permitting |
393 | |||
| 26.7 Recommended Work Program Costs |
394 | |||
| 27 References |
396 | |||
| 28 Glossary |
398 | |||
| 28.1 Mineral Resources |
398 | |||
| 28.2 Mineral Reserves |
398 | |||
| 28.3 Definition of Terms |
399 | |||
| 28.4 Abbreviations |
400 | |||
| List of Tables | ||||
| Table 1-1: Comparison of the Mineral Resource Cut-Off Grade Assumptions 2019 Versus 2020 |
7 | |||
| Table 1-2: SRK Mineral Resource Statement for the Segovia and Carla Projects Dated December 31, 2021 – |
||||
| SRK Consulting (U.S.), Inc. |
8 | |||
| Table 1-3: GCM Segovia Mineral Reserves Estimate as of December 31, 2021 |
11 | |||
| Table 1-4: Segovia Sustaining Capital Cost Estimate Summary |
17 | |||
| Table 1-5: Segovia Operating Costs Summary |
17 | |||
| Table 1-6: Segovia Cash Costs 1 |
18 | |||
| Table 1-7: Segovia Indicative Economic Results |
22 | |||
| Table 1-8: Segovia LoM Annual Production and Revenues |
22 | |||
| Table 2-1: Site Visit Participants |
25 | |||
| Table 4-1: Mineral Tenure Information |
32 | |||
| Table 6-1: SRK Mineral Resource Statement for the Segovia and Carla Projects with Effective Date of |
||||
| December 31, 2020 |
47 | |||
|
BP/KD |
May 2022 |
| SRK Consulting (U.S.), Inc. NI 43-101 Technical Report – Segovia 2021 PFS Update |
Page x |
| Table 6-2: Summary Statistics for Total Gold Production at Providencia, El Silencio, Sandra K, and Carla Mines |
||||
| 2000 to 2021 1 |
48 | |||
| Table 6-3: Summary Statistics for Total Production Including Contractors 2017 to 2021 |
49 | |||
| Table 6-4: Summary Statistics for Company-Operated Production 2017 to 2021 |
49 | |||
| Table 6-5: Contract Miners Operated Mining Areas Summary Statistics for 2017 to 2021 |
50 | |||
| Table 9-1: Summary of Sampling Sources in Exploration Database |
80 | |||
| Table 10-1: Summary of the Data Available per Mine by Sample Type |
88 | |||
| Table 11-1: Summary of 2020 and 2021 Density Sampling by Lithology |
110 | |||
| Table 11-2: Quality Control Data Produced by the Company for the Project (2021) |
111 | |||
| Table 11-3: Summary of Certified Reference Material Produced by GEOSTATS, Rocklabs and Oreas and Submitted by GCM Exploration in Drilling/Channel Submissions to External Laboratories in 2020 and 2021 |
112 | |||
| Table 11-4: Summary of Certified Reference Material Produced by GEOSTATS, Rocklabs and Oreas and |
||||
| Submitted by GCM Mines in Drilling/Channel Submissions to External Laboratories in 2020 and 2021 |
113 | |||
| Table 13-1: Drillholes Used for the Carla Vein Composite |
134 | |||
| Table 13-2: Carla Vein Composite Head Analyses |
136 | |||
| Table 13-3: Summary of BWI Test on the Carla Test Composite |
136 | |||
| Table 13-4: Flotation Test Results on Carla Test Composite |
137 | |||
| Table 13-5: Gold Extraction from Flotation Concentrate Produced from Carla Test Composite |
139 | |||
| Table 13-6: Silver Extraction from Flotation Concentrate Produced from Carla Test Composite |
139 | |||
| Table 13-7: Whole-Ore Gold Extraction from Carla Test Composite |
141 | |||
| Table 13-8: Whole-Ore Silver Extraction from Carla Test Composite |
141 | |||
| Table 13-9: Estimated Gold and Silver Recovery from Carla Ore |
142 | |||
| Table 14-1: Summary of Final Geological Domain and Coding |
149 | |||
| Table 14-2: Example of Capping Statistical Analysis Completed per Domain (Low-Grade and High-Grade Veta Manto – El Silencio) |
154 | |||
| Table 14-3: Summary of Raw versus Capped Samples |
165 | |||
| Table 14-4: Summary of Raw versus Capped Samples at El Silencio |
166 | |||
| Table 14-5: Summary of Raw versus Capped Samples at Sandra K |
168 | |||
| Table 14-6: Summary of Raw versus Capped Samples at Carla and Las Verticales |
169 | |||
| Table 14-7: Summary of Raw versus Capped Samples at Vera |
170 | |||
| Table 14-8: Final Variogram Parameters |
176 | |||
| Table 14-9: Details of Block Model Dimensions for the Project Geological Model |
177 | |||
| Table 14-10: Summary of Block Model Fields (Used for Flagging Various Geological Properties) |
177 | |||
| Table 14-11: Summary of Final Kriging Parameters for the Segovia Project |
180 | |||
| Table 14-12: Summary of Validation Statistics Composites Versus OK Estimates |
191 | |||
| Table 14-13: Comparison of the Mineral Resource Cut-Off Grade Assumptions 2020 Versus 2021 |
226 | |||
| Table 14-14: SRK Mineral Resource Statement for the Segovia and Carla Projects, Dated December 31, 2021 |
227 | |||
|
BP/KD |
May 2022 |
| SRK Consulting (U.S.), Inc. NI 43-101 Technical Report – Segovia 2021 PFS Update |
Page xi |
| Table 14-15: Block Model Quantities and Grade Estimates, Providencia Deposit at Various Cut-off Grades |
229 | |||
| Table 14-16: Block Model Quantities and Grade Estimates, El Silencio Deposit at Various Cut-off Grades |
230 | |||
| Table 14-17: Block Model Quantities and Grade Estimates, Sandra K Deposit at Various Cut-off Grades |
231 | |||
| Table 14-18: Block Model Quantities and Grade Estimates, Las Verticales Deposit at Various Cut-off Grades |
232 | |||
| Table 14-19: Block Model Quantities and Grade Estimates, Carla Deposit at Various Cut-off Grades |
232 | |||
| Table 14-20: Block Model Quantities and Grade Estimates, Vera Deposit at Various Cut-off Grades |
232 | |||
| Table 14-21: Mineral Resource Comparison to Previous Estimates for all Mines |
241 | |||
| Table 15-1: Dilution Assumptions |
244 | |||
| Table 15-2: Mining Extraction/Recovery Assumptions |
244 | |||
| Table 15-3: GCM Mineral Reserves Estimate as of December 31, 2021 |
245 | |||
| Table 16-1: Underground Cut-off Grade Calculation |
250 | |||
| Table 16-2: PFS Design Parameters |
254 | |||
| Table 16-3: Dewatering System in Sandra K |
261 | |||
| Table 16-4: Dewatering System in Providencia |
265 | |||
| Table 16-5: Planned Dewatering System |
267 | |||
| Table 16-6: Dewatering System in El Silencio |
270 | |||
| Table 16-7: Dewatering System in Carla Mine |
273 | |||
| Table 16-8: Reserve Totals by Area and Mining Type |
281 | |||
| Table 16-9: Schedule Parameters for Underground Mining |
281 | |||
| Table 16-10: Productivities Used in the Production Schedule 1 |
282 | |||
| Table 16-11: Segovia Mine Production Summarized Schedule |
283 | |||
| Table 16-12: Recommended Maximum Air Velocities for Various Airway Types |
295 | |||
| Table 16-13: Airflow Calculation for Personnel and Diesel Dilution |
296 | |||
| Table 16-14: Ramp Development Equipment |
302 | |||
| Table 16-15: Single Heading Stope Equipment |
302 | |||
| Table 16-16: Summary of Main Fan Operating Points |
303 | |||
| Table 16-17: Mobile Equipment by Mine Area |
306 | |||
| Table 17-1: Plant Expansion Costs (US$) |
307 | |||
| Table 17-2: Segovia Process Plant Major Equipment List |
309 | |||
| Table 17-3: Historic Production Summary |
314 | |||
| Table 17-4: Summary of Maria Dama Process Plant Production (2019 to 2021) |
314 | |||
| Table 17-5: Process Plant Reagent and Grinding Media Usage |
315 | |||
| Table 17-6: Maria Dama Process Plant Operating Costs (2020 and 2021) |
316 | |||
| Table 18-1: Compressors Listing for Operating Mines |
325 | |||
| Table 19-1: Segovia Price Assumptions |
344 | |||
| Table 19-2: Segovia Net Smelter Return Terms |
344 | |||
|
BP/KD |
May 2022 |
| SRK Consulting (U.S.), Inc. NI 43-101 Technical Report – Segovia 2021 PFS Update |
Page xii |
| Table 20-1: Water Concessions Granted to the Operation |
351 | |||
| Table 20-2: Industrial Discharge Authorizations |
352 | |||
| Table 20-3: Domestic Discharge Authorizations |
352 | |||
| Table 20-4: Channel Occupation Permit |
352 | |||
| Table 21-1: Segovia Sustaining Capital Cost Estimate Summary |
365 | |||
| Table 21-2: Development Unit Costs |
366 | |||
| Table 21-3: Providencia Annual Development Meters |
366 | |||
| Table 21-4: Sandra K Annual Development Meters |
366 | |||
| Table 21-5: Carla Annual Development Meters |
367 | |||
| Table 21-6: El Silencio Annual Development Meters |
367 | |||
| Table 21-7: Development Capital Costs |
367 | |||
| Table 21-8: Total Yearly Capital Costs ($000’s) |
368 | |||
| Table 21-9: Segovia Operating Costs Summary |
368 | |||
| Table 21-10: Segovia Mining Costs |
369 | |||
| Table 21-11: Segovia Processing and G&A Costs |
369 | |||
| Table 21-12: Segovia Operating Costs ($000’s) |
370 | |||
| Table 22-1: Segovia Price Assumptions |
371 | |||
| Table 22-2: Segovia Net Smelter Return Terms |
371 | |||
| Table 22-3: Segovia Yearly Mine Production Assumptions |
372 | |||
| Table 22-4: Segovia LoM Mill Production Assumptions |
373 | |||
| Table 22-5: Segovia Indicative Economic Results |
374 | |||
| Table 22-6: Segovia LoM Annual Production and Revenues |
375 | |||
| Table 22-7: Segovia Cash Costs1 |
375 | |||
| Table 24-1: Additional Material at the Maria Dama Process Facility (2017 to 2021) |
379 | |||
| Table 24-2: Segovia Historical Gold and Silver Production 2007 to 2020 |
380 | |||
| Table 26-1: Summary of Costs for Recommended Work |
395 | |||
| Table 28-1: Definition of Terms |
399 | |||
| Table 28-2: Abbreviations |
400 | |||
| List of Figures |
||||
| Figure 1-1: Segovia Mine Production by Area |
13 | |||
| Figure 1-2: All-in Sustaining Cash Cost Breakdown |
19 | |||
| Figure 1-3: Direct Cash Costs |
20 | |||
| Figure 1-4: Segovia After-Tax Free Cash Flow, Capital and Metal Production |
21 | |||
| Figure 4-1: Location Map of the Segovia Project |
29 | |||
| Figure 4-2: License Boundaries for Segovia and Carla Projects |
30 | |||
|
BP/KD |
May 2022 |
| SRK Consulting (U.S.), Inc. NI 43-101 Technical Report – Segovia 2021 PFS Update |
Page xiii |
| Figure 4-3: Location Map Showing Segovia License Boundary and Current Mines |
33 | |||
| Figure 4-4: Land Tenure Map |
35 | |||
| Figure 4-5: Photography Showing the Location of the Carla Mine and the Boundary of the Land Property (Rented) |
36 | |||
| Figure 4-6: Map Showing the Location and Boundaries Defining the Chicharron Project |
37 | |||
| Figure 5-1: Map Showing Road Access to Segovia Property and Major Routes through the Department of Antioquia |
41 | |||
| Figure 7-1: Regional Geologic Map Illustrating the Location of the Segovia Mining Concession |
52 | |||
| Figure 7-2: Schematic Plan Showing the Main Mineralization Zones at Segovia, with Additional Mine Areas Shown in Grey |
54 | |||
| Figure 7-3: Schematic Cross Section (SW-NE) Showing Example of the Mineralized Veins (a) El Silencio and Sandra K (b) Las Verticales and Providencia |
55 | |||
| Figure 7-4: Providencia Vein Styles |
57 | |||
| Figure 7-5: Vein Styles in the El Silencio Vein System |
58 | |||
| Figure 7-6: Mineralized Zone at Providencia, Intersected in Drillhole PV-IU-054 at 30.47 m, as Observed by SRK (Highest Grade Areas Highlighted by Magenta Tags) |
59 | |||
| Figure 7-7: Significant Mineralization at Providencia, Intersected in Drillhole DS-0089 at 453.54 m, as Observed by SRK |
60 | |||
| Figure 7-8: Procedural Core Photography for Drillhole DS0089 Completed by the Company During Data Acquisition |
60 | |||
| Figure 7-9: Typical Thickness of the Providencia (top) and Sandra K (bottom) Veins, as Exposed in Underground Workings |
61 | |||
| Figure 7-10: Vein Exposures in Underground Workings at El Silencio Showing Relationship with Dikes (left) and Typical Vein Thickness (right) |
62 | |||
| Figure 7-11: Sketch Model for Syn-Mineralization Deformation at Segovia |
64 | |||
| Figure 7-12: Common Plunge of Gold Mineralization in the Segovia District |
65 | |||
| Figure 7-13: Presence of Galena Related to Elevated Gold Grades at Sandra K, in Drillhole DS0130 Showing 30 cm at 311.34 g/t gold (Free Gold Highlighted) |
66 | |||
| Figure 7-14: Mineralized Quartz Vein Within the GCM Exploration Adit |
68 | |||
| Figure 9-1: Example of UG Workings Digitalization and Location Validation Exercised by GCM of Historical Sampling Based on Historical Maps for Patio (top) and Julio Veins (bottom) of Cogote Mine |
73 | |||
| Figure 9-2: GCM Sampling Procedures 2012 to 2016 |
75 | |||
| Figure 9-3: Channel Sampling Final Markups by Company During Pre-2016 Sampling Program |
76 | |||
| Figure 9-4: Channel Sampling Completed by GCM During 2016 Sampling Program |
78 | |||
| Figure 9.9-5: Logging Sheets Used for the Company Channel Sampling Program |
79 | |||
| Figure 9.9-6: Mine Sampling Split by Data Source for Providencia |
80 | |||
| Figure 9-7: Mine Sampling Split by Data Source for El Silencio |
81 | |||
| Figure 9.9-8: Mine Sampling Split by Data Source for Sandra K |
82 | |||
| Figure 9-9: Mine Sampling Split by Data Source for Vera |
83 | |||
| Figure 10-1: Underground Drilling Rig (LM30) in Use at Providencia, (H200) at El Silencio and Sandra K (bottom) |
87 | |||
|
BP/KD |
May 2022 |
| SRK Consulting (U.S.), Inc. NI 43-101 Technical Report – Segovia 2021 PFS Update |
Page xiv |
| Figure 10-2: Sampling Data at Providencia, Sandra K, and El Silencio Colored by Database Phase (Orange indicates New Data) |
91 | |||
| Figure 10-3: Drilling and Sampling Locations at Carla Project |
92 | |||
| Figure 10-4: Drilling and Sampling Locations at Vera Project |
93 | |||
| Figure 10-5: New Core Storage Facility and Logging Room at Segovia |
96 | |||
| Figure 10-6: Example of Core Photography Setup (left) and Core Photographs (right) |
97 | |||
| Figure 10-7: Cross Section (65 m Clipping Width) Through the Providencia Deposit, Showing Typical Drillhole Orientation, Looking West |
98 | |||
| Figure 10-8: Oblique View, Showing Wedge Drilling Location in Lower Levels of El Silencio |
99 | |||
| Figure 10-9: Summary of key intersections at Providencia |
101 | |||
| Figure 10-10: Summary of key intersections at El Silencio (top = south, bottom = north) |
102 | |||
| Figure 10-11: Summary of key intersections at Sandra K |
103 | |||
| Figure 11-1: Core Storage Facility at the Carla Project |
105 | |||
| Figure 11-2: Mine Laboratory at Segovia, Showing Crusher, Pulverizer, Furnace and AA Assay Capture |
108 | |||
| Figure 11-3: Core Sample Coated in Paraffin Wax with Logging Sheet, Prior to Entry to the Database |
109 | |||
| Figure 11-4: Control Charts Showing Performance of Au CSRMs with Exploration Sample Submissions |
115 | |||
| Figure 11-5: Control Charts Showing Performance of Au CSRMs with Mine Sample Submissions |
117 | |||
| Figure 11-6: Coarse Blank Analysis (Au) for GCM Mine Submissions (blue dots) at Segovia Laboratory |
118 | |||
| Figure 11-7: Coarse Blank Analysis (Au) for GCM Mine Submissions at SGS (Colombia) Laboratory |
118 | |||
| Figure 11-8: Pulp Blank Analysis (Au) for GCM Exploration Submissions |
119 | |||
| Figure 11-9: Coarse Blank Analysis (Au) for GCM Exploration Submissions |
119 | |||
| Figure 11-10: Au Dispersion Plots for Segovia Mine Geology Field Duplicates – Carla |
121 | |||
| Figure 11-11: Au Dispersion Plots for Segovia Exploration (top image) and Mine Geology (bottom image) Drill Core Duplicates |
123 | |||
| Figure 11-12: Au Dispersion Plots for Segovia Exploration (top image) and Mine Geology (bottom image) Reject Duplicates |
125 | |||
| Figure 11-13: Au Dispersion Plots for Segovia Exploration (top image) and Mine Geology (bottom image) Pulp Duplicates Including |
127 | |||
| Figure 11-14: Comparison of Umpire Laboratory Check Analysis Between GCM Laboratory and SGS Colombia – 2020 – March 2021 – Mine Geology Department |
129 | |||
| Figure 11-15: Comparison of Umpire Laboratory Check Analysis Between GCM Laboratory and ALS Medellín – 2020 – Exploration Department |
129 | |||
| Figure 13-1: Location of Drill Core Intervals Used to Formulate the Carla Composite |
135 | |||
| Figure 13-2: Gold, Silver and Sulfur Recovery Versus Mass % to Concentrate |
138 | |||
| Figure 13-3: Gold Extraction from Flotation Concentrate Versus Leach Retention Time |
139 | |||
| Figure 13-4: Silver Extraction from Flotation Concentrate Versus Leach Retention Time |
140 | |||
| Figure 13-5: Whole-Ore Gold Extraction Versus Leach Retention Time |
141 | |||
| Figure 13-6: Whole-Ore Silver Extraction Versus Leach Retention Time |
142 | |||
| Figure 14-1: Summary of Log-Probability Analysis to Test for Breaks in Trend |
147 | |||
|
BP/KD |
May 2022 |
| SRK Consulting (U.S.), Inc. NI 43-101 Technical Report – Segovia 2021 PFS Update |
Page xv |
| Figure 14-2: Plots Showing Orientation of High-Grade Shoots from Top Left (Clockwise), Providencia, Telluris Consulting Structural Control Model, El Silencio, And Sandra K (December 2021) |
149 | |||
| Figure 14-3: Example of Raw Au Histogram and Log-Probability Plots for Veta Manto, El Silencio - Low-Grade Domain |
152 | |||
| Figure 14-4: Log Probability Plots Showing Impact of Capping to Various Levels on the Mean (El Silencio – Veta Manto: Top image: Low-grade; Bottom image: High-grade) |
153 | |||
| Figure 14-5: Example of Raw versus Capped Histogram and Log-Probability Plots for Providencia Low-Grade Domain (HG=10) |
156 | |||
| Figure 14-6: Example of Raw versus Capped Histogram and Log-Probability Plots for Providencia High-Grade Domain (HG=20) |
157 | |||
| Figure 14-7: Example of Raw versus Capped Histogram and Log-Probability Plots for El Silencio Veta Manto Low-Grade Domain (HG=10) |
158 | |||
| Figure 14-8: Example of Raw versus Capped Histogram and Log-Probability Plots for El Silencio Veta Manto High-Grade Domain (HG=20) |
158 | |||
| Figure 14-9: Example of Raw versus Capped Histogram and Log-Probability Plots for Sandra-K Veta Techo |
||||
| Low-Grade Domain (HG=10) |
159 | |||
| Figure 14-10: Example of Raw versus Capped Histogram and Log-Probability Plots for Sandra K Veta Techo High-Grade Domain (HG=20) |
160 | |||
| Figure 14-11: Example of Raw versus Capped Histogram and Log-Probability Plots for Carla Veta Domain (HG=10) |
161 | |||
| Figure 14-12: Example of Raw versus Capped Histogram and Log-Probability Plots for Veta Vera Domain (Vera LG, HG=10) |
162 | |||
| Figure 14-13: Log Probability Plots of Sample Lengths within (a) Providencia, (b) El Silencio (c) Sandra K Veins and (d) Carla Mine |
164 | |||
| Figure 14-14: Summary of Modeled Directional Semi-Variogram Parameters for the Providencia for Gold – Domains 10 and 20 |
173 | |||
| Figure 14-15: Summary of Modeled Semi-Variogram Parameters for the Sandra K for Gold - Domains 10 and 20 |
174 | |||
| Figure 14-16: Summary of Modeled Semi-Variogram Parameters for the El Silencio for Gold - Domains 10 and 20 – Veta Manto |
175 | |||
| Figure 14-17: Examples of Visual Validation of Grade Distribution Composites Versus Block Model – Providencia |
184 | |||
| Figure 14-18: Examples of Visual Validation of Grade Distribution Composites Versus Block Model - El Silencio |
185 | |||
| Figure 14-19: Examples of Visual Validation of Grade Distribution Composites Versus Block Model - Sandra K |
186 | |||
| Figure 14-20: Examples of Visual Validation of Grade Distribution Composites Versus Block Model - Las Verticales |
187 | |||
| Figure 14-21: Examples of Visual Validation of Grade Distribution Composites Versus Block Model – Carla |
187 | |||
| Figure 14-22: Examples of Visual Validation of Grade Distribution Composites Versus Block Model – Vera Vein |
188 | |||
| Figure 14-23: Swath Analysis at Providencia HG=10 |
200 | |||
| Figure 14-24: Swath Analysis at Providencia HG=20 |
202 | |||
|
BP/KD |
May 2022 |
| SRK Consulting (U.S.), Inc. NI 43-101 Technical Report – Segovia 2021 PFS Update |
Page xvi |
| Figure 14-25: Example of Swath Analysis at El Silencio HG=10 |
204 | |||
| Figure 14-26: Example of Swath Analysis at El Silencio HG=20 |
206 | |||
| Figure 14-27: Example of SWATH Analysis Completed at Sandra K (HG=10) |
208 | |||
| Figure 14-28: Example of SWATH Analysis Completed at Sandra K (HG=20) |
210 | |||
| Figure 14-29: Example of SWATH Analysis Completed at Vera (HG=10) |
212 | |||
| Figure 14-30: Example of SWATH Analysis Completed at Vera (HG=20) |
214 | |||
| Figure 14-31: Example of SWATH Analysis Completed at Carla (HG=10) |
216 | |||
| Figure 14-32: Plan View Showing Classification at Providencia Example |
218 | |||
| Figure 14-33: Plan View Showing Classification at El Silencio Showing Main Veins |
219 | |||
| Figure 14-34: Plan View Showing Classification at Sandra K Showing Veta Techo and Chumeca |
220 | |||
| Figure 14-35: Plan View Showing Classification at Carla |
221 | |||
| Figure 14-36: Plan View Showing Classification at Vera |
222 | |||
| Figure 14-37: 3D Schematic View Showing 2D Polylines and 3D Wireframes of Mine Depletions at El Silencio |
224 | |||
| Figure 14-38: Example of Depletion Limits (Providencia), with Depletion Shown in Purple and Remaining Pillars in Green |
225 | |||
| Figure 14-39: Waterfall Charts Detailing the Main Changes per Model by Classification (M&I = Top, and Inferred = Bottom) |
235 | |||
| Figure 14-40: Reconciliation of El Silencio Significant Changes |
236 | |||
| Figure 14-41: Reconciliation of Sandra K Significant Changes |
237 | |||
| Figure 14-42: Reconciliation of Sandra K Patio Vein Significant Changes |
238 | |||
| Figure 14-43: Reconciliation of Sandra K Julio Vein Significant Changes |
239 | |||
| Figure 15-1: Segovia Reserve Areas |
243 | |||
| Figure 16-1: Typical Mining Layout |
248 | |||
| Figure 16-2: Providencia Grade/Tonne Curve (Measured and Indicated Material) |
251 | |||
| Figure 16-3: El Silencio Grade/Tonne Curve (Measured and Indicated Material) |
252 | |||
| Figure 16-4: Sandra K Grade/Tonne Curve (Measured and Indicated Material) |
252 | |||
| Figure 16-5: Carla Grade/Tonne Curve (Measured and Indicated Material) |
252 | |||
| Figure 16-6: Preliminary Potentiometric Surface in Mine Area |
257 | |||
| Figure 16-7: Measured Dewatering Rates |
260 | |||
| Figure 16-8: Hydrogeological Reconnaissance - Sandra K Mine |
263 | |||
| Figure 16-9: Hydrogeological Reconnaissance - Providencia Mine |
269 | |||
| Figure 16-10: Hydrogeological Reconnaissance - El Silencio Mine |
272 | |||
| Figure 16-11: Hydrogeological Reconnaissance – Carla Mine |
274 | |||
| Figure 16-12: Providencia Mine Design, Colored by Au Grade (Rotated View) |
277 | |||
| Figure 16-13: El Silencio Mine Design, Colored by Au Grade (Rotated View) |
278 | |||
| Figure 16.16-14: Sandra K Mine Design, Colored by Au Grade (Rotated View) |
279 | |||
| Figure 16-15: Carla Mine Design, Colored by Au Grade (Rotated View) |
280 | |||
|
BP/KD |
May 2022 |
| SRK Consulting (U.S.), Inc. NI 43-101 Technical Report – Segovia 2021 PFS Update |
Page xvii |
| Figure 16-16: Segovia Mine Production by Area |
283 | |||
| Figure 16-17: Providencia Mine Production Schedule Colored by Time Period (rotated view looking southwest) |
284 | |||
| Figure 16-18: El Silencio Mine Production Schedule Colored by Time Period (Rotated View Looking West) |
285 | |||
| Figure 16-19: Sandra K Mine Production Schedule Colored by Time Period (rotated view looking westward) |
286 | |||
| Figure 16-20: Carla Mine Production Schedule Colored by Time Period (rotated view looking west) |
287 | |||
| Figure 16-21: In Situ Au Ounces by Mine |
288 | |||
| Figure 16-22: Providencia Mine Ore Path to Surface |
289 | |||
| Figure 16-23: El Silencio Mine Ore Path to Surface (rotated view) |
290 | |||
| Figure 16-24: Sandra K Mine Ore Path to Surface (rotated view) |
291 | |||
| Figure 16-25: Carla Mine Ore Path to Surface (rotated view) |
292 | |||
| Figure 16-26: Providencia Mine Infrastructure Additions |
297 | |||
| Figure 16-27: El Silencio Base of Alimak Infrastructure Layout |
299 | |||
| Figure 16-28: Sandra K Ventilation Model Layout and Identification |
300 | |||
| Figure 16-29: Ventilation Sequences for Carla Mine |
301 | |||
| Figure 17-1: Process Flowsheet |
308 | |||
| Figure 17-2: Maria Dama General Arrangement Drawing |
311 | |||
| Figure 18-1: General Location |
317 | |||
| Figure 18-2: Project Access |
318 | |||
| Figure 18-3: Site Map |
319 | |||
| Figure 18-4: Maria Dama Plant Facilities |
321 | |||
| Figure 18-5: El Silencio Facilities |
322 | |||
| Figure 18-6: Providencia Mine Facilities |
323 | |||
| Figure 18-7: Sandra K Facilities |
324 | |||
| Figure 18-8: Carla Facilities |
325 | |||
| Figure 18-9: Compressor Room at Sandra K |
326 | |||
| Figure 18-10: Segovia One-Line Electrical Schematic |
328 | |||
| Figure 18-11: Maria Dama Water Storage Pond |
331 | |||
| Figure 18-12: General Layout Site Plan |
334 | |||
| Figure 18-13: General Arrangement and Section View of El Choco Phase 1C |
336 | |||
| Figure 18-14: General Arrangement and Section View of El Choco’s Phase 1C |
337 | |||
| Figure 18-15: Phase 2A Clear and Grub – December 2021 |
338 | |||
| Figure 18-16: Underdrain Collection System |
339 | |||
| Figure 18-17: Phase 2A East and West Stormwater Diversion Channels |
340 | |||
| Figure 20-1: BPS Initiative Work-Flow Diagram |
357 | |||
| Figure 20-2: Formalization of ASM at Segovia |
360 | |||
|
BP/KD |
May 2022 |
| SRK Consulting (U.S.), Inc. NI 43-101 Technical Report – Segovia 2021 PFS Update |
Page xviii |
| Figure 20-3: Reduction in Tons of Mercury per Year |
361 | |||
| Figure 22-1: Segovia Mine Production Profile |
372 | |||
| Figure 22-2: Segovia After-Tax Free Cash Flow, Capital and Metal Production |
374 | |||
| Figure 22-3: Segovia Cumulative Discounted Cash Flow Curves |
376 | |||
| Figure 22-4: Segovia NPV Sensitivity to Hurdle Rate |
376 | |||
| Figure 22-5: Segovia NPV Sensitivity (US$000’s) |
377 | |||
| Figure 25-1: All-In Sustaining Cash Cost Breakdown |
386 | |||
| Figure 25-2: Direct Cash Costs |
387 | |||
Appendices
Appendix A: Certificates of Qualified Persons
Appendix B: Detailed Production Scheduled Information
Appendix C: Annual TEM Detail
|
BP/KD |
May 2022 |
| SRK Consulting (U.S.), Inc. NI 43-101 Technical Report – Segovia 2021 PFS Update |
Page 1 |
| 1 | Summary |
This report was prepared as a prefeasibility-level (PFS) Canadian National Instrument 43-101 (NI 43-101) Technical Report (Technical Report) for GCM Mining Corp. (GCM or Company) by SRK Consulting (U.S.), Inc. (SRK) on the Segovia Project, which is comprised of several areas named Providencia, El Silencio, Sandra K, Carla, and Las Verticales Veins System (Las Aves, Pomarosa and Pomarosa 2 shears). The Las Verticales Vein System is currently considered to be at the exploration stage and is therefore reported within the Mineral Resources but is excluded from the prefeasibility study due to the level of confidence at the current stage.
The metric system has been used throughout this report. Tonnes (t) are metric of 1,000 kilograms (kg), or 2,204.6 pounds (lb). All currency is in U.S. dollars (US$) unless otherwise stated.
| 1.1 | Property Description and Ownership |
The Segovia Project (Segovia or the Segovia Project) is a gold mining complex located in Colombia’s Segovia-Remedios mining district, Department of Antioquia, north-west Colombia approximately 180 kilometers (km) northeast of Medellín (the Department capital of Antioquia), at 74° 42’ W and 7° 04’ N. Within the Segovia Project area, the Company is current producing from four underground mines, Providencia, El Silencio, Sandra K and Carla. The Carla Project (Carla, or the Carla Project) is located approximately 10 km southeast of Segovia at approximately 7° 04’ 18.0’’ N, 74° 41’ 55.5’ W.
| 1.2 | Geology and Mineralization |
Gold mineralization at Segovia occurs in mesothermal quartz-sulfide veins hosted by granodiorites of the Segovia Batholith. The well-known, partially exploited veins dip at approximately 30° to the E or NE. There are also a number of steeply dipping quartz veins with a N40W trend in the western part of the concession, termed the Las Verticales veins.
In general, the veins are formed of quartz with minor calcite and coarse-grained sulfides comprising of pyrite, galena and sphalerite, and typically show a close spatial relationship with basaltic dikes. Gold and electrum occur as fine grains (less than 20 microns) and visible gold is generally uncommon. Native silver has been reported. The wall-rock alteration to the veins affects the basalt to andesite dikes and the granodiorite in a narrow zone a few meters (m) wide with potassic (biotite), argillic (illite) and propylitic alteration most commonly encountered along with selective mineral replacement by chlorite, epidote, pyrite and calcite.
SRK understands that the white crystalline quartz is not associated with gold. The laminated quartz veins are associated with low-grade (less than 10 grams per tonne [g/t]) gold, and the quartz-sulfide open spaced filling veins are associated with high-grade (more than 10 g/t) gold.
The modelled vein at Providencia is geologically continuous along strike for approximately 2 km and has a confirmed down dip extent that ranges from 690 m to greater than 1.3 km, and an average thickness of 0.9 m, reaching over 5 m in areas of significant swelling and less than 0.1 m where the vein pinches. Locally, the Providencia vein displays significant disruption by faulting, pinch and swell structures, fault brecciation and fault gouge.
Exploration work and mining activity at Sandra K confirms the previous geological interpretation. The current known mineralization extends 2 km along strike and extends approximately 0.7 km down-drip,
|
BP/KD |
May 2022 |
| SRK Consulting (U.S.), Inc. NI 43-101 Technical Report – Segovia 2021 PFS Update |
Page 2 |
which remains open to depth, with the current limits being restricted in parts to the current mining license. Additional validation of data from historical mines, previously mined by local contract miners have increased the potential for additional mineral resources within the vicinity of the Sandra K mine. These areas include the previously mined Cogote mine and the Vera mine. In 2020 and 2021 work was focused on validation and capture of the Cogote mine database, to connect to the previous modelled structures intercepted at depth in the 2019 exploration programs by GCM.
GCM has completed a considerable review of the geological interpretation of the El Silencio Mine with the identification of a number of additional small-scale structures defined in the latest model, including the updated interpretation of some tensional structures. The latest geological information has been supported by work completed by the mine and survey departments to define the different structures, which are currently actively being mined. The current El Silencio system confirms geological continuity along strike for 2.2 km respectively and indicates down-dip extents of more than 2.0 km, with thicknesses that are comparable to the Providencia vein, but there appears more geological complexity and as shown by the 2021 exploration programs the identification of small-scale structures and splays represent the exploration potential within the current mine beyond the two largest veins (Veta Manto [VEM] and Veta Nacional [NAL]), including veins 1040 and 1180 with important high-grade zones.
Although currently less well defined by sampling, the Las Verticales veins appear geologically continuous along strike for up to 1.3 km, and have an average thickness of 0.5 m, reaching over 2 m in areas of vein swelling. No work has been completed on the Las Verticales structures during 2021, so the Mineral Resources remains unchanged.
Gold mineralization at the Carla Project occurs in mesothermal quartz-sulfide veins hosted by granodiorites of the Segovia Batholith. The Carla vein dips at approximately 35° to the east and is offset by three broadly NW SE trending, steeply dipping faults, which reflect a dominantly strike-slip sinistral sense of movement. The mineralized structure shows a close spatial relationship with mafic dikes, which are interpreted as pre-dating the gold mineralization. The modelled structure at Carla is geologically continuous along strike for approximately 900 m and has a confirmed down dip extent that ranges from 400 m to greater than 750 m, and an average thickness of 0.8 m, reaching over 3.5 m in areas of significant swelling and less than 0.1 m where the vein pinches. Exploration in 2021 has mainly focused on underground channel sampling which resulted in higher-grades locally in a hangingwall vein.
| 1.3 | Status of Exploration, Development and Operations |
Drilling completed by GCM has been completed via a combination of holes collared at surface, intersecting the veins largely from the northeast and southwest orientations, and via underground drilling.
Prior to August 15, 2012 samples were sent for preparation to the SGS SA laboratories (SGS) facility in Medellin, Colombia and fire assays for gold were conducted by SGS in Peru. Since August 15, 2012 all sample preparation and fire assays have been completed at the upgraded SGS facility in Medellin.
Since 2015, GCM began completing infill drilling at Providencia using underground drill rigs, with the aim of infill drilling via fan drilling to approximately 20 m by 20 m spacing. Drilling is completed using industry standard underground rigs using NQ core diameter which is consistent with the surface drilling.
|
BP/KD |
May 2022 |
| SRK Consulting (U.S.), Inc. NI 43-101 Technical Report – Segovia 2021 PFS Update |
Page 3 |
During 2021, GCM exploration continued to add to the current database through a combination of drilling and data capture (digitization of historical maps) from other sources. All diamond core has been logged and sent for preparation to the SGS facility in Medellin.
The increase in the data base can be summarized as follows:
| • | In total (Segovia + Carla) there has been an increase in the diamond drilling database of 424 holes for 97,106 meters (m), compared to December 2020. A new vein has been added to the Mineral Resource at the historical Vera mine, which includes an additional 63 holes for 9,640 m, bringing the total drilling database to 2,553 holes for 378,846 m. This can be broken down between the various sources and projects as follows: |
| ○ | GCM exploration (GEX) with the Segovia license continued the routine infill underground drilling programs designed to confirm and increase the confidence in the grade distribution at the mines. The program consisted of 172 holes drilled for a total of 54,549 m |
| ○ | Additional to the exploration 160 holes for 29,787 m where added from the mining department (GEM) |
| ○ | 33 holes for 1,025 m were added from small scale department which have been assayed at SGS (GPE) |
| ○ | Based on the data capture of the historical holes 2 holes were removed from historical sources (FGM) |
| ○ | At Carla License a total of 20 holes for 3,895 m were added to the database. The provided database included a further 19 holes (3,725.2 m) from the LBA target and 10 holes (2,445.5 m) at the SAN target, but these have been excluded from the current estimates as they lie outside of the license boundary. |
In addition to the drilling there has been an increase in the underground channel sample database due to a combination of new channel sampling, and the data capture of historical samples at El Silencio and Sandra K mines.
In total there has been an increase of 7,368 channels for 10,716 m in length added to the database of new channels at the Segovia Project, with an additional 929 channels for 850 m of sampling at Carla, in the databases provided. A breakdown of the increase in the database per mine is as follows:
| • | Providencia: 2,073 channels for 1,634 m of sampling |
| • | El Silencio: 2,994 channels for 3,274 m of sampling |
| • | Sandra K: 2,293 channels for 7,201 m of sampling |
| • | Carla: 929 channels for 850 m of sampling |
| • | Vera: 4,680 channels for 3,432 m of sampling (including 4,588 channels for 3,326.4 m from historical FGM sources). |
At the underground mines (Providencia, Sandra K and El Silencio), channel samples have been taken at regular intervals vertically across the vein. The channel sample database represents the accumulation of grade control data for the underground mines for approximately the past 30 years.
All historical underground samples were sent to the Mine Laboratory for sample preparation and analysis. GCM has also completed a separate exploration channel sampling program, using a diamond saw to produce improved quality sampling. Between 2012 and 2016 exploration channel samples were sent to the SGS sample preparation in Medellin for analysis, which have been treated with the same
|
BP/KD |
May 2022 |
| SRK Consulting (U.S.), Inc. NI 43-101 Technical Report – Segovia 2021 PFS Update |
Page 4 |
sample procedures and analysis as diamond core samples. GCM commissioned an onsite laboratory in 2016 which is run by SGS and has been used for all mine channel sampling since to this date. All GCM diamond core has been logged and sent for preparation to the SGS (Colombia) facility in Medellín. SRK has visited the site on numerous occasions between 2017 to 2020, SRK completed a site inspection by Giovanny Ortiz in 2021 and 2022 who is a qualified person (QP) as defined by CIM.
SRK is satisfied with the quality of the laboratories used for the latest program and based on the quality control investigations considers that there is no evidence of bias within the current database which would materially impact the estimate. Based on the validation work completed by SRK, the database has been accepted as provided by GCM’s resource geologist.
| 1.4 | Mineral Processing and Metallurgical Testing |
GCM ore is processed through the Maria Dama process plant utilizing a process flowsheet that includes crushing, grinding, gravity concentration, gold flotation, concentrate regrinding, concentrate cyanidation, Merrill-Crowe zinc precipitation and refining of both the zinc precipitate and gravity concentrate to produce a final gold/silver doré product.
The Maria Dama process plant has been in production for many years and the metallurgical requirements for processing ore from the Providencia, El Silencio and Sandra K mines are well understood. GCM is now planning to mine and process ore from the Carla vein, which is part of the Segovia complex and has conducted metallurgical testwork at SGS Canada (SGS) on a single test composite that was formulated from selected drillholes and intervals from the Carla vein. The metallurgical program included rougher flotation followed by cyanidation of the reground rougher concentrate using process conditions currently practiced at GCM’s Maria Dama process plant. In addition, whole-ore cyanidation and Bond ball mill work index (BWI) tests were conducted. The results of this testwork demonstrated that the gold contained in ore from the Carla vein is highly recoverable using the process conditions currently in use at the Maria Dama process plant. Gold and silver recoveries were reported at about 95% and 77%, respectively. SRK has reduced the reported laboratory recoveries by 2% in order to account for inherent plant inefficiencies. As such, overall gold and silver recoveries from Carla ore are projected at 93% and 75%, respectively.
| 1.5 | Mineral Resource Estimate |
GCM provided to SRK an exploration database with flags of the main veins as interpreted by GCM. In addition to the database, GCM has also supplied a geological interpretation comprising preliminary 3D digital files (DXF) through the areas investigated by core drilling for each of the main veins.
At Providencia, El Silencio, Sandra K, Vera and Carla updated Mineral Resource Estimate (MRE) have been defined based on the revised database provided by GCM. The new databases increased a total of 475 additional diamond core boreholes (103,508 m) drilled by GCM. when the database is compared to the previous model (based on a comparison of collar files). The resource evaluation work was completed by Mr. Benjamin Parsons, MAusIMM (CP#222568) and Mr. Giovanny Ortiz (FAUSIMM #304612). The effective date of the Mineral Resource Statement is December 31, 2021, which is the last date assays, and the surveyed depletion outlines were provided to SRK.
GCM provided SRK with geological information in Seequent Leapfrog® Geo (Leapfrog®) with a preliminary geological model. Leapfrog® has been selected due to the ability to rapidly create accurate
|
BP/KD |
May 2022 |
| SRK Consulting (U.S.), Inc. NI 43-101 Technical Report – Segovia 2021 PFS Update |
Page 5 |
geological interpretations, that can interact with a series of geological conditions. The following process has been completed to complete the geological models:
| • | Review Importing Logs in Leapfrog for potential validation issues. |
| • | Compared GCM geological interpretation against provisional interpretations in polyline formats. |
| • | Review and adjustment of the fault model using the GCM polylines and underground sampling as a guideline. |
| • | Defined the timing and interaction of faults to generate fault blocks within which veins can be defined. The veins terminate at the contact with each fault (SRK previously reviewed the structural interpretation and model under a separate scope of work during 2019, which have been updated in 2020). |
| • | Creation of the veins based initially on lithological coding provided by GCM, then edited by SRK based on either grade or location validation issues. The final model has not been snapped to all intersections due to continuing validation of elevations remaining an issue to a degree. SRK compared the sample lengths to the model thickness on a visual basis and considers the correlation to be reasonable, with no material bias between the sampling and the vein thickness. |
| • | The initial geological model has been reviewed between SRK and GCM to confirm the current interpretation is representative of the underlying geological data, and knowledge of the veins from site personnel. |
SRK considers that the application of internal high-grade domains forms an important component to the different Segovia mines. SRK elected to exclude the southern fault block at Sandra K from the high-grade domaining and the Carla mine, as the sampling has been predominately from surface drilling and therefore the sample population is considered too low to assign limits with sufficient levels of confidence.
The grade estimation domains therefore comprise of the narrow vein zones interpreted by SRK/GCM geologists and discrete high-grade gold shoot domains. The presence and orientation of the high-grade shoots were validated during underground visits and with discussions with the mines geological team as part of on-going technical support provided by SRK for short and medium-term mine planning.
SRK has produced block models using Datamine™ Studio RM software (Datamine™). The procedure involved construction of wireframe models for the fault networks, veins, definition of resource domains (high-grade sub-domains), data conditioning (compositing and capping) for statistical analysis, geostatistical analysis, variography, block modeling and grade interpolation followed by validation. Grade estimation has been based on parent block dimensions of 5 m x 5 m x 5 m, for the updated models. The block size reflects that the majority of the estimates are supported via underground channel sampling and spacing ranging from 2 to 5 m. Sub-blocking has been utilized to enable accurate modelling of the tonnage with a minimum block size of 1 m x 1 m x Z dimensions, where the z dimension is flexible to fit the vertical width of the vein. Vein thickness in the block model has been based on defining an initial single block across the width of the vein during the block coding routines. Using this methodology sub-blocks 1 m by 1 m are filled within each vein, with accurate boundaries selected.
Datamine™ was used to domain assay data for statistical and geostatistical analysis, construct the block model, estimate metal grades and tabulate the resultant Mineral Resources. Phinar X10 Geo
|
BP/KD |
May 2022 |
| SRK Consulting (U.S.), Inc. NI 43-101 Technical Report – Segovia 2021 PFS Update |
Page 6 |
was used to conduct the capping analysis with Snowden Supervisor software used for geostatistical analysis, variography and statistical validation of the grade estimates. All samples have been capped and composited based on the statistical review with a default composite of 3 m, selected in an attempt to model a single composite across the width of the vein, given the varying widths of the veins. A minimum composite length of 0.2 m has been used.
SRK has not updated the Mineral Resource models for the Las Verticales areas as no new information is currently available and therefore the last estimate remains valid.
Gold grades have been interpolated using nested three pass approaches within Datamine™, using an Ordinary Kriging (OK) routine for the main veins. In the cases of Providencia, El Silencio and Sandra K, where minor veins or splays off the main structure exist, SRK has used Inverse Distance weighting squared (ID2). The search ellipses follow the typical orientation of the mineralized structures, and where appropriate, were aligned along higher-grade plunging features within the mineralized veins, namely within the visually evident high-grade shoots.
The classification is based on standards as defined by the Canadian Institute of Mining, Metallurgy and Petroleum (CIM) Definition Standards for Mineral Resources and Mineral Reserves, prepared by the CIM Standing Committee on Reserve Definitions and adopted by the CIM Council on May 14, 2014. The Mineral Resources at the Project have been classified as Measured, Indicated and Inferred at Providencia and Sandra K.
At El Silencio and Carla, only Indicated and Inferred Mineral Resources have been defined. SRK has limited the Indicated Mineral Resources to the lower portion of the mine (previously flooded), where the depletion limits are considered more accurate due to a lack of mining activity over prolonged periods of time by contractor mining.
In the historical Cogote mine, which was previously only included at depth from drillhole intercepts, GCM have completed a major data validation process of the historical veins. SRK considers the work completed to be sufficient for the declaration of Inferred Mineral Resources but has not assigned higher confidence levels until further work on verification sampling and confirmation of surveys has been completed.
SRK has defined the proportions of Mineral Resource to have potential for economic extraction for the Mineral Resource based on a single cut-off grade for all four mines. To determine the reasonable prospects for eventual economic extraction (RPEEE), SRK has used the following key assumptions for the costing, and a metallurgical recovery of 90.5% Au, has been assumed based on the current performance of the operating plant, and using a US$1,800/oz gold price and an average mining cost. There has been an increase in the gold price from US$1,700/oz to US$1,800/oz which represents an increase of approximately 5.8%, however SRK highlights that this has been offset to some extent by the assumptions used in the costs between 2019 and 2020 which had an increase of 6.2% (Table 1-1). SRK has taken the decision to use 2.9 g/t for the 2022 estimate to remain consistent with previous estimates.
|
BP/KD |
May 2022 |
| SRK Consulting (U.S.), Inc. NI 43-101 Technical Report – Segovia 2021 PFS Update |
Page 7 |
Table 1-1: Comparison of the Mineral Resource Cut-Off Grade Assumptions 2019 Versus 2020
| Cost | 2020 Cost | 2021 Cost | Unit | Variance | ||||||||||||
| Mine |
85 | 99.0 | USD/ton | 16.47% | ||||||||||||
| Plant |
24 | 26.0 | USD/ton | 8.33% | ||||||||||||
| G&A |
24 | 22.0 | USD/ton | -8.33% | ||||||||||||
| Royalties |
11.1 | 6.1 | USD/ton | -45.13% | ||||||||||||
| Total Cost |
144.1 | 153.1 | USD/ton | 6.24% | ||||||||||||
| Au Price |
1,700.00 | 1,800.00 | USD/oz | 5.88% | ||||||||||||
| 54.7 | 57.9 | USD/g | ||||||||||||||
| Au recovery |
90.5 | 90.5 | % | |||||||||||||
| COG |
2.9 | 2.9* | gpt | 1.18% | ||||||||||||
Sources: SRK, 2022
Notes:
| 1. | SRK rounded to 2.9 g/t for December 31 2021 Mineral Resource Reporting |
SRK has limited the Resource based on a cut-off grade of 2.9 g/t Au over a (minimum mining) width of 1.0 m. Based on on-going assistance with mine planning SRK considers this cut-off to remain appropriate.
The classified Mineral Resource is sub-divided into material within the remaining pillars (pillars), and the long-term resource material (LTR) outside of the previously mined areas, with the classification for the pillars considered separately given the uncertainty of the extent of remnant pillar mining currently being undertaken by Company-organized co-operative miners.
The Mineral Resource statement for the Project is shown in Table 1-2.
|
BP/KD |
May 2022 |
| SRK Consulting (U.S.), Inc. NI 43-101 Technical Report – Segovia 2021 PFS Update |
Page 8 |
Table 1-2: SRK Mineral Resource Statement for the Segovia and Carla Projects Dated December 31, 2021 – SRK Consulting (U.S.), Inc.
|
Project |
Deposit | Type | Measured | Indicated | Measured and Indicated | Inferred | ||||||||||||||||||||||||||||||||||||||||||||||
| Tonnes | Grade | Au Metal | Tonnes | Grade | Au Metal | Tonnes | Grade | Au Metal | Tonnes | Grade | Au Metal | |||||||||||||||||||||||||||||||||||||||||
| (kt) | (g/t) | (koz) | (kt) | (g/t) | (koz) | (kt) | (g/t) | (koz) | (kt) | (g/t) | (koz) | |||||||||||||||||||||||||||||||||||||||||
|
Segovia |
Providencia | LTR | 263 | 12.0 | 101 | 385 | 8.8 | 109 | 648 | 10.1 | 210 | 367 | 7.0 | 83 | ||||||||||||||||||||||||||||||||||||||
| Pillars | 156 | 17.5 | 88 | 88 | 9.3 | 26 | 232 | 14.4 | 114 | 458 | 17.6 | 259 | ||||||||||||||||||||||||||||||||||||||||
| Sandra K | LTR | 17 | 12.2 | 7 | 498 | 9.5 | 153 | 515 | 9.6 | 159 | 704 | 12.3 | 279 | |||||||||||||||||||||||||||||||||||||||
| Pillars | 27 | 14.7 | 13 | 188 | 10.4 | 63 | 214 | 10.9 | 75 | 67 | 26.8 | 58 | ||||||||||||||||||||||||||||||||||||||||
| El Silencio | LTR | 1,601 | 11.2 | 577 | 1,601 | 11.2 | 577 | 2,159 | 8.8 | 609 | ||||||||||||||||||||||||||||||||||||||||||
| Pillars | 1,228 | 11.4 | 449 | 1,228 | 11.4 | 449 | 341 | 12.1 | 133 | |||||||||||||||||||||||||||||||||||||||||||
| Verticales | LTR | 771 | 7.1 | 176 | ||||||||||||||||||||||||||||||||||||||||||||||||
| Subtotal Segovia Project | LTR | 280 | 12.0 | 108 | 2,484 | 10.5 | 839 | 2,764 | 10.7 | 947 | 4,001 | 8.9 | 1,146 | |||||||||||||||||||||||||||||||||||||||
| Pillars | 182 | 17.1 | 100 | 1,504 | 11.1 | 538 | 1,686 | 11.8 | 638 | 867 | 16.2 | 450 | ||||||||||||||||||||||||||||||||||||||||
|
Carla |
Subtotal Carla Project | LTR | 129 | 7.9 | 33 | 129 | 7.9 | 33 | 224 | 9.6 | 69 | |||||||||||||||||||||||||||||||||||||||||
|
Vera |
Subtotal Vera Project | LTR | 6 | 10.9 | 2 | 6 | 10.9 | 2 | 257 | 4.6 | 38 | |||||||||||||||||||||||||||||||||||||||||
Source: SRK, 2022
Notes: The Mineral Resources are reported at an in-situ cut-off grade of 2.9 g/t Au over a 1.0 m mining width, which has been derived using a gold price of US$1,800/oz, and suitable benchmarked technical and economic parameters for underground mining (mining = US$99.0, processing = US$26.0, G&A = US$22.0, Royalties = US$6.1), and conventional gold mineralized material processing (90.5%). Each of the mining areas have been sub-divided into Pillar areas (“Pillars”), which represent the areas within the current mining development, and LTR, which lies along strike or down dip of the current mining development. Mineral Resources are not Mineral Reserves and do not have demonstrated economic viability. All figures are rounded to reflect the relative accuracy of the estimate. All composites have been capped where appropriate.
|
BP/KD |
May 2022 |
| SRK Consulting (U.S.), Inc. NI 43-101 Technical Report – Segovia 2021 PFS Update |
Page 9 |
SRK considers the exploration data accumulated by GCM is generally reliable, and suitable for this MRE. SRK undertook a laboratory audit of the mine laboratory during previous site inspections and has previously visited the SGS sample preparation and fire assay facilities in Medellin and found it to be clean, organized, with the correct equipment and procedures in place to ensure quality is maintained.
Infill drilling along with the on-going validation work of the historical database, and surveying of the underground mine work has resulted in an increase in the Mineral Resources at Segovia. It is SRK’s opinion that improvements have been made from previous models but that further improvements can still be made to the geological database (namely elevations).
There are zones in all three mines where the vein coding requires detailed review to improve the geological interpretation. SRK has highlighted any obvious misclassification of vein coding in the databases using a coding SRK_XXX_xyz, which GCM needs to review as a priority. Correction of the vein coding will enable an improved geological model which can aid exploration planning and identifying possible areas where parallel veins exist, which would provide additional feed material within the existing infrastructure. One recommendation is that the mine geology team of Segovia should have more involvement in the geological model construction and correction of issues, including the unification of the vein names and codes used for new zones.
At El Silencio the geological team has advanced the current geological interpretation to account for a number of splays or sub-parallel structures. In 2021, further work has been completed to integrate local mine geology and mine planning into the current estimates on a number of smaller high-grade structures. These areas have resulted in a significant growth in the Mineral Resource (namely v1040) and show the potential to add further Resources within continued work within the deposit.
Additional validation work on the historical datasets at Sandra K within the PAT and JUL veins in the Cogote area of the mine, have resulted in a significant increase in the Mineral Resources. The Exploration team of GCM completed the verification of the historic information (historical reports, paper maps, etc.), including the validation of information and digitizing of the UG working and sampling data. The database was generated for the Vera project which included the transformation of the information to the current coordinate system and the units of length and weight to the metric system. SRK currently considers the current levels of confidence within these areas to only be sufficient to define Inferred Mineral Resources.
| • | Further to this in relation to the required improvements to data quality, SRK recommends the following: |
| • | Creation of a 3D interpretation of all mining development and stoped areas will help guide exploration |
| • | Continued infill drilling using underground drill-rigs ahead of the planned mining faces to a minimum of 20 m by 20 m pattern |
SRK recommends that GCM look towards the use of localized short-term planning models to improve the understanding of the short scale variation in grade and improve the potential to monitor the current estimates. These short-term models should include results from the infill underground drilling areas and adjustments to the high-grade domain boundaries. The mine geology team of GCM has recently generated some short-term models for some veins and locations. This should be implemented for all the mines including the design and apply a reconciliation protocol.
|
BP/KD |
May 2022 |
| SRK Consulting (U.S.), Inc. NI 43-101 Technical Report – Segovia 2021 PFS Update |
Page 10 |
SRK has reviewed the current exploration potential at Segovia which can be summarized as follows:
| • | Continuation of drilling at depth targeting high-grade shoots within VEM and NAL veins, drilling during 2020 indicates there are potentially two shoots with a portion of lower grades in between, these will require additional drilling where possible from the current fan drilling, or via a new parent hole. |
| • | At Providencia there is potential shown on the eastern fault block which represents an uplift in the location of the vein due to faulting. Initial drilling has encouraging results in an area where the vein has previously been considered to feather out into more discontinuous structures. |
| • | Brownfields exploration in the proximity to Providencia exists within the Cristales, San Nicolas veins to the north of the El Silencio and Sandra K mines respectively, and the Mamajito vein which exists in the hangingwall to the current Providencia mine. These veins has been historically mined and represent further opportunity to increase the Mineral Resource basis in the future similar to the Vera additions in 2021. |
| • | At Sandra K the potential areas to increase the current Mineral Reserves and potentially add additional material to future mine plans. include: |
| ○ | Further verification channel samplings and drilling down-drip of the historical PAT and JUL veins. These veins are known to extend to depth based on the 2019 drilling programs and 2020 – 2021 validation work. The results of the 2021 work indicate these veins have higher than the average grades at Sandra K. If the dip extension of the existing mines is targeted this could provide additional Mineral Resources. |
| ○ | Data capture continued on the Vera [VER] vein to the south east of the current Sandra K. SRK recommends continuing the surveying of mined areas, which to date have been sterilized by SRK, and further verification of the underground channel sampling by twin sampling and continue the diamond drilling down-dip of known mineralization. |
The total budget for these programs is approximately US$13 million, to complete a total of approximately 65,000 m of drilling in 2022. SRK considers this action to be reasonable but will review the current planned program for further detail.
| 1.6 | Mineral Reserve Estimate |
Mineral Reserves stated here for the Segovia operations include four distinct areas named Providencia, El Silencio, Sandra K, and Carla. There are other mines in the vicinity, owned by GCM, however there are no Indicated resources stated outside of these four areas at this time. There are also other mines in the vicinity owned by others. The general dip of the orebodies in all four areas is 30° to 40°. The veins are narrow and range from several centimeters (cm) to over 1 m. All four areas are currently being mined.
The mines are currently accessed using an apique hoisting system which approximately follows the dip of the orebody. The mining method currently in use is predominantly a room and pillar method, although some areas of Providencia are mined using cut and fill methods. In the cut and fill areas, ramps are developed in waste and an attack ramp system is used to access various levels of the orebody. In room and pillar areas, access is via on-ore openings/apiques.
A 3D design has been created representing the planned reserve mining areas. The underground mine design process resulted in underground mining reserves of 2.3 million tonnes (Mt) with an average grade of 10.11 g/t gold (Au) diluted. The Mineral Reserve statement, as of December 31, 2021, for
|
BP/KD |
May 2022 |
| SRK Consulting (U.S.), Inc. NI 43-101 Technical Report – Segovia 2021 PFS Update |
Page 11 |
GCM Segovia is presented in Table 1-3. Mineral Reserves were classified using the 2014 CIM Definition standards.
Table 1-3: GCM Segovia Mineral Reserves Estimate as of December 31, 2021
| Segovia Mineral Reserves | Cut-off (1):3.20 - 3.51 g/t | |||||||||||||||
| Category | Area | Tonnes | Au Grade (g/t) | Oz (in situ) | ||||||||||||
| Providencia | 203,738 | 12.00 | 78,587 | |||||||||||||
| Carla | - | - | - | |||||||||||||
| Proven |
Sandra K | - | - | - | ||||||||||||
| El Silencio | - | - | - | |||||||||||||
| Subtotal Proven |
203,738 | 12.00 | 78,587 | |||||||||||||
| Providencia | 154,644 | 9.92 | 49,339 | |||||||||||||
| Probable |
Carla | 72,193 | 9.55 | 22,157 | ||||||||||||
| Sandra K | 399,036 | 8.01 | 102,754 | |||||||||||||
| El Silencio | 1,460,863 | 10.47 | 491,823 | |||||||||||||
| Subtotal Probable |
2,086,736 | 9.93 | 666,073 | |||||||||||||
| Total |
Proven + Probable | 2,290,474 | 10.11 | 744,661 | ||||||||||||
Source: SRK, 2022
Notes:
| • | Ore reserves are reported using a gold cut-off grade (CoG) ranging from 3.20 to 3.51 g/t depending on mining area and mining method. The CoG calculation assumes a $1,650/oz Au price, 90.5% metallurgical recovery, $6/oz smelting and refining charges, 3.5% royalty, $21.72/t G&A costs, $26.06/t processing cost, and mining costs ranging from $99.70 to $114.05/t. Note that costs/prices used here may be somewhat different than those in the final economic model. This is due to the need to make assumptions early on for mine planning prior to finalizing other items and using long term forecasts for the life of mine plan. |
| • | Mining dilution is applied to a minimum mining height and to estimate overbreak (values differ by area/mining method) using a zero grade. |
| • | All figures are rounded to reflect the relative accuracy of the estimates. Totals may not sum due to rounding. Mineral Reserves have been stated on the basis of a mine design, mine plan, and economic model. Mineral Resources are reported inclusive of the Mineral Reserve. |
| • | There are potential survey unknowns in some of the mining areas and lower extractions have been used to account for these unknowns. |
| • | The Mineral Reserves were estimated by Fernando Rodrigues, BS Mining, MBA, MMSAQP #01405, MAusIMM #304726 of SRK, a Qualified Person. |
| 1.7 | Mining Methods |
| 1.7.1 | Geotechnical |
SRK reviewed and validated the geotechnical data collected by the Segovia Geotechnical team and all laboratory tests conducted since 2017. Based on current mine stability performance, data quality and quantity, SRK considers that the geotechnical field investigation and data collected is consistent with international standards for a PFS mining project level. More investigations, such as stress induced measurements and additional laboratory tests need to be incorporated into the PFS geotechnical model to move forward to a feasibility study (FS).
SRK considers that pillar recoveries proposed in the mining plan are achievable. Pillar recovery is a complex operation in underground mining and can place workers at risk if not performed correctly. The appropriate ground support needs to be implemented as described in this report. The implementation is a key component in the mine plan success. Although the Segovia geotechnical team has demonstrated good pillar recovery practices, it is important to continue reviewing and updating the existing short term mine plan.
Figure 1-1 shows planned production by area.
|
BP/KD |
May 2022 |
| SRK Consulting (U.S.), Inc. NI 43-101 Technical Report – Segovia 2021 PFS Update |
Page 12 |
| 1.7.2 | Groundwater |
The mining areas are in the hydrogeological regional area of Magdalena Cauca. Most of this region is comprised of igneous and metamorphic rocks with limited groundwater storage capacity and hydraulic conductivity. The fractured rocks within the Antioquia Department may host local aquifers (IDEAM, 2013). Saprolite and bedrock are the two major hydrogeological units in the mine area. The saprolite is a low conductivity unit draped on the top of the bedrock as a surficial layer and has a thickness from 5 to 45 m. The bedrock is formed primarily by the Segovia Batholith and dikes, covering almost all of the mine levels. Because the mines have been in operation for a significant amount of time, with the exception of Carla mine, it is likely that a large cone of drawdown exists around each of the mines, and the combined drawdown seems to dominate the mining district. There is a high density of fractures and cracks in this unit, an assumed consequence of the long-term mine activity. The presence of deep aquifers cannot be ignored due to the lack of piezometric and hydrological field data.
| 1.7.3 | Dewatering System |
Dewatering systems are in operation at the Sandra K, Providencia and El Silencio mines, recording an average pumping rate of 464, 1,068 and 1,007 gallons per minute (gpm) respectively during 2016 and 2017 and an average of 526, 1,342 and 930 gpm respectively during 2018. There are not yet completed records for 2019 and 2020, however, the measured dewatering rates are consistent with the historical data. Currently, general dewatering rates reported by GCM are 3,000 gpm in Providencia mine, 1,085 gpm in El Silencio mine, and 700 gpm in Sandra K. Carla mine has a pumping capacity of 250 gpm; however, no information on current dewatering rates have been provided. The dewatering system fits the needs for the current operations in each mine. More details are needed to evaluate the system’s response to in rush flow events. Future mine plans are up to 111 m deeper than the current mining levels, and this will increase the groundwater inflow into the mine as well as the lift head. The mine dewatering system will need to accommodate future development. The design should consider potential inrush flow from deep aquifers, and/or high-pressure water in the fracture/fault systems. Such a design will need to be based on drilling and hydraulic testing to estimate static heads and the potential for large inrush events from faults or fracture sets.
| 1.7.4 | Mine Design |
To determine minable areas, the grades in the block models were diluted to include a minimum mining height and expected overbreak dilution. The diluted grades above cut-off, based on mining method, were then displayed on the screen and polygons were drawn around minable panel areas. This was done for each individual vein (as some veins are stacked on top of each other).
Once mining areas were identified, the geologic vein triangulations were cut to the polygons giving a 3D shape showing the mining area (without dilution). Tonnages and grades for each of the shapes was then reported based on the diluted tonnages and grades in the block model.
Existing apique systems are used/extended in most areas, with new apique systems added as necessary. New raises to surface are also included for ventilation and egress where necessary. The production and development schedules were completed using Vulcan Gantt software. Source: SRK, 2022
Figure 1-1 shows planned production by area.
|
BP/KD |
May 2022 |
| SRK Consulting (U.S.), Inc. NI 43-101 Technical Report – Segovia 2021 PFS Update |
Page 13 |
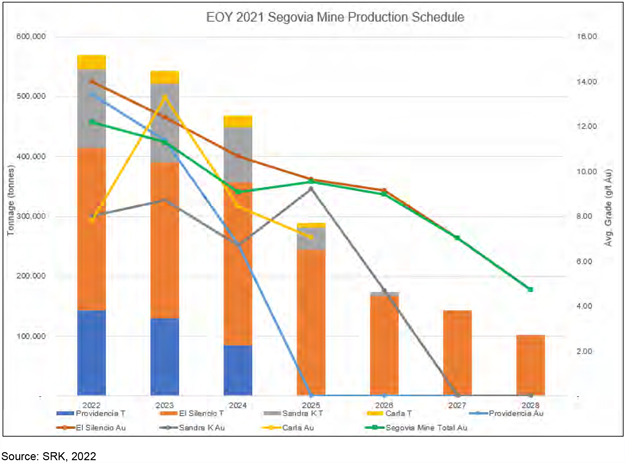
Figure 1-1: Segovia Mine Production by Area
The mines utilize jacklegs for a large part of the underground mining. Where possible, jumbos are used for cut and fill areas and for all development. The existing diesel operated mobile equipment includes jumbos, trucks, and load haul dumps (LHD) along with support equipment. GCM has a large number of track and air powered overshot muckers and jackleg style drills that are used for general production as well as air and electric slushers. The El Silencio mine has a mechanical workshop for diesel repairs on Level 19. At Providencia there is a diesel shop on level 12. In addition, all mines have underground workshops to repair jacklegs.
| 1.8 | Recovery Methods |
GCM processes ore from the Providencia, El Silencio, Sandra K and Carla mines at its 1,500 t/d Maria Dama process plant which includes crushing, grinding, gravity concentration, gold flotation, cyanidation of the flotation concentrate, Merrill-Crowe zinc precipitation and refining of both the zinc precipitate and gravity concentrate to produce a final gold/silver doré product. GCM is currently expanding the capacity of the Maria Dama process plant to 2,000 t/d. SRK makes the following conclusions regarding GCM’s processing facilities:
| • | Plant production for the period 2019 - 2021 increased from 451,450 t of ore at an average gold grade of 15.48 g/t Au in 2019 to 556,219 t at an average gold grade of 12.21 g/t Au during 2021. |
|
BP/KD |
May 2022 |
| SRK Consulting (U.S.), Inc. NI 43-101 Technical Report – Segovia 2021 PFS Update |
Page 14 |
| • | Overall gold recovery has been consistent and has ranged from 94.7 to 95.6% over the period 2019 - 2021. |
| • | During the period 2019 - 2021 annual gold production ranged from 196,329 to 214,036 oz. |
| • | Silver recovery is not monitored but is a relatively minor contributor to overall project economics. |
| • | Process plant cash operating costs were reported at US$25.34/t during 2020 and US$25.30/t during 2021. |
| 1.9 | Project Infrastructure |
The infrastructure for Segovia is installed and fully functional. Additional work is ongoing to improve the power system and underground mine infrastructure. All major facilities are in place and have been in use for a number of years.
| 1.9.1 | Tailings Management Area |
The El Chocho tailings storage facility (TSF) has been designed as a dry stack TSF for filtered tailings. The average tailings production rate is currently around 1,500 tonnes per day (t/d) with a maximum production rate of 1,800 t/d. The total estimated volume of current tailings storage at 0.7 Mt and future storage of 2.3 Mt to meet the life-of-mine (LoM) requirements.
The current operation consists of two plate and frame filter presses and three dehydration cells capable of treating the full tailings load of 1,800 t/d of dry solids. The original emergency pond used to store tailings when the filter plant is down for maintenance has been backfilled with filtered tailings. A second filter press was installed in the third quarter of 2021 to increase production and limit down time for maintenance, if required the mine uses geotubes to filter the tailings solids during filter press down times.
The current TSF consists of existing Phases 1B, 1A and 1C. Future Phase 2A is currently under construction downstream of Phase 1C. Phase 1B was the first tailings storage area built and was designed to accept slurry tailings. It was constructed as an earth fill embankment with a clay core and upstream chimney drain to prevent the development of excess pore water pressures in the embankment. The upper portion of Phase 1B finished the final stages of reclamation in 2020 and was converted into a recreational field for the community. The lower portion of Phase 1B has an internal rockfill berm dividing the storage area which previously acted as a filter to decant water to the current operating pool used to recirculate water to and from the filter press. The operating pool is still being used as an operating pool for the filter presses, but the tailings storage area is currently being reclaimed.
Phase 1A was designed as interim containment measure while Phase 1C was being constructed. The Phase 1A Geotube embankment was designed by Maccafferi and was constructed by stacking Geotubes filled with tailings slurry to form an embankment approximately 15 m high. The Geotube embankment was buttressed in 2021 by placing a combination of compacted tailings and Geotubes at the toe of the embankment in Phase 1C, creating an essentially level surface between Phase 1C and 1A.
Phase 1C and future Phase 2A were designed by Wood. Phase 1C was constructed as a 15 m high rockfill starter embankment with a 0.5 m clay liner, stormwater diversion channels, underdrains and contact water collection pond. The starter embankment is constructed downstream of the existing
|
BP/KD |
May 2022 |
| SRK Consulting (U.S.), Inc. NI 43-101 Technical Report – Segovia 2021 PFS Update |
Page 15 |
backfilled Phase 1A Geotube embankment. Phase 2A is currently being constructed. The embankment will be constructed downstream of Phase 1C and is designed with a 12 m high starter embankment with the same design elements as Phase 1C.
Filtered tailings are transported from the filter presses by haul trucks and spread with a tracked dozer and compacted with a vibratory smooth drum compactor to a specified lift thickness and minimum relative density. The outer 40 m of each tailings lift is compacted to a higher relative density to reduce erosion and improve stability of the placed tailings.
| 1.10 | Environmental Studies and Permitting |
PMA Approval: The site Environmental Management Plan (“Plan de Manejo Ambiental” or PMA) was accepted by the Regional Environmental Authority (Corantioquia) on February 22, 2019; however, GCM appealed several of the terms and conditions of the resolution, which led to the issuance of Resolution 160ZF-RES1911-6813 on November 25, 2019, accepting several of the arguments and approving the final PMA. Throughout the application and multiple renewal processes, a number of environmental studies have been completed to satisfy Corantioquia, some of which are detailed in Section 20 of this report.
Changes to Groundwater Regime: The previous PMA application (2012; unapproved) highlighted a lack of information regarding the groundwater regime in the operating mines and suggested that changes to the groundwater levels through dewatering activities of the mines may lead to geotechnical instabilities and increase the potential for subsidence from the underground workings. This is considered to be a significant risk to the Project, given the location of residential buildings at Segovia above the workings. The recently approved PMA (2019) includes requirements to complete a conceptual hydrogeological model and a numerical model of the mining area to predict and manage changes to the hydrogeological setting. GCM initiated the hydrogeological investigation in 2019, but data collection was ultimately delayed due to the COVID-19 pandemic. The requisite numerical modeling effort will commence upon completion of the data collection activities. Preliminary results from the conceptual hydrogeological model are discussed elsewhere in this report.
Health and Safety of Contract Miners: GCM employs groups of contract miners to extract high grade run-of-mine (RoM) mill feed from the operating mines. Although each mining group is required to meet contractual health, safety and environmental standards set by GCM, historically there has not been sufficient auditing of compliance with these standards. Significant health and safety risks may be associated with uncontrolled (uncontracted and unauthorized) mining of support pillars (outside of the direct control of the company), which may potentially lead to ground collapse and loss of life.
The company has a group of experts in Industrial Safety that audits and verifies compliance with the action plans. The audits evaluate the legal compliance in industrial safety and the implementation of an industrial safety management system. The inspections of the company’s industrial safety experts focus on:
| • | Ventilation |
| • | Rock support |
| • | Access to the mine |
| • | Legal compliance |
|
BP/KD |
May 2022 |
| SRK Consulting (U.S.), Inc. NI 43-101 Technical Report – Segovia 2021 PFS Update |
Page 16 |
El Chocho Tailings Storage Facility Area: The El Chocho TSF is fully permitted and operational. The flotation tailings are pumped directly to the El Chocho tailings complex for filtration and placement or deposition into Geotubes for tailings management during filter maintenance. A smaller secondary stream of cyanide tailings is first detoxified using H2O2 and FeSO4, then pumped to either the Báscula or one of the three Bolivia settling ponds. Only Bolivia 3, constructed in 2020, was used in 2021. These are geomembrane-lined basins currently being used to store detoxified cyanide tailings; decant water from these ponds is pumped back to the Maria Dama plant for use in the process circuit. The detoxified and dewatered tailings from the settling ponds is treated through a polymetallic plant (a.k.a., cleaning plant) to remove higher levels of lead and zinc before being transferred to the El Chocho TSF. The ‘cleaning plant’ commenced operations during Q3 2021 and has the capacity to treat 120 t/d of detoxified cyanide tailings from the Maria Dama production line + 80 tons/day of stored tailings from the settling ponds.
| 1.10.1 | Geochemistry |
Geochemical testing indicates that ore and tailings produce ARDML (acid rock drainage and metal leaching). The current filter press tailings test acid-neutralizing, but cyanide destructed tailings produce ARDML. The limited static and kinetic testing conducted on underground mine rock are inconclusive with regards to the ARDML properties of country rock that surrounds veins, and additional work is needed. Water quality data for groundwater discharges in the underground mine workings show isolated occurrences of acidic water with elevated metals. The rock and water quality data sets demonstrate the potential for generation of ARDML, but the data are limited and exemplify the need for expanding the data collection program to improve the state of geochemical characterization.
| 1.10.2 | Closure Water Treatment |
Closure scenarios may involve some form of water collection and water treatment. It is assumed that the Sandra K and Providencia mines will fill with water and outflow, requiring treatment for approximately five years before stabilizing. Thus, detailed geochemical characterization is needed to understand the potential more accurately for mining wastes to generate poor quality contact water that might persist into closure and post closure. SRK (2014) observed that the largest uncertainty regarding closure costs is the potential need for long-term water treatment from the mine workings after closure. A requirement for long-term post-closure water treatment would add significant cost to the closure estimates presented in this report.
| 1.11 | Capital and Operating Costs |
The Segovia Project is a currently operating underground mine, the estimate of capital includes only sustaining capital to maintain the equipment and all supporting infrastructure necessary to continue operations until the end of the projected production schedule.
The capital cost estimates developed for this study include the costs associated with engineering, procurement, acquisition, construction, and commissioning. The cost estimate is based on budgetary estimates prepared by Segovia and reviewed by SRK. All estimates are prepared from first principles based on site specific recent actuals. The budget and estimates indicate that the Project requires sustaining capital of US$151.5 million (M) throughout the LoM based on the current production schedule/reserves. Table 1-4 summarizes the sustaining capital estimate.
|
BP/KD |
May 2022 |
| SRK Consulting (U.S.), Inc. NI 43-101 Technical Report – Segovia 2021 PFS Update |
Page 17 |
Table 1-4: Segovia Sustaining Capital Cost Estimate Summary
| Description | LoM (US$000s) | |||||
| Development | 35,833 | |||||
| Exploration | 24,324 | |||||
| Providencia Mine | 6,895 | |||||
| El Silencio Mine | 22,090 | |||||
| Sandra K | 7,356 | |||||
| Carla | 4,647 | |||||
| Mine Engineering Costs | 1,917 | |||||
| Geology Exploration Drilling | 2,853 | |||||
| Small Mining | 84 | |||||
| Mill | 3,978 | |||||
| Laboratory | 969 | |||||
| Maintenance | 1,314 | |||||
| Civils | 134 | |||||
| Logistics & Weighing | 166 | |||||
| Environment | 17,866 | |||||
| O&H | 2,353 | |||||
| Administration | 1,475 | |||||
| IT | 1,916 | |||||
| Security | 1,334 | |||||
| Finance | 0 | |||||
| Mine Closure | 10,852 | |||||
| TSF Closure | 3,098 | |||||
| Carry Over (2021 Projects) | 0 | |||||
| Total Capital | $151,453 | |||||
Sources: GCM, 2022
The operating cost is based on budgetary estimates from GCM, reviewed by SRK, and were modeled as entirely variable costs.
SRK and GCM prepared the estimate of operating costs for the reserves production schedule. These costs were subdivided into the following operating expenditure categories:
| • | Mining |
| • | Processing |
| • | Site G&A |
The resulting LoM cost estimate is presented in Table 1-5.
Table 1-5: Segovia Operating Costs Summary
| Description | LoM (US$000s) | LoM (US$/t-Ore) | LoM (US$/oz-Au) | |||||||||||
|
Mining |
365,010 | 159.36 | 541.62 | |||||||||||
|
Process |
76,489 | 33.39 | 113.50 | |||||||||||
|
G&A |
57,917 | 25.29 | 85.94 | |||||||||||
|
Total Operating |
$499,416 | $218.04 | $741.06 | |||||||||||
Source: GCM, 2022
The costs presented above include costs associated with both an owner mining operations and third-party operations that take place within the Mineral Reserve areas.
The estimated cash cost, including direct and indirect production costs, is US$807/Au-oz, while All-in Sustaining Costs (AISC), including sustaining capital, is US$1,032/Au-oz. Table 1-6 presents the make-up of the Segovia cash costs.
|
BP/KD |
May 2022 |
| SRK Consulting (U.S.), Inc. NI 43-101 Technical Report – Segovia 2021 PFS Update |
Page 18 |
Table 1-6: Segovia Cash Costs 1
| Cash Costs | $000’s | |||||
| Direct Cash Cost |
|
|||||
| Mining Cost | 365,010 | |||||
| Process Cost | 76,489 | |||||
| Site G&A Cost | 57,917 | |||||
| Smelting & Refining Charges | 5,560 | |||||
| C1 Direct Cash Costs | 504,975 | |||||
| $/t-ore | 220.47 | |||||
| $/Au-oz | 749.31 | |||||
| Indirect Cash Cost | ||||||
| Royalties | 39,141 | |||||
| Indirect Cash Costs | 39,141 | |||||
| $/t-ore | 17.09 | |||||
| $/Au-oz | 58.08 | |||||
| Total Direct + Indirects Cash Costs | 544,117 | |||||
| $/t-ore | 237.56 | |||||
| $/Au-oz | 807.39 | |||||
| Sustaining Capital Cash Cost (US$/Au-oz) | 224.74 | |||||
| All-In Sustaining Costs (US$/Au-oz) | 1,032.13 | |||||
Source: SRK, 2022
Notes:
| 1. | SRK’s standard cash cost reporting methodology for NI 43-101 reports includes smelting/refining costs; whereas GCM’ basis of reporting treats these costs as a reduction of realized gold price (the refinery discounts the selling price by a factor to cover these charges) and excludes them from its reported “total cash cost per ounce”. |
Figure 1-2 presents the breakdown of the estimated all-in sustaining cash costs associated with the Mineral Reserves. Direct cash costs are the clear majority of the AISC cash cost, while the sustaining capital is a distant second.
|
BP/KD |
May 2022 |
| SRK Consulting (U.S.), Inc. NI 43-101 Technical Report – Segovia 2021 PFS Update |
Page 19 |
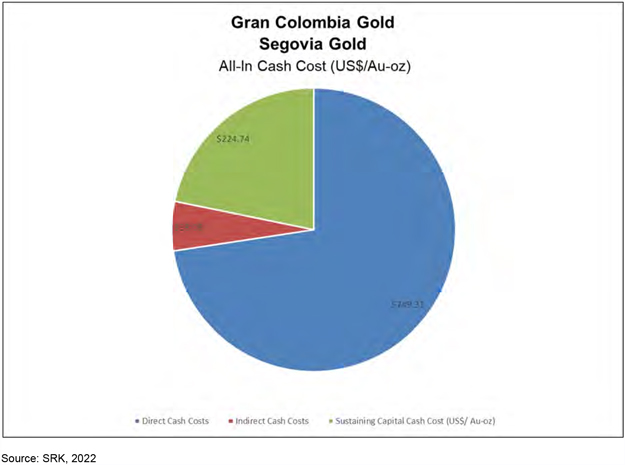
Figure 1-2: All-in Sustaining Cash Cost Breakdown
Figure 1-3 presents the breakdown of the estimated direct cash costs associated with the reserves. Mining costs represent the clear majority of the direct costs, followed by processing and general and administrative costs.
|
BP/KD |
May 2022 |
| SRK Consulting (U.S.), Inc. NI 43-101 Technical Report – Segovia 2021 PFS Update |
Page 20 |
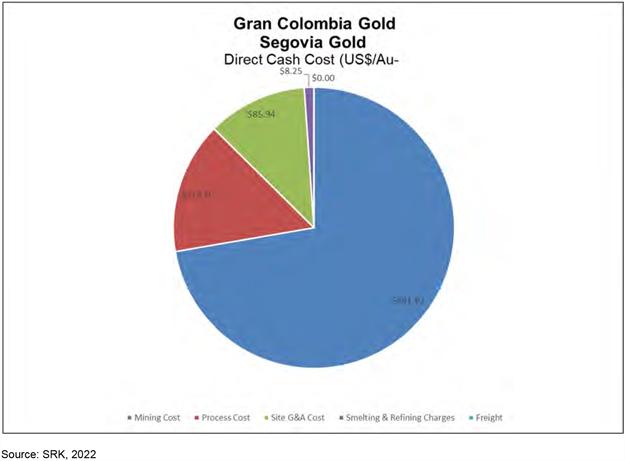
Figure 1-3: Direct Cash Costs
| 1.12 | Economic Analysis |
The valuation results of the Segovia Project indicate that the Project has an after-tax Net Present Value (NPV) of approximately US$241.6 M, based on a 5% discount rate. The operation is cash flow positive except in the last two years and this is related to closure cost. Revenue generation steadily decreases year over year due to a decline of the gold grade. The annual free cash flow profile of the Project is presented in Figure 1-4. The full annual TEM is located in Appendix E.
|
BP/KD |
May 2022 |
| SRK Consulting (U.S.), Inc. NI 43-101 Technical Report – Segovia 2021 PFS Update |
Page 21 |
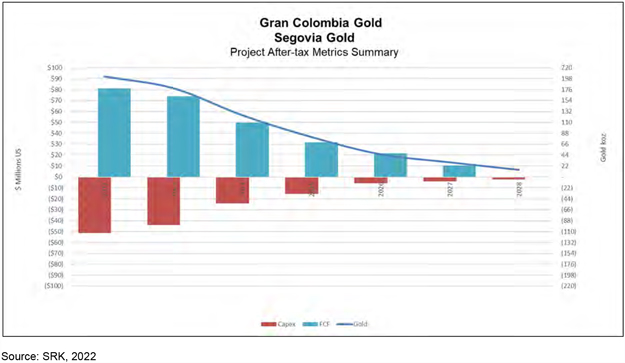
Figure 1-4: Segovia After-Tax Free Cash Flow, Capital and Metal Production
Indicative economic results are presented in Table 1-7. The Project is a gold operation, with gold representing 100% of the total projected revenue. The underground mining cost is the heaviest burden on the operation, followed by the sustaining capital as a distant second.
|
BP/KD |
May 2022 |
| SRK Consulting (U.S.), Inc. NI 43-101 Technical Report – Segovia 2021 PFS Update |
Page 22 |
Table 1-7: Segovia Indicative Economic Results
| Description | Value | Units | ||||||||
| Market Prices | ||||||||||
| Gold (US$/oz) |
1,650 | US$/oz | ||||||||
| Estimate of Cash Flow (all values in $000s) | ||||||||||
| Concentrate Net Return | ||||||||||
| Gold Sales |
$1,111,966 | $000s | ||||||||
| Silver Sales |
$0 | $000s | ||||||||
| Total Revenue | $1,111,966 | $000s | ||||||||
| Smelting and Refining Charges |
($5,560) | $000s | ||||||||
| Freight & Impurities |
$0 | $000s | ||||||||
| Net Smelter Return | $1,106,406 | $000s | ||||||||
| Royalties |
($39,141) | $000s | ||||||||
| Net Revenue | $1,067,265 | $000s | ||||||||
| Operating Costs | ||||||||||
| Underground Mining |
($365,010) | $000s | ||||||||
| Process |
($76,489) | $000s | ||||||||
| G&A |
($57,917) | $000s | ||||||||
| Total Operating | ($499,416) | $000s | ||||||||
| Operating Margin (EBITDA) | $567,850 | $000s | ||||||||
| Initial Capital |
$0 | $000s | ||||||||
| LoM Sustaining Capital |
($151,453) | $000s | ||||||||
| Working Capital |
$3,770 | $000s | ||||||||
| Income Tax |
($156,149) | $000s | ||||||||
| After Tax Free Cash Flow | $264,017 | $000s | ||||||||
| NPV @: 5% | $241,584 | $000s | ||||||||
Source: SRK, 2022
Silver was not included in the analysis, as it is not included in the resources nor the reserves. It should be noted, however, that past production indicates the production of silver in the doré and its revenue could represent an addition of about 1% to 2% to the revenue presented above.
Table 1-8 shows annual production and revenue forecasts for the life of the Project. All production forecasts, material grades, plant recoveries and other productivity measures were developed by SRK and GCM.
Table 1-8: Segovia LoM Annual Production and Revenues
| Period | RoM (kt) | Plant Feed (kt) | Doré (koz) | |
Free Cash Flow (US$000s) |
|
|
Discounted Cash Flow (US$000s) |
| |||||||||||||
| 2022 | 569.65 | 569.65 | 202.41 | 81,149 | 79,193 | |||||||||||||||||
| 2023 | 543.34 | 543.34 | 178.54 | 74,388 | 69,351 | |||||||||||||||||
| 2024 | 468.60 | 468.60 | 123.97 | 50,108 | 44,581 | |||||||||||||||||
| 2025 | 288.99 | 288.99 | 80.13 | 31,805 | 26,894 | |||||||||||||||||
| 2026 | 174.13 | 174.13 | 45.47 | 20,722 | 16,680 | |||||||||||||||||
| 2027 | 143.36 | 143.36 | 29.29 | 10,455 | 8,064 | |||||||||||||||||
| 2028 | 102.40 | 102.40 | 14.11 | 464 | 331 | |||||||||||||||||
| 2029 | 0.00 | 0.00 | 0.00 | (4,827) | (3,355) | |||||||||||||||||
| 2030 | 0.00 | 0.00 | 0.00 | (235) | (156) | |||||||||||||||||
| Total | 2,290.47 | 2,290.47 | 673.92 | $264,030 | $241,584 | |||||||||||||||||
Source: SRK, 2022
The Mineral Reserves disclosed herein are sufficient to feed the Maria Dama plant for approximately 6.75 years of operation.
|
BP/KD |
May 2022 |
| SRK Consulting (U.S.), Inc. NI 43-101 Technical Report – Segovia 2021 PFS Update |
Page 23 |
| 2 | Introduction |
| 2.1 | Terms of Reference and Purpose of the Report |
This report was prepared as a prefeasibility-level Canadian National Instrument 43-101 (NI 43-101) Technical Report (Technical Report) for GCM Mining Corp. (GCM), by SRK Consulting (U.S.), Inc. (SRK) on the Segovia Project, which is comprised of the Providencia, El Silencio, and Sandra K mines, and the Vera and Carla Projects.
The quality of information, conclusions, and estimates contained herein are consistent with the level of effort involved in SRK’s services, based on: i) information available at the time of preparation, ii) data supplied by outside sources, and iii) the assumptions, conditions, and qualifications set forth in this report. This report is intended for use by GCM subject to the terms and conditions of its contract with SRK and relevant securities legislation. The contract permits GCM to file this report as a Technical Report with Canadian securities regulatory authorities pursuant to NI 43-101, Standards of Disclosure for Mineral Projects. Except for the purposes legislated under provincial securities law, any other uses of this report by any third-party is at that party’s sole risk. The responsibility for this disclosure remains with GCM. The user of this document should ensure that this is the most recent Technical Report for the property as it is not valid if a new Technical Report has been issued.
This report provides Mineral Resource and Mineral Reserve estimates, as well as a classification of resources and reserves prepared in accordance with the Canadian Institute of Mining, Metallurgy and Petroleum Standards on Mineral Resources and Reserves: Definitions and Guidelines, May 10, 2014 (CIM, 2014). Mineral Resources are reported inclusive of the Mineral Reserves.
| 2.2 | Qualifications of Consultants |
The Consultants preparing this technical report are specialists in the fields of geology, exploration, Mineral Resource and Mineral Reserve estimation and classification, underground mining, geotechnical, environmental, permitting, metallurgical testing, mineral processing, processing design, capital and operating cost estimation, and mineral economics.
None of the Consultants or any associates employed in the preparation of this report has any beneficial interest in GCM. The Consultants are not insiders, associates, or affiliates of GCM. The results of this Technical Report are not dependent upon any prior agreements concerning the conclusions to be reached, nor are there any undisclosed understandings concerning any future business dealings between GCM and the Consultants. The Consultants are being paid a fee for their work in accordance with normal professional consulting practice.
The following individuals, by virtue of their education, experience and professional association, are considered Qualified Persons (QP) as defined in the NI 43-101 standard, for this report, and are members in good standing of appropriate professional institutions. QP certificates of authors are provided in Appendix A. The QP’s are responsible for specific sections as follows:
| • | Ben Parsons, BSc, MSc, MAusIMM (CP), Practice Leader/Principal Resource Geologist, is the QP responsible for property, geology and mineral resources Sections 1.1 through 1.3, 1.5, 4 (except for 4.5), 5 (except 5.5), 6, 7, 8, 10, 11 (except 11.5), 12 (except 12.1.2), 14 (except 14.2), 23, 25.1 and 26.1. |
|
BP/KD |
May 2022 |
| SRK Consulting (U.S.), Inc. NI 43-101 Technical Report – Segovia 2021 PFS Update |
Page 24 |
| • | Giovanny Ortiz, BS Geology, FAusIMM, Principal Resource Geologist, is the QP that performed the site visit in January 2022 and participated in the completion of the Sections 9,11.5, 12.1.2 and 14.2. |
| • | Eric Olin, MSc Metallurgy, MBA, SME-RM, MAusIMM, Principal Metallurgist, is the QP responsible for mineral processing, metallurgical testing and recovery, Sections 1.4, 1.8, 5.5.6, 13, 17, 25.2, 25.4 and 26.3. |
| • | Cristian A. Pereira Farias, SME-RM, Principal Hydrogeologist, is the QP responsible for hydrogeological Sections 1.7.2, 1.7.3, 16.5, 16.7, 25.5 and 26.5.3. |
| • | David Bird, MSc, PG, RM-SME, Associate Principal Geochemist, is the QP responsible for geochemistry Sections 1.10.1, 16.8, 20.1.3, 25.7.1, and 26.5.1. |
| • | Fredy Henriquez, MS Eng, SME, ISRM, Principal Consultant, Rock Mechanics, is the QP responsible for geotechnical Section 1.7.1 and 16.4, 25.3.1 and 26.2.2. |
| • | Jeff Osborn, BEng Mining, MMSAQP, Principal Mining Engineer, is the QP responsible for infrastructure, capital and operating costs, economic analysis and general report Sections 1-introduction, 1.9 (except for 1.9.1), 1.11, 1.12, 2, 3, 5.4 (except 5.4.4 and 5.4.6), 18 (except for 18.2), 19, 21, 22, 24, 25.5, 25.6, 25.8, 25.9, 26.4.1, 26.5.2, 26.7, 27 and 28. |
| • | Fernando Rodrigues, BS Mining, MBA, MAusIMM, MMSAQP, Practice Leader/Principal Mining Engineer, is the QP responsible for mining and mineral reserves Sections 1.6, 1.7 (except for 1.7.1, 1.7.2, 1.7.3), 15, 16 (except for 16.4, 16.5, 16.7 and 16.8), 25.3.2 and 26.2.1. |
| • | Joshua Sames, PE, BEng Civil, Principal Consultant, is the QP responsible for tailings Sections 18.2, 1.9.1, 5.5.4 and 26.4.2. |
| • | Mark Willow, MSc, CEM, SME-RM, Practice Leader/Principal Environmental Scientist, is the QP responsible for environmental studies, permitting and social or community impact Sections 1.10 (except 1.10.1 and 1.10.2), 4.5, 20 (except 20.1.3, 20.5), 25.7 (except 25.7.1) and 26.6. |
| • | Jeff Parshley, C.P.G., Practice Leader/Corporate Consultant, is the QP responsible for closure Sections 1.10.2 and 20.5. |
| 2.3 | Details of Inspection |
Table 2-1 lists the SRK team members who visited the Project site. During the various site visits, the group toured the general areas of mineralization, historic and current mining and drilling sites, reviewed existing infrastructure, observed drill core, and reviewed the geological modeling and project data files with GCM’ technical staff.
|
BP/KD |
May 2022 |
| SRK Consulting (U.S.), Inc. NI 43-101 Technical Report – Segovia 2021 PFS Update |
Page 25 |
Table 2-1: Site Visit Participants
| Personnel | Company | Expertise | Date(s) of Visit | Details of Inspection | ||||
| Ben Parsons |
SRK |
Mineral Resources |
August 21 to August 23 2018 | Database review and geological modeling | ||||
| Mineral Resources |
April 11, 2018 to April 13, 2018 | Underground site inspection, drilling station audit, mine laboratory visit, review drilling | ||||||
| Mineral Resources |
January 22, 2018 to January 25, 2018 | Database review, and geological modeling | ||||||
| Giovanny Ortiz |
SRK |
Mineral Resources |
December 2, 2020 to December 7, 2020 | Underground site inspection (Carla, Sandra K and El Silencio, UG drilling station audit, core logging and QA/QC procedures review, geological modeling review | ||||
| January 25, 2022 to January 28, 2022 | Underground site inspection (El Silencio (zone of veins , core logging and QA/QC procedures review and geological model discussion with mine and exploration teams | |||||||
| Fernando Rodrigues |
SRK |
Mining |
March 10-11, 2022 | Cost review, mine planning Discussions | ||||
| Mining |
March 11 to March 12, 2020 | Operating and capital cost review and mine plan/infrastructure review | ||||||
| Mining |
February 19 to February 20, 2020 | Cost review, mine planning discussions | ||||||
| Mining |
February 7 to February 8, 2019 | Cost review, mine planning discussions. | ||||||
| Mining |
January 7 to January 10, 2019 | Cost review, mine planning discussions. | ||||||
| Mining |
February 6 to February 8, 2018 | Cost review, mine planning discussions, | ||||||
| Mining |
June 11 to June 14, 2018 | Cost review, mine planning discussions. | ||||||
| Mining |
November 11 to November 21, 2018 | Cost review, mine planning discussions. | ||||||
| Fredy Henriquez |
SRK |
Geotechnical |
February 7 to February 8, 2019 | Underground geotechnical mapping and core yard visit | ||||
| Geotechnical |
May 3 to May 8, 2021 | Underground geotechnical review Sandra K, Providencia, El Silencio, and Carla | ||||||
| Mark Willow |
SRK |
Environmental/ |
November 29 to November 30, 2016 | Project area, TSF | ||||
| Eric Olin |
SRK |
Metallurgy/Process |
December 03 to December 04, 2019 | Process Plant | ||||
| Joshua Sames |
SRK |
Tailings |
January 28 to January 29, 2020 | TSF, Project area | ||||
| Cristian Pereira |
SRK |
Hydrogeology |
August 9 to August 11, 2020 | Site visit to Sandra-K, Providencia and El Silencio mines | ||||
| Jeff Osborn |
SRK |
Infrastructure |
March 11 to March 12, 2020 | Operating and capital cost review and mine plan/infrastructure review | ||||
| Infrastructure |
October 1 to October 4, 2018 | Cost review, plan update discussions | ||||||
| Infrastructure |
February 6 to February 8, 2018 | Project area, TSF |
Source: SRK, 2022
|
BP/KD |
May 2022 |
| SRK Consulting (U.S.), Inc. NI 43-101 Technical Report – Segovia 2021 PFS Update |
Page 26 |
| 2.4 | Sources of Information |
This report is based in part on internal Company technical reports, previous feasibility studies, maps, published government reports, Company letters and memoranda, and public information as cited throughout this report and listed in Section 27 References.
SRK has been supplied with numerous technical reports and historical technical files. SRK’s report is based upon:
| • | Numerous technical review meetings held at GCM’s offices in Medellín |
| • | Discussions with directors, employees, and consultants of the Company |
| • | Data collected by the Company from historical exploration on the Project |
| • | Access to key personnel within the Company, for discussion and enquiry |
| • | A review of data collection procedures and protocols, including the methodologies applied in determining assays and measurements |
| • | Existing reports provided to SRK, as follows: |
| ○ | Face mapping provided by Segovia geotechnical team |
| ○ | Estudio Geomecanico y Minado, Mina Carla (2018) by Geomecanica del Peru EIRL Estudio Geomecanico y Minado, Mina El Silencio (2018) by Geomecanica del Peru EIRL |
| ○ | Estudio Geomecanico y Minado, Mina Providencia (2018) by Geomecanica del Peru EIRL |
| ○ | Estudio Geomecanico y Minado, Mina Sandra K (2018) by Geomecanica del Peru EIRL |
| ○ | Laboratory test program (2019) provided by Segovia geotechnical personnel |
| ○ | Medoro Resources Ltd., Gran Colombia Gold, S.A., Tapestry Resource Corp, NI43-101 Technical Report Frontino Gold Mines Ltd. Antioquia Colombia June 9, 2010 (SEWC) |
| ○ | Review of Exploration at the Gran Colombia Gold Mine, Municipalities of Segovia and Remedios, Department of Antioquia, Colombia, 10 July 2011 (Dr. Stewart D. Redwood) |
| ○ | Structural Review of the Zandor Capital Project Colombia, November 2011 (Telluris Consulting |
| ○ | Structural Review of the Zandor Capital Project Colombia, January 2013 (Telluris Consulting) |
| ○ | Segovia Structural Geology Review Memorandum, August 2019 (SRK Consulting) |
| ○ | El Chocho Tailings Storage Facility, Final Design Report, prepared for Gran Colombia Gold Corp, Segovia Project, Knight Piésold, July 2012 |
| ○ | Presa El Chocho Para Almacenamiento de Lodos, Optimización del Volumen de Almacenamiento, Revision de Diseno Definitivo, prepared for Gran Colombia Gold Corp. Proyecto Pampa Verde, iConsult, February 2013 |
| ○ | Revisión Técnica del Informe de Diseño Final – Deposito de Almacenamiento de Relaves El Chocho, Auditoría de Residuos Sólidos Industriales por Beneficio de Minerales Auríferos, prepared for Gran Colombia Gold Corp., Amec Foster Wheeler, November 2016a |
| ○ | Análisis del Sistema de Manejo Actual de Relaves – Alterativas de Corto, Mediano, y Largo Plazo, Auditoría de Residuos Sólidos Industriales por Beneficio de Minerales Auríferos, prepared for Gran Colombia Gold Corp., Amec Foster Wheeler, November 2016b |
| ○ | Construction drawings provided by Gran Colombia Gold Corp for Fase IC of the El Chocho tailings storage facility prepared by Wood (dated September 2019) |
|
BP/KD |
May 2022 |
| SRK Consulting (U.S.), Inc. NI 43-101 Technical Report – Segovia 2021 PFS Update |
Page 27 |
| ○ | Construction drawings provided by Gran Colombia Gold Corp for Fase 2A of the El Chocho tailings storage facility prepared by Wood (dated September 2019) |
| ○ | El Chocho Filtered Tailings Storage Facility Detailed Design Report for Phase 1C and 2A provided by Gran Colombia, prepared by Wood (Dated December 2019) |
| ○ | Maccaferri Geotube Stacking Drawings and Design Calculation Package provided by Gran Colombia (dated June 2018) |
| • | Data files provided by the Company to SRK as follows: |
| ○ | Topographic grid data in digital format |
| ○ | Drillhole database including collar, survey, geology, and assay |
| ○ | QA/QC data including details on duplicates, blanks and certified reference material (CRM) |
| ○ | DXF files, including geological interpretation, vein domain digitized two-dimensional (2D) section interpretations, stope outlines and mined depletions |
| 2.5 | Effective Date |
The effective date of this report is December 31, 2021.
| 2.6 | Units of Measure |
The metric system has been used throughout this report. Tonnes are metric of 1,000 kg, or 2,204.6 lb. All currency is in U.S. dollars (US$) unless otherwise stated.
|
BP/KD |
May 2022 |
| SRK Consulting (U.S.), Inc. NI 43-101 Technical Report – Segovia 2021 PFS Update |
Page 28 |
| 3 | Reliance on Other Experts |
The Consultant’s opinion contained herein is based on information provided to the Consultants by GCM throughout the course of the investigations. SRK has relied upon the work of other consultants as described in the bullets following for the project areas in support of this Technical Report.
SRK relied on GCM’s legal representation to describe the:
| • | Geopolitical Status |
| • | Mineral Rights |
| • | Nature and Extent of Ownership |
| • | Royalties, Agreements and Encumbrances |
These items have not been independently reviewed by SRK, and SRK did not seek an independent legal opinion of these items.
SRK has relied on publicly available data and GCM management for information to address various Project financial aspects including:
| • | Information based on the standard Colombian corporate income tax (CIT) regime |
| • | Carry forward losses |
| • | Depreciation methods and eligible assets |
These items have not been independently reviewed by SRK, and SRK did not seek an independent legal opinion of these items. The Consultants used their experience to determine if the information from previous reports was suitable for inclusion in this technical report and adjusted information that required amending. This report includes technical information, which required subsequent calculations to derive subtotals, totals and weighted averages. Such calculations inherently involve a degree of rounding and consequently introduce a margin of error. Where these occur, the Consultants do not consider them to be material.
|
BP/KD |
May 2022 |
| SRK Consulting (U.S.), Inc. NI 43-101 Technical Report – Segovia 2021 PFS Update |
Page 29 |
| 4 | Property Description and Location |
| 4.1 | Property Location |
The Segovia Project is a gold mining complex located in Colombia’s Segovia-Remedios mining district, Department of Antioquia, north-west Colombia approximately 180 km northeast of Medellín (the Department capital of Antioquia), at 74° 42’ W and 7° 04’ N. The Carla Project is a development stage project located approximately 10 km southeast of Segovia at approximately 7° 04’ 18.0’’ N, 74° 41’ 55.5’’ W (Figure 4-1).
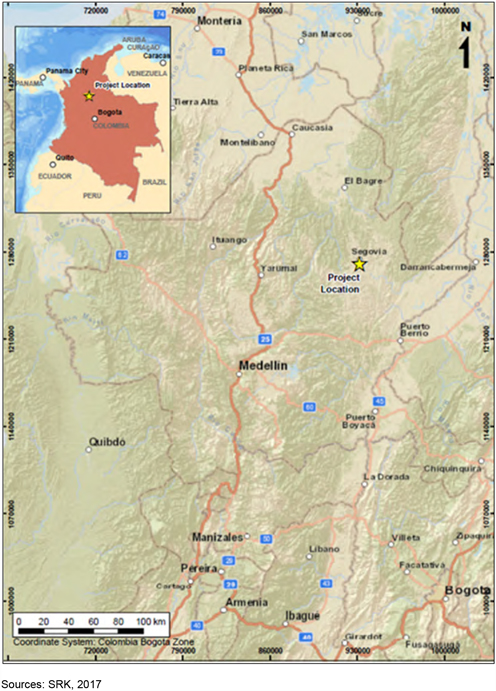
Figure 4-1: Location Map of the Segovia Project
|
BP/KD |
May 2022 |
| SRK Consulting (U.S.), Inc. NI 43-101 Technical Report – Segovia 2021 PFS Update |
Page 30 |
| 4.2 | Mineral Titles |
The mining rights for the Segovia Project are comprised of Mining Title No. RPP 140 and two Exploration Licenses with a total area of approximately 2,906 hectares (ha), located in the municipalities of Segovia and Remedios, in the Department of Antioquia. The license was previously held by FGM but, as of August 2010, is now owned by GCM, a subsidiary of GCG. The Carla Project comprises of four concessions (6045, 7367, 6000 and 5995), which have a combined area of approximately 567.24 ha, and are located largely to the south of the Segovia License. The Titles Concession Contract C4998005 (HCIJ-38, 4998: 12 ha) and Concession Contract C6048005 (HFQL-07, 6048: 291.38 ha) are titles held by GCM in the Carla area and are shown in green in Figure 4-2.
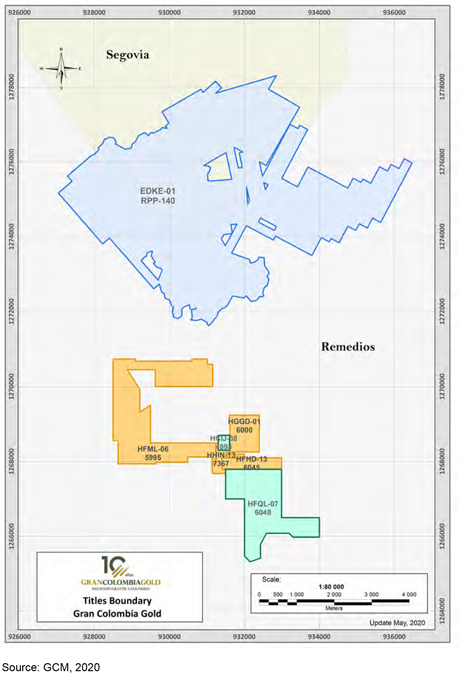
Figure 4-2: License Boundaries for Segovia and Carla Projects
|
BP/KD |
May 2022 |
| SRK Consulting (U.S.), Inc. NI 43-101 Technical Report – Segovia 2021 PFS Update |
Page 31 |
SRK has not performed an independent verification of land title and tenure as summarized and has relied on GCM’ legal advisor for land title issues.
The RPP type of contract license means Private Property Recognition of a Mining Title (Reconocimiento de Propiedad Privada or RPP) and it is not a Concession Contract. RPPs were created by Law 20 of 1969. The law respected prior mining and land rights and required that proof of mining be submitted. The RPP title is an old freehold property dating from the 19th Century. The RPP titles grant mining rights in perpetuity. Exploitation is required in order to maintain the validity of an RPP license.
The title was unified from RPP numbers 140 to 198 on March 27, 1998 by Resolution No. 700371. The original area of the mining titles was about 14,000 ha and was reduced to the present 2,871 ha due to a lack of mine production from the now relinquished area. The title was registered as RPP 140 on April 4, 1983 by Resolution No. 000410 of the Colombia Ministry of Mines and Energy. The private property of this mining title was granted to FGM in perpetuity until the depletion of mineral resources in the area covered by the title. Since RPP 140 is not a Concession Contract, the titleholder does not have to comply with the obligations imposed on Concessionaires or Licensees under Concession Contracts and Exploration or Exploitation Licenses. The main legal obligation that the titleholder of RPP 140 has is not to suspend exploitation for more than one year. The property is currently in exploitation. Other obligations such as payment of taxes (property tax, surface tax, etc.), payment of the compensation and royalties for exploited minerals and the presentation of semi-annual Basic Mining Reports and Technical Reports must be complied with but are not mandatory conditions to be met in order to retain the property of Mining Title RPP 140.
| • | Exploration License No. 3855 was issued to FGM on July 27, 1998 (Resolution 10397) and was registered on May 24, 2005 for a one-year term. On March 26, 2021, the New Concession Contract was awarded for a 30-year term (March 25, 2051). |
| • | Exploration License No. 3854 was issued on August 3, 1998 (Resolution 10440) and was registered on June 14, 2005 for a one-year term. Pending approval of the Programa de Trabajos y Obras (PTO). |
Within its term, FGM applied for the conversion of Exploration Licenses No. 3854 and 3855 into Concession Contracts. The PTO was approved, and the new concession contract No L3855005 (Before License No. 3855) was registered in the Mining Registry on March 26, 2021. As to the case of Exploration License No. 3854, in September 2021 the mining authority granted to GCM the area under a concession contract.
Concessions issued as per the conversion of Exploration Licenses will have a duration of 30 years from the date of registration, of which the initial one-year term of the Exploration License will be deducted.
There are also seven “Other titles” that belong to third parties surrounded by the area of RPP 140 with a total area of 35.81 ha. These are shown on Figure 4-3 and summarized in Table 4-1.
The exploration licenses and third-party titles are in gaps between the original mining titles which were unified to create RPP 140 in 1998. The area of 2,871 ha for RPP 140 is net of the exploration licenses and third-party titles.
|
BP/KD |
May 2022 |
| SRK Consulting (U.S.), Inc. NI 43-101 Technical Report – Segovia 2021 PFS Update |
Page 32 |
Table 4-1: Mineral Tenure Information
| Title Number | Area (ha) |
Type | Date Awarded |
Expiration Date | ||||||
| RPP 140 | 2,871 | RPP Exploitation |
May 16,1990 | Granted in perpetuity | ||||||
| No. 3854 | 25.809 | Exploration | June 14, 2005 | 13/06/2006 Undergoing conversion to concession Awarded September,2021 | ||||||
| C.C. # L3855005 (Before L. 3855) | 9.729 | Concession Contract |
May 24, 2005 | 25/03/2051 | ||||||
|
Total (ha) |
2,906 | |||||||||
|
Other (Seven Minor Licenses) |
35 | |||||||||
Source: SRK, 2021
|
BP/KD |
May 2022 |
| SRK Consulting (U.S.), Inc. NI 43-101 Technical Report – Segovia 2021 PFS Update |
Page 33 |
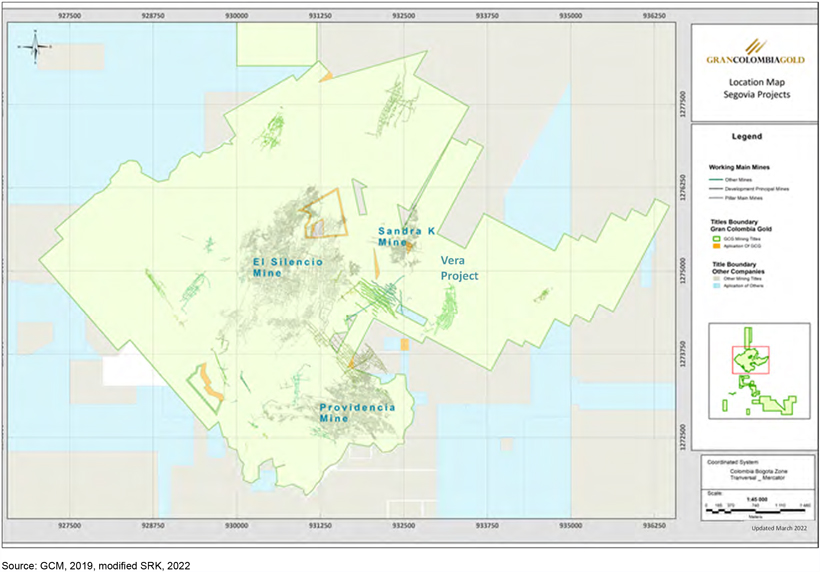
Figure 4-3: Location Map Showing Segovia License Boundary and Current Mines
|
BP/KD |
May 2022 |
| SRK Consulting (U.S.), Inc. NI 43-101 Technical Report – Segovia 2021 PFS Update |
Page 34 |
| 4.3 | Surface Land Rights |
The Company owns 177 surface land properties (lots and haciendas or farms) in the municipalities of Segovia and Remedios, above and adjacent to the mining title RPP 140 and ancillary facilities such as the hydroelectric plants. These have a total area of about 6,406.8 ha. The surface land properties include essential properties and non-essential properties for the development of mining activities.
There are four surface land properties which are essential for the development of the mining activity, due to their geographic location regarding access to the mines. These properties are described as follows:
| • | La Salada Property (1,108 ha) – Located above the El Silencio Mine |
| • | Marmajon Property (238 ha) – Located above the Providencia Mine |
| • | La Iluminada Property (16.8 ha) – Located above the Sandra K Mine |
| • | Hacienda Vera (15.3 ha) – Located above the Sandra K Mine |
The Carla 2.4 ha land property is leased by GCM, through agreement with Mr. Luis Montoya. Figure 4-5 shows and image showing the location of the Carla mine and the leased property boundary.
|
BP/KD |
May 2022 |
| SRK Consulting (U.S.), Inc. NI 43-101 Technical Report – Segovia 2021 PFS Update |
Page 35 |
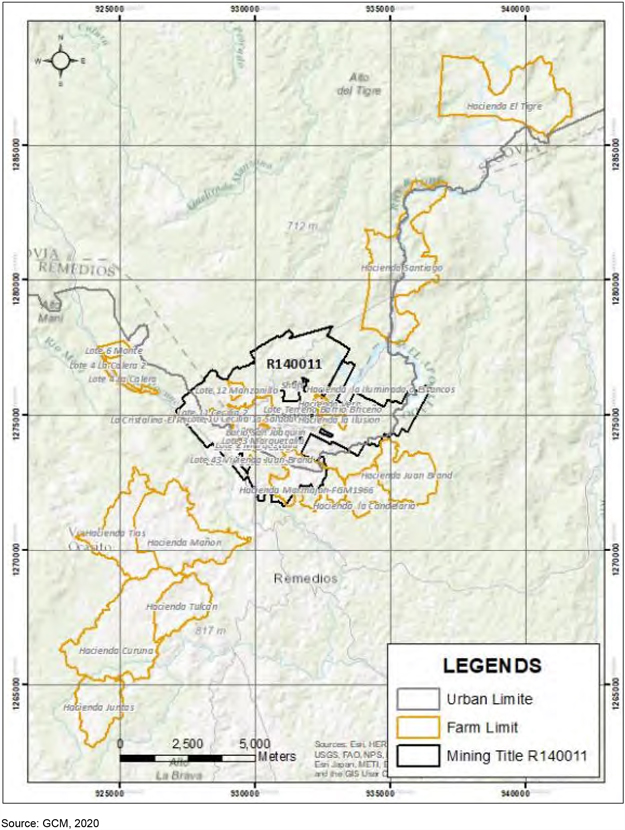
Figure 4-4: Land Tenure Map
|
BP/KD |
May 2022 |
| SRK Consulting (U.S.), Inc. NI 43-101 Technical Report – Segovia 2021 PFS Update |
Page 36 |
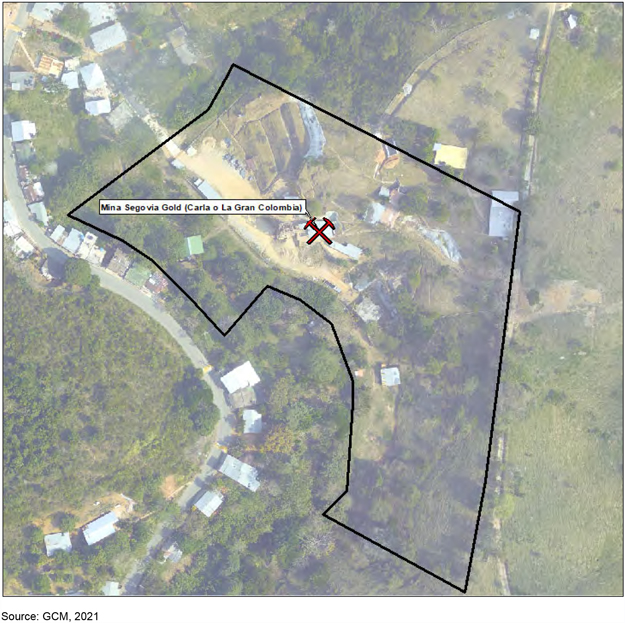
Figure 4-5: Photography Showing the Location of the Carla Mine and the Boundary of the Land Property (Rented)
| 4.4 | Royalties, Agreements and Encumbrances |
The Company has entered into operating agreements with respect to designated sections of the El Silencio and Providencia mines with third-party contractors known as Navar and Masora. The Navar (El Silencio Mine) Masora (Providencia Mine) contracts, which started in 2013, incorporate the contractors into the mining operations of GCM’s mines where they carry out pillar recovery mining. GCM pays the contractors for Run of Mine (RoM) material based on gold recovered from the RoM material and processes the RoM material in its processing plant. In 2021, Segovia’s total gold production included 55,345 ounces (oz) from RoM material mined by Navar and 13,549 oz from RoM material mined by Masora.
|
BP/KD |
May 2022 |
| SRK Consulting (U.S.), Inc. NI 43-101 Technical Report – Segovia 2021 PFS Update |
Page 37 |
The Company has also entered into operating agreements with third-party operators to exploit other small-scale mines located within its mining title (but for which the material is not included in its Mineral Resource estimate) and outside its primary mines. The Company monitors the mining activities at these operations and pays the small-scale miners based of recovered gold for RoM material that is then processed at its Maria Dama plant and sold by the Company. These agreements are part of an ongoing program for the integration of informal small miners into the supply chain, with added environmental, social and security benefits. Currently, there are 63 operating agreements in force. In 2021, Segovia’s total gold production included 33,957 oz from RoM material mined by these small-scale miners.
On February 19, 2021, Denarius Metals Corp. (TSX-V: DSLV, OTCQB: DNRSF) (Denarius) completed the acquisition of the rights from a third party to the Guia Antigua Project, formerly referred to as the Chicharron Project, which is located in the Segovia Remedios mining district of Antioquia, Colombia and includes the historic silver-gold producing Guia Antigua Mine (Figure 4-6). The Guia Antigua Project encompasses the exploration, development and mining rights to a 386 ha area located in the eastern part of GCM’s Segovia mining title focused on the Guía Antigua vein which falls outside the areas associated with GCM’s mining operations and exploration activities.
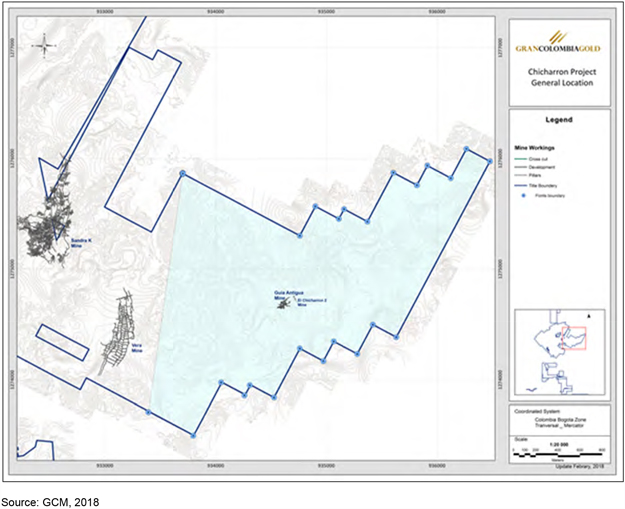
Figure 4-6: Map Showing the Location and Boundaries Defining the Chicharron Project
|
BP/KD |
May 2022 |
| SRK Consulting (U.S.), Inc. NI 43-101 Technical Report – Segovia 2021 PFS Update |
Page 38 |
| 4.5 | Environmental Liabilities and Permitting |
| 4.5.1 | Environmental Liabilities |
The Company’s subsidiary (now GCM) made an agreement dated March 29, 2010 to purchase the mining and other assets of FGM under a Promise to Sell governed by Colombian agreement, which was approved by the Liquidation Advisory Board. The sale included all assets of FGM with no associated financial liability. The assets also include RPP 140, plus several lots of land covering the location of the mines and ancillary facilities, as well as processing, power generation, accommodation and medical facilities, among others.
The 2001 Mining Code requires the concession holder to obtain an insurance policy to guarantee compliance with mining and environmental obligations which must be approved by the relevant authority, annually renewed, and remain in effect during the life of the project and for three years from the date of termination of the concession contract. The value to be insured will be calculated as follows:
| • | During the exploration phase of the project, the insured value under the policy must be 5% of the value of the planned annual exploration expenditures |
| • | During the construction phase, the insured value under the policy must be 5% of the planned investment for assembly and construction |
| • | During the exploitation phase, the insured value under the policy must be 10% of the value resulting from the estimated annual production multiplied by the pithead price established annually by the government |
According to the Law, the concession holder is during the term of the contract liable for environmental remediation and other liabilities based on actions and or omissions during the mining contract period, even if those actions or omissions are held by an authorized third-party operator. However, the owner is not responsible for environmental liabilities which occurred before the mining contract, from activities done in the past, or from those which result from non-regulated mining activity, as has occurred on and around Segovia´s Project site. Given the tenure of Mining title RPP 140, the Environmental Insurance Policy is not required.
Current liabilities at the site are generally associated with the reclamation and closure of the mining facilities and tailings disposal areas. Given the extensive impacts associated with artisanal mining in the area, a clear delineation between possible environmental liabilities attributable to the Company and those from unregulated mining activities is not possible; however, the Company has been making a concerted effort to deal with legacy environmental issues in order to better make that separation. The social issues related to mining in Colombia, especially the interactions between mining companies and artisanal operators, have been violent at times, and could continue to pose a health and safety liability for Company employees and the neighboring communities.
| 4.5.2 | Required Permits and Status |
Discussion related to mining in Colombia, the Mining and Environmental Codes, as well as the permits and authorizations necessary for mineral exploration and exploitation is provided in Section 20.3.
|
BP/KD |
May 2022 |
| SRK Consulting (U.S.), Inc. NI 43-101 Technical Report – Segovia 2021 PFS Update |
Page 39 |
| 4.6 | Other Significant Factors and Risks |
SRK is not aware of any other factors or risks that affect access, title or right or ability to perform work on the property, other than those stated in the above sections, which SRK would expect to have a material impact on the resource statement.
|
BP/KD |
May 2022 |
| SRK Consulting (U.S.), Inc. NI 43-101 Technical Report – Segovia 2021 PFS Update |
Page 40 |
| 5 | Accessibility, Climate, Local Resources, Infrastructure and Physiography |
The Project is located in the foothills of the north-eastern part of the Central Cordillera of the Colombian Andes. The topography is a low-lying plateau or erosional surface at 600 to 850 m altitude, which is incised by valleys with a relief of less than 250 m, but with steep slopes of between 20° and 40°. The drainage pattern is dendritic.
The principal rivers in the Project area are the Pocuné, Bagre and Ité. On the west side of Segovia, the Pocuné River drains north into the Nechi River, which hosts major placer gold mining operations. The Nechi is a tributary of the Cauca River, which in turn joins the Magdalena River which flows into the Caribbean Sea at Barranquilla. The Bagre River drains the northeast part of the area and is also a tributary of the Nechi. On the south side of Segovia, the Ité River flows southeast and then northeast directly into the Magdalena River.
Vegetation in the local area in its primary state is tropical forest, but most areas have been cleared for cattle grazing with some degree of secondary forest growth.
| 5.1 | Accessibility and Transportation to the Property |
Segovia is located 180 km NE of Medellín in the Segovia-Remedios mining district, Department of Antioquia, north-western Colombia, at 74° 42’ W and 7° 04’ N.
Road access from Medellín to Segovia is 225 km, which has recently been upgraded and is now paved the entire length. Going northwards, there is a 61-km road from Segovia to Zaragoza, and a further 120 km to Caucasia, to connect with roads that lead to the Atlantic ports of Colombia (Figure 5-1).
Air access is by a 30-minute charter flight from Medellín to Otú, 15 km south of Segovia, which has an asphalt-surfaced airstrip. From Otú, it is a 20-minute drive to Segovia via the towns of Remedios and La Cruzada.
|
BP/KD |
May 2022 |
| SRK Consulting (U.S.), Inc. NI 43-101 Technical Report – Segovia 2021 PFS Update |
Page 41 |
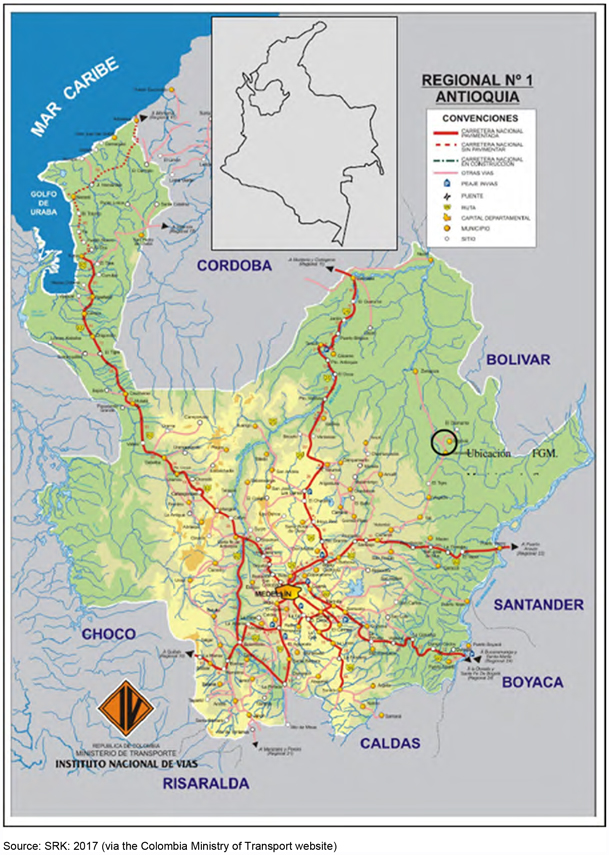
Figure 5-1: Map Showing Road Access to Segovia Property and Major Routes through the Department of Antioquia
|
BP/KD |
May 2022 |
| SRK Consulting (U.S.), Inc. NI 43-101 Technical Report – Segovia 2021 PFS Update |
Page 42 |
| 5.2 | Climate and Length of Operating Season |
Different climates can be found within the region and vary with elevation. These climates can be defined as:
| • | Hot (more than 24°C) below 1,000 m in the Cauca River valley |
| • | Temperate (18°C to 24°C) between 1,000 and 2,000 m |
| • | Cold above 2,000 m (12°C to 18°C) |
Segovia is situated within the hot zone where the climate is tropical and wet with an annual rainfall of approximately 2,670 millimeters (mm). The town of Segovia has an average temperature of 25°C. Rainfall has a bimodal distribution with the wettest months from May to December and a dry season from December to May. A weather station at La Cruzada, Remedios recorded an annual rainfall of 2,670 mm, with an average temperature of 25°C, and a relative humidity of 70%.
| 5.3 | Sufficiency of Surface Rights |
See Section 4.3.
| 5.4 | Infrastructure Availability and Sources |
| 5.4.1 | Power |
The Project is well supplied with power from two sources. The first is a large utility company Empresas Públicas de Medellín E.S.P (EPM). EPM is a major utility, that in addition to power, supplies natural gas and water. EPM supplies about 20% of Colombia’s power. The second source of power comes from Proelèctrica a smaller independent producer that operates the 8.6 million watts (MW) Doña Teresa hydroelectric project approximately 20 km from the Segovia site. Power reliability has much improved from the past with good consistency.
| 5.4.2 | Water |
The Project has water supplied from the underground dewatering efforts and rainwater. The water is stored in a pond named La Tupia lake near the Maria Dama processing facility. The plant uses approximately 100 cubic meters per hour (m3/hr) supplied mainly by La Tupia.
| 5.4.3 | Mining Personnel |
The project has good access to skilled mining personnel as there has been mining in the area for well over 100 years. There are a large number of artesian miners in the area and GCM has a successful recruiting program when personnel are needed. A substantial number of contract miners are available for hire to supplement the GCM work force. The miners are available from Segovia, La Cruzada and the surrounding communities.
| 5.4.4 | Potential Tailings Storage Areas |
The site utilizes the El Chocho facility for long term tailings storage. The site is adequate for current Life of Mine (LoM) plans.
|
BP/KD |
May 2022 |
| SRK Consulting (U.S.), Inc. NI 43-101 Technical Report – Segovia 2021 PFS Update |
Page 43 |
| 5.4.5 | Potential Waste Disposal Areas |
Waste is stored at the mine sites and is used productively throughout the operation. Adequate sites exist to manage the waste for the LoM. Some waste may be utilized in construction of additional cells at the El Chocho TSF.
| 5.4.6 | Potential Processing Plant Sites |
The Project is utilizing the existing Maria Dama plant to process the mined ore. A second site is available if needed at the nearby Pampa Verde location where a mill construction was initiated but then halted as the gold price dropped. There are no current plans to utilize the Pampa Verde site.
|
BP/KD |
May 2022 |
| SRK Consulting (U.S.), Inc. NI 43-101 Technical Report – Segovia 2021 PFS Update |
Page 44 |
| 6 | History |
In preparing these sections of this report relating to background and historical information, exploration and geological setting, SRK has relied upon previous Technical Reports by SRK, SEWC and Dr. Stewart Redwood.
Initial exploration activity began in the town of Remedios in 1560, but activity was limited due to the location and difficult terrain to access mineable areas. By the mid-18th century, mining activity was almost abandoned. A second phase of gold mining began following independence and an influx of investment from Great Britain, through London-registered mining companies. Mining in the district began in large around the early 1850s, with the town of Segovia founded in 1869, a few km north of the town of Remedios. Segovia was declared a separate municipality in 1885.
| 6.1 | Prior Ownership and Ownership Changes |
FGM is reported to have been founded in 1852 but was only detailed as the Frontino and Bolivia (South American) Gold Company Limited in 1864. The company mined in the Municipality of Frontino and the Bolivia Mine at Remedios. It was formed to buy and work the mines of El Silencio, Cordoba, La Salada and San Joaquin on a property of 5,000 acres.
In 1874, the operations in Frontino were floated off as a separate company, the Antioquia (Frontino) Gold Mining Co Ltd. The company then focused on the Remedios district, where it purchased additional mines, and by the late 19th century it was one of the largest companies in Colombia, with 700 employees. Gold production from the whole district was 24,666 oz in 1888 and 41,250 oz in 1893.
GCM through its subsidiary Zandor, made an agreement dated March 29, 2010 to purchase the mining and other assets of FGM under a Promise to Sell governed by Colombia agreement, which was approved by the Liquidation Advisory Board. The sale included all assets of FGM with no associated financial liability. The assets also included RPP 140, plus several lots of land covering the location of the mines and ancillary facilities, as well as processing, power generation, accommodation and medical facilities, among others.
The sale price was COP$380,000,000,000 (approximately US$200M) net of taxes, as adjusted, with the exclusive purpose of paying FGM’s labor and pension liabilities. Zandor will have no further liabilities with respect to any historical pension liabilities, severance costs and other liabilities. The Company announced the completion of the acquisition on August 23, 2010.
In March 2010, Medoro and GCM entered into an agreement for GCM to acquire a 50% interest in Zandor and the FGM assets. This was later modified (June 8, 2010), and as part of the agreement GCM would be responsible for all the acquisition costs (approximately US$7.5M) for a 95% interest in Zandor, with Medoro retaining 5% (with the option of acquiring an additional 45% interest in Zandor). The agreement also included GCM acting as the operator at the project.
On June 13, 2011, GCM and Medoro Resources Ltd, merged to form a single company Gran Colombia Gold Corp., which is the 100% owner of the Project. On November 29, 2021 Gran Colombia Gold Corp announced the change of the name to GCM Mining Corp.
|
BP/KD |
May 2022 |
| SRK Consulting (U.S.), Inc. NI 43-101 Technical Report – Segovia 2021 PFS Update |
Page 45 |
| 6.2 | Exploration and Development Results of Previous Owners |
It is understood that the previous owners of the Segovia Project (FGM) did not complete any regional surface geological mapping, exploration geochemistry, or surface or airborne geophysics. Historical exploration data is limited to underground mapping and sampling and drilling for resource development.
In addition to the operating mines included in the current Mineral Resource, a number of other mines exist within the RPP license. GCM has completed work during 2020 to capture information from a number of these mines into the updated database. The process has involved access to the operations, data captured from historical maps and plans, positioning of data spatially in the same coordinates as the main mines. Data capture continued during 2021, with additional validation sampling completed and revision of the database to account for changes in coordinate systems and units (historically reported in penny weights and inches). This work focused in the historical Cogote mine which contains two veins named Julio and Patron, which are in close proximity to the Sandra K mine. Data capture and validation programs are scheduled to continue in 2022 on a number of the other mines focusing around the Cristales and San Nicolas mines to the north of El Silencio and Sandra K respectively, but at present SRK does not consider the exploration databases to be of sufficient levels to produce a compliant Mineral Resource estimate.
| 6.3 | Historic Mineral Resource and Reserve Estimates |
A number of different MREs have been completed on the property during the history of the project.
In June 2010, SEWC reported a MRE based on a variable cut-off reflecting different gold price assumptions (US$1,000/oz and US$850/oz) for Indicated and Inferred Mineral Resources respectively and a Probable MRE. These estimates are dated and were based on only a small sub-section of the database and are therefore superseded by the on-going work completed by SRK.
Between 2010 and 2020, SRK has produced a number of MREs for the Segovia Project. The most recent prior Mineral Resource Statement for the Project has an effective date of December 31, 2019, which is the last date assays were provided previously to SRK.
The Mineral Resource estimation process was a collaborative effort between SRK and GCM staff. GCM provided SRK with an exploration database with flags of the main veins as interpreted by GCM. SRK completed a statistical analysis, including a capping and compositing analysis on the coded samples.
SRK imported the geological information into Seequent Leapfrog Geo® (Leapfrog®) to complete the geological model. Leapfrog® was selected due to the ability to rapidly create, accurate geological interpretations, that can interact with a series of geological conditions.
SRK has produced block models using Datamine™ Studio. The procedure involved construction of wireframe models for the fault networks, veins, definition of resource domains (high-grade subdomains), data conditioning (compositing and capping) for statistical analysis, geostatistical analysis, variography, block modeling and grade interpolation followed by validation. Grade estimation has been based on block dimensions of 5 m x 5 m x 5 m, for the updated models. The block size reflects that the majority of the estimates are supported via underground channel sampling and spacing ranging from 2 to 5 m. Gold grades have been interpolated using nested three pass approaches within Datamine™, using an ordinary kriging (OK) routine for the main veins.
|
BP/KD |
May 2022 |
| SRK Consulting (U.S.), Inc. NI 43-101 Technical Report – Segovia 2021 PFS Update |
Page 46 |
The Mineral Resources were reported in situ based on modeled geological boundaries and do not include the additional material required to be mined by the minimum stoping width. Additionally, Mineral Resources in pillars in the mined-out areas were only reported in the inferred category as the remaining volume is uncertain given artisanal mining activity.
The classification is based on standards as defined by the CIM Definition Standards - For Mineral Resources and Mineral Reserves, prepared by the CIM Standing Committee on Reserve Definitions and adopted by the CIM Council on May 14, 2014. The Resources at the Project have been classified as Measured, Indicated and Inferred at Providencia. At El Silencio and Sandra K, only Indicated and Inferred Resources have previously been defined, but there was a change in 2021 to increase the confidence at Sandra K based on the latest exploration and mining completed by the Company to include a portion of Measured material.
At El Silencio SRK limited the Indicated Mineral Resources to the lower portion of the mine (previously flooded), where the depletion limits are considered more accurate due to a lack of mining activity over prolonged periods of time by Contractor mining.
SRK reported the Mineral Resource based on a single cut-off and assumptions for potential for economic extraction using an assumed minimum mining width. In 2020 to determine the potential for economic extraction SRK has used the following key assumptions for the costing, and a metallurgical recovery of 90.5% Au, has been assumed based on the current performance of the operating plant, and using a US$1,700/oz gold price and an average mining cost. There has been an increase in the gold price from US$1,400/oz to US$1,700/oz when compared to 2019, which represented an increase of approximately 20%, however SRK comments that this increase has been offset to some extent by the assumptions used in the costs between 2019 and 2020 which also an increase of 14.4%. Using the US$1,700 per ounce (oz) gold price and an average mining and processing costs, SRK limited the Mineral Resource using a CoG of 2.9 g/t Au over a (minimum mining) width of 1 m. The classified Mineral Resource is sub-divided into material within the remaining pillars (pillars), and the long term Resources (LTR) outside of the previously mined areas, with the classification for the pillars considered separately given the uncertainty of the extent of remnant pillar mining currently being undertaken by Company-organized co-operative miners. The Mineral Resource statement for the Project is shown in Table 6-1.
|
BP/KD |
May 2022 |
| SRK Consulting (U.S.), Inc. NI 43-101 Technical Report – Segovia 2021 PFS Update |
Page 47 |
Table 6-1: SRK Mineral Resource Statement for the Segovia and Carla Projects with Effective Date of December 31, 2020
| Project | Deposit | Type | Measured | Indicated | Measured and Indicated | Inferred | ||||||||||||||||||||||||||||||||||||||||||||||
| Tonnes | Grade | Au Metal | Tonnes | Grade | Au Metal | Tonnes | Grade | Au Metal | Tonnes | Grade | Au Metal | |||||||||||||||||||||||||||||||||||||||||
| (kt) | (g/t) | (koz) | (kt) | (g/t) | (koz) | (kt) | (g/t) | (koz) | (kt) | (g/t) | (koz) | |||||||||||||||||||||||||||||||||||||||||
| Segovia |
Providencia |
LTR | 218 | 18.5 | 130 | 237 | 14.9 | 114 | 455 | 16.6 | 243 | 171 | 9.9 | 55 | ||||||||||||||||||||||||||||||||||||||
| Pillars | 109 | 22.3 | 78 | 99 | 10.2 | 32 | 208 | 16.5 | 110 | 384 | 19.8 | 245 | ||||||||||||||||||||||||||||||||||||||||
| Sandra K | LTR | 413 | 10.0 | 132 | 413 | 10.0 | 132 | 384 | 9.9 | 122 | ||||||||||||||||||||||||||||||||||||||||||
| Pillars | 156 | 11.1 | 56 | 156 | 11.1 | 56 | 17 | 27.5 | 15 | |||||||||||||||||||||||||||||||||||||||||||
|
El Silencio |
LTR | 1,277 | 9.8 | 404 | 1,277 | 9.8 | 404 | 1,279 | 9.0 | 371 | ||||||||||||||||||||||||||||||||||||||||||
| Pillars | 1,326 | 10.6 | 454 | 1,326 | 10.6 | 454 | 395 | 11.4 | 145 | |||||||||||||||||||||||||||||||||||||||||||
|
Verticales* |
LTR | 771 | 7.1 | 176 | ||||||||||||||||||||||||||||||||||||||||||||||||
|
Subtotal Segovia Project |
LTR | 218 | 18.5 | 130 | 1,927 | 10.5 | 650 | 2,145 | 11.3 | 780 | 2,605 | 8.6 | 724 | |||||||||||||||||||||||||||||||||||||||
| Pillars | 109 | 22.3 | 78 | 1,581 | 10.7 | 542 | 1,690 | 11.4 | 620 | 796 | 15.8 | 405 | ||||||||||||||||||||||||||||||||||||||||
| Carla |
Subtotal Carla Project | LTR | 132 | 6.0 | 25 | 132 | 6.0 | 25 | 260 | 9.7 | 81 | |||||||||||||||||||||||||||||||||||||||||
Source: SRK, 2021
Notes: The Mineral Resources are reported at an in situ cut-off grade of 2.9 g/t Au over a 1.0 m mining width, which has been derived using a gold price of US$1,700/oz, and suitable benchmarked technical and economic parameters for underground mining (mining = US$85.0, processing = US$24.0, G&A = US$24.0, Royalties = US$11.1), and conventional gold mineralized material processing (90.5%). Each of the mining areas have been sub-divided into Pillar areas (“Pillars”), which represent the areas within the current mining development, and LTR, which lies along strike or down dip of the current mining development. Mineral Resources are not Mineral Reserves and do not have demonstrated economic viability. All figures are rounded to reflect the relative accuracy of the estimate. All composites have been capped where appropriate.
|
BP/KD |
May 2022 |
| SRK Consulting (U.S.), Inc. NI 43-101 Technical Report – Segovia 2021 PFS Update |
Page 48 |
| 6.4 | Historic Production |
It has previously been reported that the historic production from FGM between 1869 and 2010, contained more than 4.6 million oz of gold.
Total gold production by the Providencia, El Silencio and Sandra K mines between 2000 and 2021 is given in Table 6-2.
Table 6-2: Summary Statistics for Total Gold Production at Providencia, El Silencio, Sandra K, and Carla Mines 2000 to 2021 1
| Year | Tonnes (t) | Gold (oz) Total | Rec (%) | Gold Grade (g/t) | ||||||||||||||
| 2000 | 149,925 | 85,146 | 100.1 | 17.7 | ||||||||||||||
| 2001 | 170,135 | 50,996 | 98.0 | 9.7 | ||||||||||||||
| 2002 | 168,220 | 42,353 | 101.0 | 7.8 | ||||||||||||||
| 2003 | 144,141 | 42,794 | 88.0 | 9.2 | ||||||||||||||
| 2004 | 158,304 | 51,553 | 91.0 | 10.1 | ||||||||||||||
| 2005 | 178,528 | 54,858 | 91.0 | 9.6 | ||||||||||||||
| 2006 | 202,168 | 60,873 | 86.9 | 9.4 | ||||||||||||||
| 2007 | 218,963 | 40,673 | 94.0 | 5.8 | ||||||||||||||
| 2008 | 185,816 | 33,199 | 100.8 | 5.6 | ||||||||||||||
| 2009 | 175,230 | 61,136 | 90.3 | 10.9 | ||||||||||||||
| 2010 | 149,214 | 46,389 | 92.2 | 9.8 | ||||||||||||||
| 2011 | 173,684 | 64,544 | 93.3 | 6.0 | ||||||||||||||
| 2012 | 260,806 | 97,061 | 81.6 | 11.0 | ||||||||||||||
| 2013 | 303,131 | 76,461 | 86.7 | 8.8 | ||||||||||||||
| 2014 | 186,315 | 63,293 | 89.3 | 11.5 | ||||||||||||||
| 2015 | 145,772 | 82,242 | 90.4 | 18.3 | ||||||||||||||
| 2016 | 202,727 | 114,760 | 90.1 | 17.4 | ||||||||||||||
| 2017 | 194,143 | 137,339 | 90.5 | 21.2 | ||||||||||||||
| 2018 | 302,509 | 181,831 | 90.1 | 19.6 | ||||||||||||||
| 2019 | 367,137 | 197,701 | 90.0 | 18.6 | ||||||||||||||
| 2020 | 375,419 | 173,684 | 90.0 | 16.0 | ||||||||||||||
| 2021 | 452,703 | 172,432 | 90.0 | 13.2 | ||||||||||||||
Source: GCM, 2022
Notes:
| 1. | Excludes tonnes processed, gold grade and gold ounces produced by the Company from materials sourced from contract miners operating outside of the Providencia, El Silencio and Sandra K mines. |
In addition to the material produced from the operating mines, GCM also process material from small-scale contract miners. Table 6-3 shows the tonnes milled, gold sales in oz, silver sales in oz, realized gold and silver prices and FX rate for the last six years.
|
BP/KD |
May 2022 |
| SRK Consulting (U.S.), Inc. NI 43-101 Technical Report – Segovia 2021 PFS Update |
Page 49 |
Table 6-3: Summary Statistics for Total Production Including Contractors 2017 to 2021
| Description |
2017 | 2018 | 2019 | 2020 | 2021 | |||||||||||||||||
|
Tonnes Milled |
|
|||||||||||||||||||||
| Company operated(1) |
108,486 | 187,128 | 251,263 | 266,894 | 341,747 | |||||||||||||||||
| Contract miners (2) |
169,715 | 183,278 | 200,187 | 201,704 | 214,472 | |||||||||||||||||
| Total |
278,201 | 370,406 | 451,450 | 468,598 | 556,219 | |||||||||||||||||
| Per day |
762 | 1,015 | 1,237 | 1,280 | 1,524 | |||||||||||||||||
|
Gold Sales (oz) |
|
|||||||||||||||||||||
| Company operated(1) |
50,264 | 88,275 | 106,511 | 102,640 | 105,005 | |||||||||||||||||
| Contract miners (2) |
98,248 | 102,140 | 102,078 | 94,420 | 103,357 | |||||||||||||||||
| Total |
148,512 | 190,415 | 208,589 | 197,060 | 207,362 | |||||||||||||||||
| Per day |
407 | 522 | 570 | 540 | 568 | |||||||||||||||||
| Silver Sales (oz) |
126,384 | 158,050 | 183,483 | 183,601 | 235,347 | |||||||||||||||||
|
Realized Prices (Net of Refining Charges) (US$ per oz) |
|
|||||||||||||||||||||
| Gold |
$ | 1,226 | $ | 1,239 | $ | 1,381 | $ | 1,751 | $ | 1,793 | ||||||||||||
| Silver |
$ | 14 | $ | 13 | $ | 15 | $ | 19 | $ | 24 | ||||||||||||
| COP/US$ FX Rate |
2,951 | 2,956 | 3,278 | 3,678 | 3,743 | |||||||||||||||||
Source: GCM, 2021
| (1) | Refer to Table 6-4 |
| (2) | Refer to Table 6-5. . Includes both the contract miner working in Company mines and small-scale contract miners working elsewhere in GCM’s mining title |
Table 6-4 shows the production per mine for Company operated mining areas.
Table 6-4: Summary Statistics for Company-Operated Production 2017 to 2021
| 2017 | 2018 | 2019 | 2020 | 2021 | ||||||||||||||||||
| Milling Days |
365 | 365 | 365 | 366 | 365 | |||||||||||||||||
|
Company-Operated Mining Areas |
|
|||||||||||||||||||||
|
Mina Providencia |
|
|||||||||||||||||||||
| Tonnes milled |
44,795 | 77,907 | 94,459 | 102,759 | 113,810 | |||||||||||||||||
| Head grade (g/t) |
19.6 | 22.6 | 29.5 | 24.3 | 17.7 | |||||||||||||||||
| Recovered gold (oz) |
25,608 | 62,131 | 80,772 | 72,361 | 58,325 | |||||||||||||||||
| Mina Sandra K |
||||||||||||||||||||||
| Tonnes milled |
14,052 | 41,696 | 57,944 | 67,696 | 108,185 | |||||||||||||||||
| Head grade (g/t) |
9.3 | 7 | 7.6 | 7.8 | 7.1 | |||||||||||||||||
| Recovered gold (oz) |
3,786 | 8,436 | 12,801 | 15,227 | 22,172 | |||||||||||||||||
|
Mina Carla |
|
|||||||||||||||||||||
| Tonnes milled |
306 | 7,555 | ||||||||||||||||||||
| Head grade (g/t) |
4.3 | 6.6 | ||||||||||||||||||||
| Recovered gold (oz) |
38 | 1,446 | ||||||||||||||||||||
|
Mina El Silencio |
|
|||||||||||||||||||||
| Tonnes milled |
49,639 | 67,525 | 98,859 | 96,133 | 112,197 | |||||||||||||||||
| Head grade (g/t) |
2.3 | 4.7 | 5.5 | 5.3 | 6.7 | |||||||||||||||||
| Recovered gold (oz) |
3,372 | 9,160 | 15,824 | 14,791 | 21,870 | |||||||||||||||||
| Mill Circuit Inventory Change and Refining Adjustments |
17,482 | 9,770 | -105 | -140 | -327 | |||||||||||||||||
| Polymetallic Plant(1) |
42 | |||||||||||||||||||||
|
Total Company-Operated |
|
|||||||||||||||||||||
| Tonnes milled |
108,486 | 187,128 | 251,263 | 266,894 | 341,747 | |||||||||||||||||
| Tonnes milled per day |
297 | 513 | 688 | 729 | 936 | |||||||||||||||||
| Average mill head grade |
10.4 | 14.7 | 15 | 13.3 | 10.5 | |||||||||||||||||
| Mill Recovery (excluding mill circuit) |
90.60 | % | 90.00 | % | 90.20 | % | 90.00 | % | 90.00 | % | ||||||||||||
| Total Gold Production (oz) |
50,248 | 89,497 | 109,292 | 102,277 | 103,538 | |||||||||||||||||
Source: GCM, 2021
| (1) | Represents estimated payable production from GCM’s polymetallic plant which commenced operation in the fourth quarter of 2021. |
|
BP/KD |
May 2022 |
| SRK Consulting (U.S.), Inc. NI 43-101 Technical Report – Segovia 2021 PFS Update |
Page 50 |
Table 6-5 shows the production per mine for Contract Miner operated mining areas.
Table 6-5: Contract Miners Operated Mining Areas Summary Statistics for 2017 to 2021
| 2017 | 2018 | 2019 | 2020 | 2021 | ||||||||||||||||||
| Milling Days |
365 | 365 | 365 | 366 | 366 | |||||||||||||||||
|
Processed at Maria Dama Plant |
|
|||||||||||||||||||||
|
Mina Providencia |
|
|||||||||||||||||||||
| Tonnes milled |
17,029 | 23,820 | 22,308 | 23,849 | 25,332 | |||||||||||||||||
| Head grade (g/t) |
40 | 31.1 | 27.8 | 19.5 | 18.48 | |||||||||||||||||
| Recovered gold (oz) |
19,802 | 21,506 | 17,938 | 13,458 | 13,549 | |||||||||||||||||
|
Mina Sandra K |
|
|||||||||||||||||||||
| Tonnes milled |
- | - | - | - | - | |||||||||||||||||
| Head grade (g/t) |
- | - | - | - | - | |||||||||||||||||
| Recovered gold (oz) |
- | - | - | - | - | |||||||||||||||||
|
Mina El Silencio |
|
|||||||||||||||||||||
| Tonnes milled |
68,628 | 91,561 | 88,420 | 84,676 | 85,624 | |||||||||||||||||
| Head grade (g/t) |
33.7 | 26.7 | 27.5 | 23.6 | 22.24 | |||||||||||||||||
| Recovered gold (oz) |
67,289 | 70,828 | 70,366 | 57,809 | 55,345 | |||||||||||||||||
|
Other |
|
|||||||||||||||||||||
| Tonnes milled |
84,058 | 67,897 | 89,460 | 93,178 | 103,516 | |||||||||||||||||
| Head grade (g/t) |
4.6 | 5.7 | 6.43 | 8.5 | 11.34 | |||||||||||||||||
| Recovered gold (oz) |
11,254 | 11,219 | 18,491 | 22,817 | 33,957 | |||||||||||||||||
| Total Contract Miners |
||||||||||||||||||||||
| Tonnes milled |
169,715 | 183,278 | 200,187 | 201,704 | 214,472 | |||||||||||||||||
| Tonnes milled per day |
465 | 502 | 548 | 551 | 588 | |||||||||||||||||
| Average mill head grade |
19.9 | 19.5 | 18.1 | 16.1 | 16.57 | |||||||||||||||||
| Mill Recovery |
90.50% | 90.10% | 90.20% | 90.00% | 90.00% | |||||||||||||||||
| Recovered gold (oz) |
98,345 | 103,553 | 104,949 | 94,085 | 102,851 | |||||||||||||||||
|
Processed at Contract Miner Facility 1 |
|
|||||||||||||||||||||
| Total Gold Production (oz) |
66 | - | - | - | - | |||||||||||||||||
Source: GCM, 2021
Notes:
| 1. | Represents gold production from mill feed mined under contract by a third-party and processed at their own plant for delivery directly to the refinery on GCM’ behalf. As such, tonnes, grade and recovery data are not available |
|
BP/KD |
May 2022 |
| SRK Consulting (U.S.), Inc. NI 43-101 Technical Report – Segovia 2021 PFS Update |
Page 51 |
| 7 | Geological Setting and Mineralization |
The Project license boundaries are separated into a number of identified exploration prospects and operating mines, which all form part of the Segovia-Remedios gold district.
| 7.1 | Regional Geology |
The Segovia-Remedios gold district is located in and around the Municipalities of the same names within the Colombian Central Cordillera. This region is dominated by metamorphic and igneous rocks which are broadly orientated N-S. The region also contains minor/localized deposits of unconsolidated alluvial material and the prevailing climatic conditions have resulted in the formation of a thick layer of yellow to brownish saprolite which may exceed 60 m in depth.
The district is hosted by the Segovia Batholith of granodiorite to diorite composition (Gonzalez, 2001; Alvarez et al, 2007) Figure 7-1. The batholith is 10 km wide at Segovia and is elongated N-S. The region is structurally controlled by a number of faults oriented north-south to 350°, most notably the Otú-Pericos, which post-dates the Nus and Bagre faults, and these are all considered to be younger than the Lower Cretaceous and form part of the regional Palestina Fault System that bounds the Segovia Batholith to the east.
The Otú fault is steeply dipping, trends 340° and has a lateral-sinistral displacement of approximately 66 km. It defines the contact between Paleozoic rocks comprising quartz-sericite and graphitic schist, metavolcanic schist of the Cajamarca Group with felsic gneissic intercalations and the Cretaceous Antioquia Batholith and Santa Isabel Stock to the west and the Segovia Batholith, and Cretaceous basic volcanic rocks and sediments and minor Paleozoic gneiss, micaceous schist, quartzite, marble and associated calcareous rocks to the east.
The Bagre fault trends 20° in the south and 10° in the north and has a lateral sinistral displacement interpreted to be more than 50 km. The Nus fault trends 350° and was interpreted to have a steep dip and lateral dextral displacement more than 50 km.
The Segovia Batholith (160 ± 7 Ma K/Ar in hornblende; Feininger et al, 1972) comprises a total of some 5,600 square kilometer (km2) orientated N-S to 30°, and predominantly comprises grey-green medium grained diorite to quartz diorite with local rapakivi textures and variations from quartz monzonite to granodiorite and gabbro (González and Londoño, 2002). It is intruded by dolerite and andesitic dikes along discontinuities that are considered to comprise one of the controls of the gold mineralization.
Faulting and fracturing within the Segovia batholith forms an important control on mineralization and is considered to comprise three sets:
| • | Early compression to produce 40º towards 30º and shallow dipping represented by diorite- andesite dikes and quartz-pyrite veins of 0.15 to 2.60 m in width that have been mined for gold mineralization associated with sphalerite, galena, chalcopyrite, and rare scheelite, pyrrhotite, with variable calcite content |
| • | Clean fractures at 310° to 270º which dip 25° to 30º towards north |
| • | Vertically dipping fractures which trend 325º (González and Londoño, 2002) |
|
BP/KD |
May 2022 |
| SRK Consulting (U.S.), Inc. NI 43-101 Technical Report – Segovia 2021 PFS Update |
Page 52 |
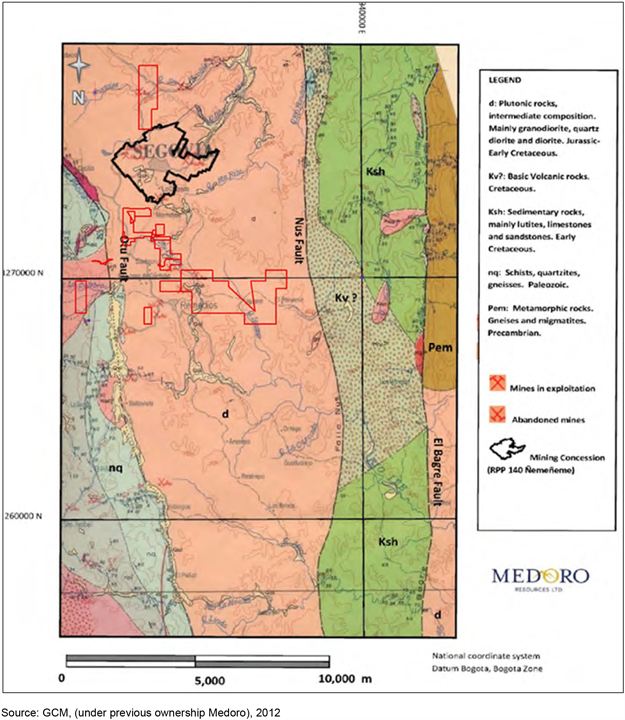
Figure 7-1: Regional Geologic Map Illustrating the Location of the Segovia Mining Concession
| 7.2 | Local Geology |
Within the current RPP property boundaries there are a number of operating mines or projects, with the main areas of interest being:
|
BP/KD |
May 2022 |
| SRK Consulting (U.S.), Inc. NI 43-101 Technical Report – Segovia 2021 PFS Update |
Page 53 |
| • | Providencia |
| • | El Silencio |
| • | Sandra K (including Cogote area) |
| • | Carla |
Each of the mines has been focused on one of the main vein structures, but typically have a number of minor veins or splays which are also known to have geological continuity.
Figure 7-2 and Figure 7-3 show a plan and sections of the main veins, which have been subsequently cut by late stage faulting. The known strike length of the Providencia mineralization is approximately 2 km, and El Silencio 2.7 km, while Sandra K has been explored over 2 km in strike length. With the exception of Las Verticales each of the veins dip on average between 25° and 35°. The current known dip extension on the Providencia mineralization is approximately 1.3 km, at El Silencio it is reported at approximately 2.0 km and Sandra K is approximately 900 m within the license boundary but is known to extend beyond this limit. The Las Verticales Vein System is made up of a series of shear-zones which strike to the northwest and are considered steeply dipping (>80º).
The Carla vein dips at approximately 35° to the east and is offset by three broadly NW/SE trending, steeply dipping faults, which reflect a dominantly strike-slip sinistral sense of movement. The mineralized structure shows a close spatial relationship with mafic dikes, which are interpreted as predating the gold mineralization. The modelled structure at Carla is geologically continuous along strike for approximately 900 m and has a confirmed down dip extent that ranges from 400 m to greater than 750 m, and an average thickness of 0.8 m, reaching over 3.5 m in areas of significant swelling and less than 0.1 m where the vein pinches.
In addition to the main projects at Segovia, a number of exploration targets exist around other historical or small-scale mines within the license. These include, but are not limited to, the following structures:
| • | Vera |
| • | Marmajito |
| • | Manzanillo |
| • | San Nicolas |
| • | Cristales |
| • | Cogote |
| • | Chumeca |
| • | Las Verticales |
|
BP/KD |
May 2022 |
| SRK Consulting (U.S.), Inc. NI 43-101 Technical Report – Segovia 2021 PFS Update |
Page 54 |
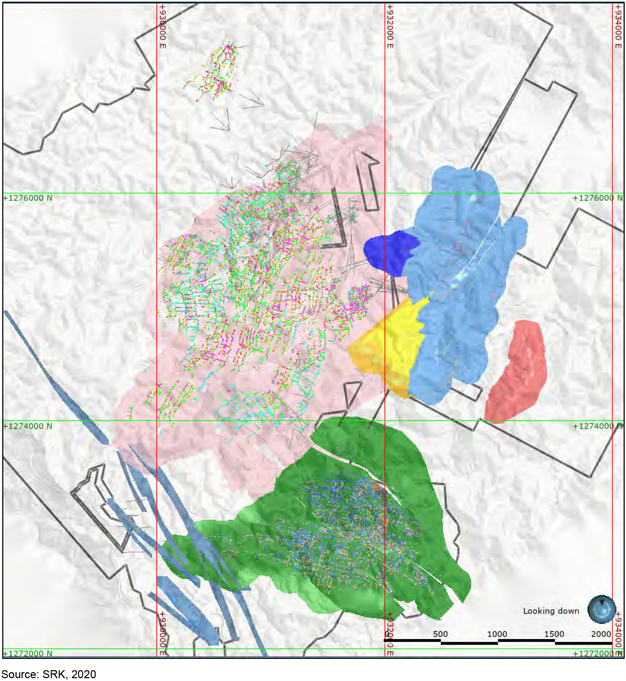
| Figure | 7-2: Schematic Plan Showing the Main Mineralization Zones at Segovia, with Additional Mine Areas Shown in Grey |
|
BP/KD |
May 2022 |
| SRK Consulting (U.S.), Inc. NI 43-101 Technical Report – Segovia 2021 PFS Update |
Page 55 |
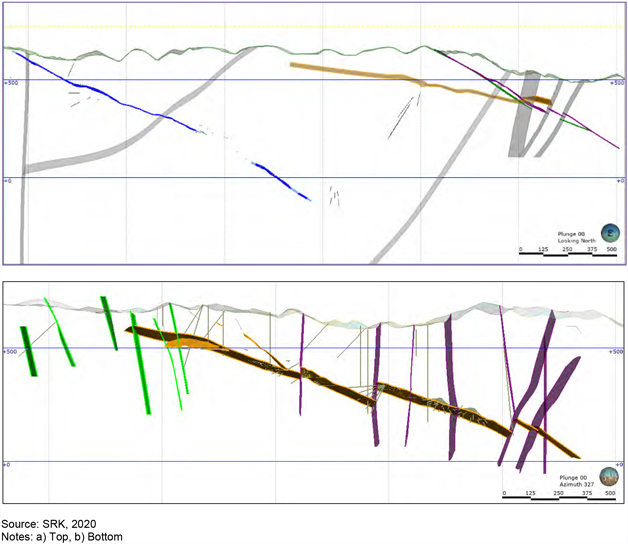
Figure 7-3: Schematic Cross Section (SW-NE) Showing Example of the Mineralized Veins (a) El Silencio and Sandra K (b) Las Verticales and Providencia
| 7.3 | Property Geology |
| 7.3.1 | Segovia RPP License |
The only published description of the geology of Frontino is by Tremlett (1955) who described the structure of the mineralized veins. There are also several unpublished reports for FGM (Bonoli, 1960; Wieselmann & Galay, 1982; Castaño Gallego, 2008; Muñoz, 2008).
The Frontino mines are hosted entirely by granodiorite/granitoid rocks of the Segovia Batholith that has been recorded as being of late Jurassic age (150.25 ± 0.73 Ma) but some dating of rocks in the region suggest it may be much younger and mid- to late-Cretaceous in age (~68.4 ±5.5 Ma to 84.1 ± 5.5 Ma, Echeverry et al., 2009). The granodiorite is coarse grained (about 5 mm), equigranular and fairly dark colored with white plagioclase, quartz and dark green hornblende.
|
BP/KD |
May 2022 |
| SRK Consulting (U.S.), Inc. NI 43-101 Technical Report – Segovia 2021 PFS Update |
Page 56 |
Mineralization
Gold mineralization at Segovia occurs in mesothermal quartz-sulfide veins hosted by diorite to granodiorite rocks of the Segovia Batholith. The well-known, partially exploited veins dip at approximately 30° to the east or north-east. There are also a number of steeply dipping shear-zones hosting quartz veins with a N40°W trend in the western part of the concession, termed the Las Verticales Veins System.
In general, the veins are formed of quartz with minor calcite and coarse-grained sulfides comprising pyrite, galena and sphalerite, and typically show a close spatial relationship with lamprophyre to adakite dikes. Gold and electrum occur as fine grains (less than 20 microns) and visible gold has been noted but is not common in the high-grade shoot sectors of the mines. Native silver has been reported. The wall rock alteration to the veins affects the dikes and the granodiorite in a narrow zone a few meters wide with potassic (biotite), argillic (illite) and propylitic alteration most commonly encountered along with selective mineral replacement by chlorite, epidote, pyrite and calcite.
Gold mineralization is hosted by a series of quartz-sulfide veins. The main sulfides present are pyrite, sphalerite and galena with higher grades seemingly related to high proportions of the latter two. The veins themselves exhibit three main trends:
| • | N-S to NE strike, with a dip of 30° E |
| • | E-W to NW strike, with a dip 30° to N or NE |
| • | NW strike, with a dip of 65-85° NE. These occur on the west side parallel to a NW -trending segment of the Otú Fault |
The low angle veins have formed along thrust faults. These often have thrust duplex structures, resulting in pinching and swelling of the veins; there is no evidence to suggest any systematic change in grade through these pinch and swell structures. The average width of the quartz veins is 0.95 m, with a maximum width of up to 9 m. On occasion, a clear intersection lineation can be observed in the veins plunging toward 60°, sub-parallel to the plunging high-grade mineralization observed in the Mineral Resource modeling suggesting the importance of cross cutting structures.
The quartz veins commonly follow dikes or sills with a width of about 2 to 3 m. These dikes can be found in the hangingwall or the footwall material, both, and in the middle of the mineralized vein. The lamprophyre dikes have very fine phenocrysts of white plagioclase in a fine grained, dark-colored matrix, whereas the adakite dikes show coarse phenocrysts (7 mm) of white plagioclase in a fine grained, light-colored matrix.
| • | There is always a close spatial relationship between the veins and dikes, and the dikes are used as a guide to mineralized structures during exploration drilling or drifting. |
SRK observed different styles of veining within the different mines which included:
| • | White, bull crystalline quartz veins, within limited sulfides and alteration |
| • | Laminated, crack-seal, orogenic-gold quartz veins. These veins have well-developed laminations |
| • | White, crystalline quartz veins, within abundant sulfides, and distinct open-space filling texture |
| • | Brecciation of abundant sulfide mineralization, with white quartz forming the breccia matrix |
SRK understands that the white bull crystalline quartz is not associated with gold. The laminated quartz veins are associated with low-grade (less than 10 g/t) gold, and the quartz-sulfide open spaced filling
|
BP/KD |
May 2022 |
| SRK Consulting (U.S.), Inc. NI 43-101 Technical Report – Segovia 2021 PFS Update |
Page 57 |
veins are associated with high-grade (more than 10 g/t) gold. Examples of the vein styles completed underground are shown in Figure 7-4 and Figure 7-5.
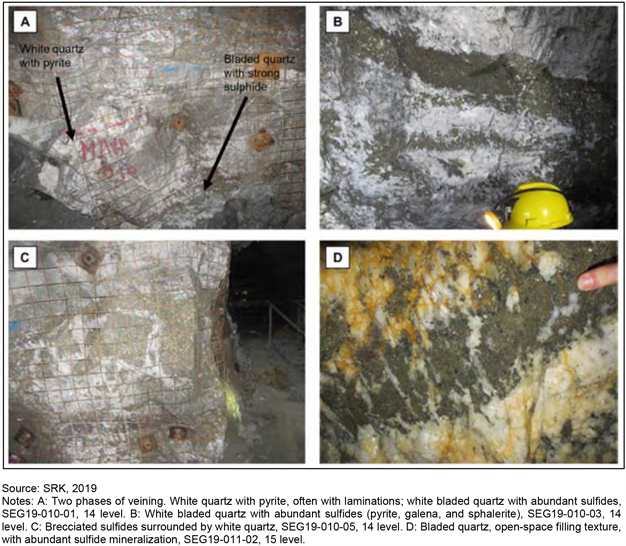
Figure 7-4: Providencia Vein Styles
|
BP/KD |
May 2022 |
| SRK Consulting (U.S.), Inc. NI 43-101 Technical Report – Segovia 2021 PFS Update |
Page 58 |
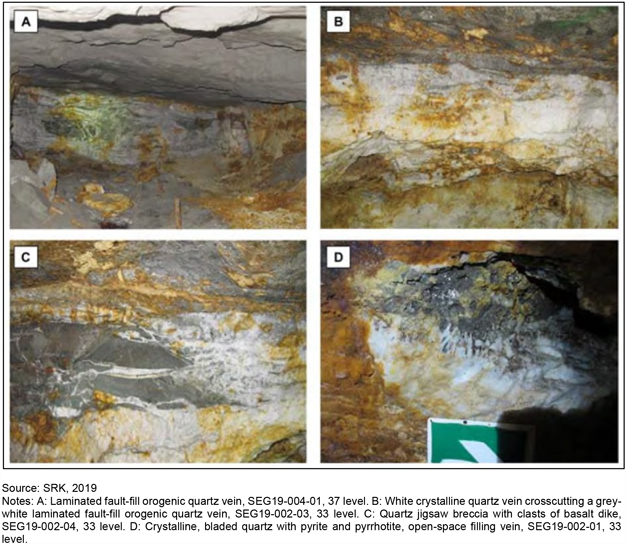
Figure 7-5: Vein Styles in the El Silencio Vein System
The mineralized zone observed in drill core for Providencia is shown in Figure 7-6 and Figure 7-7, as photographed by SRK, and illustrated in Figure 7-8 as procedurally documented by the Company. Figure 7-9 shows the typical thickness of the Providencia and Sandra K veins as exposed in the underground workings. Figure 7-10 presents the well documented relationship between the mineralized vein and lamprophyre dikes as observed underground at El Silencio. Figure 7-10 provides an image of at El Silencio vein (Mine Level 29), and the typical thickness of the mineralized zone is illustrated.
The veins can be offset vertically by more than 50 m by high angle faults which show a reverse sense of displacement. The principal fault trends are NE with dip of 65° to 85° NW, and NW with dip of 85° W to 65° E.
The basic geological history is summarized as follows:
| • | Intrusion of granodiorite |
| • | Development of low angle fault system |
| • | Intrusion of the dikes along the low angle faults |
|
BP/KD |
May 2022 |
| SRK Consulting (U.S.), Inc. NI 43-101 Technical Report – Segovia 2021 PFS Update |
Page 59 |
| • | Formation of quartz-sulfide veins along the low angle faults |
| • | Late stage high angle reverse fault movement causes vertical off-sets of the quartz veins |
The structural data and dating results indicate that the intrusive-related gold-rich, base metal mineralization accompanied early-Tertiary deformation related to oblique accretion of outboard terranes (D2) and was subsequently reactivated during late-Miocene post-mineralization deformation (D3, the event associated with porphyry Au-Cu mineralization in the Cauca belt).
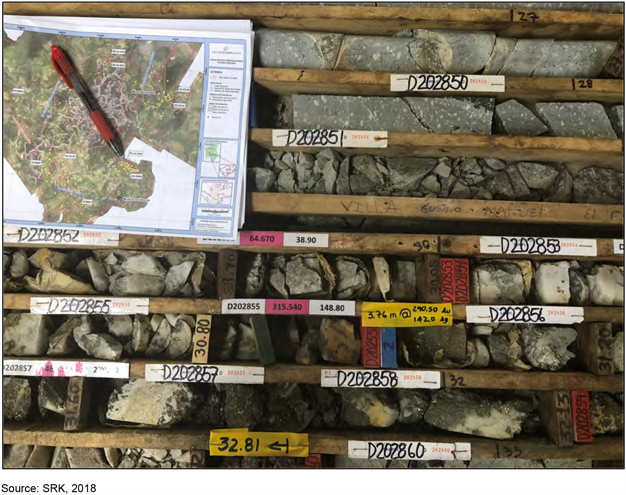
Figure 7-6: Mineralized Zone at Providencia, Intersected in Drillhole PV-IU-054 at 30.47 m, as Observed by SRK (Highest Grade Areas Highlighted by Magenta Tags)
|
BP/KD |
May 2022 |
| SRK Consulting (U.S.), Inc. NI 43-101 Technical Report – Segovia 2021 PFS Update |
Page 60 |
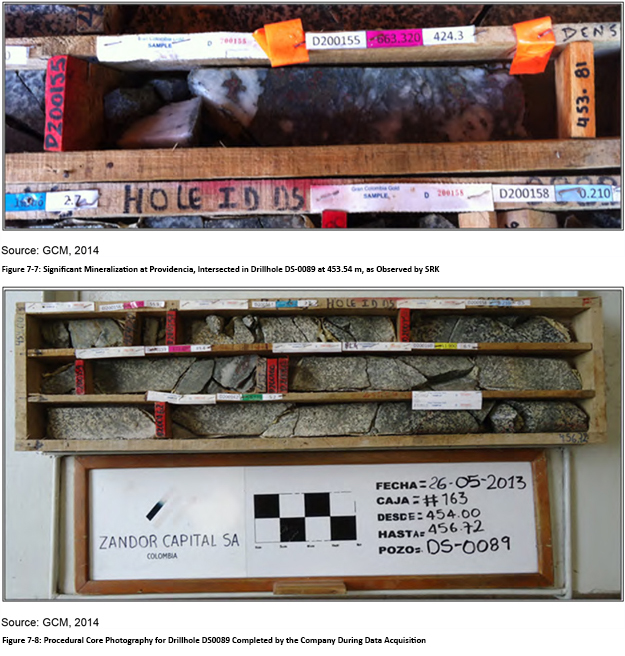
|
BP/KD |
May 2022 |
| SRK Consulting (U.S.), Inc. NI 43-101 Technical Report – Segovia 2021 PFS Update |
Page 61 |
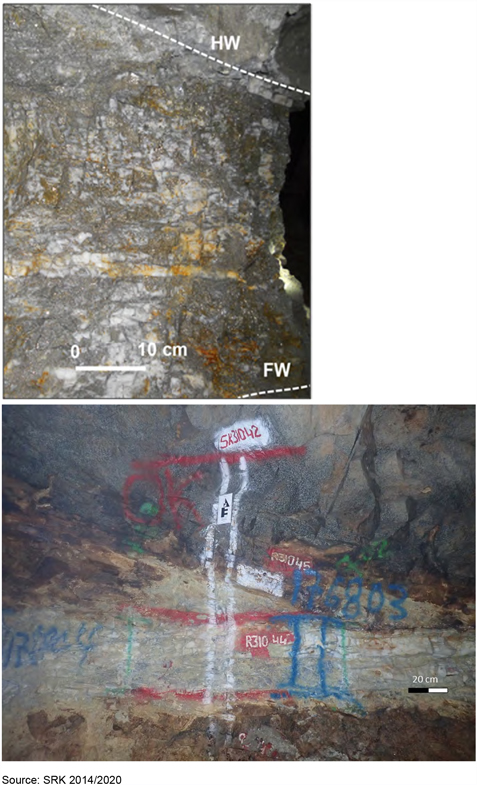
| Figure 7-9: | Typical Thickness of the Providencia (top) and Sandra K (bottom) Veins, as Exposed in Underground Workings |
|
BP/KD |
May 2022 |
| SRK Consulting (U.S.), Inc. NI 43-101 Technical Report – Segovia 2021 PFS Update |
Page 62 |
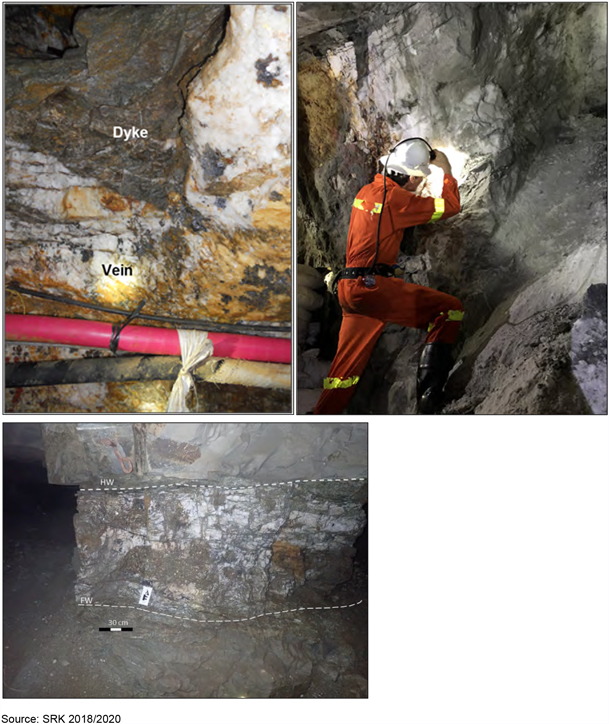
Figure 7-10: Vein Exposures in Underground Workings at El Silencio Showing Relationship with Dikes (left) and Typical Vein Thickness (right)
Structural Analysis
SRK notes that multiple structural geological reviews per mine have been completed on the Segovia project to date. Historically, the review has been completed by GCM’s external structural consultant (Dr. Tony Starling) in 2013. Dr. Starling focused his study on the controls for dike emplacement, phases
|
BP/KD |
May 2022 |
| SRK Consulting (U.S.), Inc. NI 43-101 Technical Report – Segovia 2021 PFS Update |
Page 63 |
of quartz veining and deformation, vein morphology and termination, and kinematic evolution of the veins. A simplified structural model is presented in Figure 7-11.
In the portion of the Segovia-Remedios district covered by the Project, three principal phases of deformation are recognized, comprising:
| • | An early phase of deformation associated with the emplacement of a series of both steep and shallow dipping, pre-mineralization dikes (D1) |
| • | A stage of broadly N-S to NNE-SSW oriented compression (D2) |
| • | A phase of E-W to WNW-ESE oriented post-mineralization compression (D3) |
Dr. Starling concluded that most significantly (from a grade distribution perspective), a review of the kinematic evolution of the veins within the Segovia-Remedios mining district allowed an initial understanding of and interpretation for the orientation of the high-grade shoots reflected in the close spaced sample data of mineralized structures. It is considered that the NE to ENE-trend of the high-grade shoots in the principal veins reflects the NNW-trending compression direction (relating to the activation of NNW-trending Nus fault system around the western margin of the granodiorite batholith) which, while also appearing to represent the main stage of vein formation and mineralization at Providencia, caused strong deformation of the original vein contacts. In consequence, phases of folding, shearing and thrusting occurred along the ENE corridors, orthogonal to the compression direction and hence directing hydrothermal fluid flow to form the main high-grade shoots.
Continued deformation and shearing along the Nus fault system resulted in the development of NNW-trending steep dextral faults that hosted quartz veins, relatively low grade in terms of mineralization, which form the Las Verticales Veins System.
|
BP/KD |
May 2022 |
| SRK Consulting (U.S.), Inc. NI 43-101 Technical Report – Segovia 2021 PFS Update |
Page 64 |
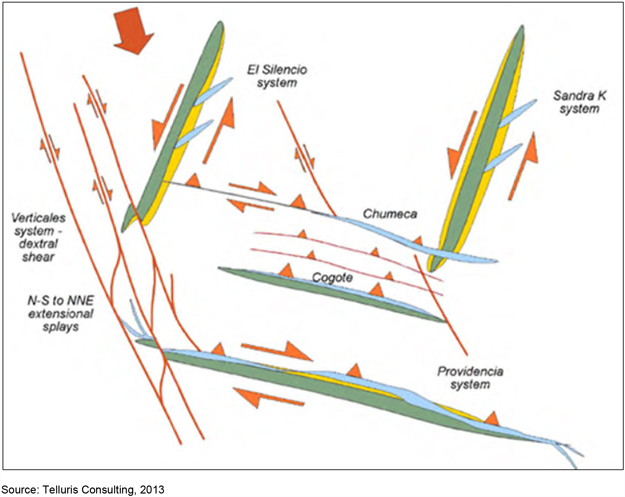
Figure 7-11: Sketch Model for Syn-Mineralization Deformation at Segovia
SRK’s Dr. James Siddorn, PGeo visited the Segovia site between June 10 to 14 2019, to review the structural model prepared by the GCM geological team and to comment on the controls on the mineralization, as summarized below:
Given the large gold endowment, the second, main stage of gold mineralization, associated with quartz veining and sulfides, is the most important for the economic mineralization. This phase of gold mineralization is thought to have formed during D2 north-northwest to south-southeast compression. This produced plunges with subparallel azimuths (east-northeast trending) in the El Silencio and Providencia vein systems. It is expected that this plunge azimuth of the high-grades will be common for all the vein systems at Segovia given the common structural controls during D2 (Figure 7-12).
Dilation (and associated gold mineralization) within the different vein systems is most pronounced when the veins change strike, for example:
| • | Providencia – change in strike to northwest |
| • | El Silencio, Sandra K – change in strike to north-south |
Both changes in orientation are kinematically compatible with the D2 north-northwest compression associated with the second phase of gold mineralization. The best orientation for dilation and increased veining during D2 would be north-northwest trending vein systems, which is important when ranking
|
BP/KD |
May 2022 |
| SRK Consulting (U.S.), Inc. NI 43-101 Technical Report – Segovia 2021 PFS Update |
Page 65 |
targets for future exploration. 2021 drilling confirmed the presence of high grade structures (two veins) within the Vera Project.
The spacing or higher-grade gold mineralization in both El Silencio and Providencia appears to be regular, with higher grade zones every 400 m in El Silencio and every 300 m in Providencia. The Providencia vein system is expected to continue at depth past the GCM mining license boundary, which has been confirmed with drilling in 2021, at depth in Providencia where the projected vein reenters the mining license.
In addition, the plunge of higher-grade gold zones is expected to continue along the east-northeast trend, despite the influence of cross-faulting. The same cross-faults that occur at depth in Providencia also crosscut the El Silencio vein system with limited offset.
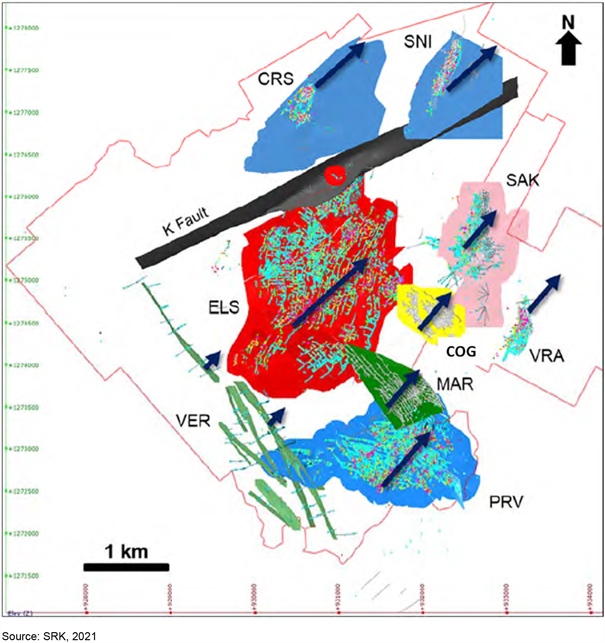
Figure 7-12: Common Plunge of Gold Mineralization in the Segovia District
|
BP/KD |
May 2022 |
| SRK Consulting (U.S.), Inc. NI 43-101 Technical Report – Segovia 2021 PFS Update |
Page 66 |
The Providencia veins discussed in this report have a typical strike of 100° E dipping 30° to the NE and can be traced for around 2 km, while the Las Verticales Veins System strikes more than 3.0 km on a trend of 140° S and dip 75º to the NE. The modeled Sandra K and El Silencio veins show typical strike orientations, dips and trace lengths of 9° N, dip 29° towards E, 1.3 km (Sandra K); and 50°N, dip 27º towards E, 2.2 km (El Silencio).
| 7.3.2 | Vera Project |
During 2021 one of the areas of focus for GCM has been to confirm the mineralization at the Vera Project which is located in to southeast of the Sandra K mine in the hangingwall. Drilling confirmed the presence of extensions to the historical mine in these areas, which strike N5°E dipping 30° to the E and can be traced for around 0.8 km in the historical mine and has been extended with the latest drilling coverage to over 1.1 km in strike.
| 7.3.3 | Mineralization Relationships |
SRK noted through discussions with the GCM geologists, during a review of the drill core at Sandra K, that a relationship exists between the presence of galena and significantly elevated gold grades, most notably in the drilling completed down-dip, towards the east of the mine (Sandra K Fault Block), as illustrated in Figure 7-13. During the site visits of previous years, SRK investigated the relationship by reviewing a range of mineralized cores from Sandra K where galena had been logged (and where galena was absent) in the database. Analysis of the observations suggested that while gold mineralization in general is typically related to the presence of sulfides (most notably pyrite), the most significantly elevated grades in the Sandra K Fault Block are relatively consistently related to the presence of galena, whereby the greater abundance of galena tends to correlate with higher gold and silver grades.
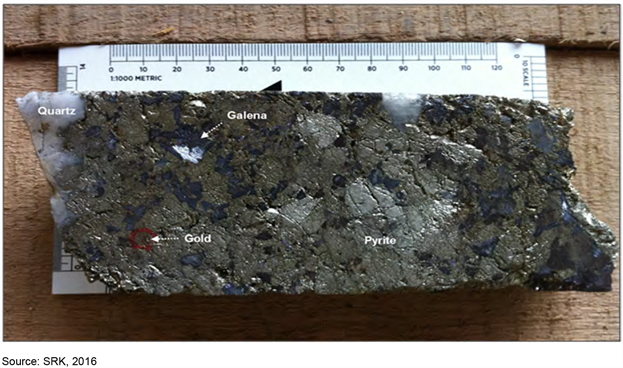
Figure 7-13: Presence of Galena Related to Elevated Gold Grades at Sandra K, in Drillhole DS0130 Showing 30 cm at 311.34 g/t gold (Free Gold Highlighted)
|
BP/KD |
May 2022 |
| SRK Consulting (U.S.), Inc. NI 43-101 Technical Report – Segovia 2021 PFS Update |
Page 67 |
Given the positive outcome from the investigation, SRK has used the geological relationship between galena and gold grade to guide the orientation of a potential high-grade shoot in the Sandra K area during the geological modelling and domaining process.
| 7.3.4 | Carla Licenses |
Most of the Carla Licenses (including the area pertaining to this resource estimate) are hosted entirely by the Segovia Batholith and occupy land to the south of the Segovia Mining Operation.
Rocks of the batholith are largely observed as coarse-grained homogenous granodiorite containing narrow (1 to 2 m) later stage mafic dike. Some occurrences of more aplitic dikes are also noted.
The mineralized quartz-sulfide veins often occupy the same discontinuities as these dikes and form within two main orientation groups including:
| • | Strike 350°- 10° and dip 40° to 55° towards the east |
| • | Strike 50°- 65° and dip 60° to 80° towards the southeast |
The mineralization is considered to be very structurally controlled, with the main mineralized corridor being defined by the Otú fault in the west and the Nus fault in the east.
The attitude of some the veins suggest that, while a structural corridor is considered to have a sinistral movement, there has also been reactivation with an extensional/ dextral stress environment taking precedence during mineralization.
Historical exploration and mining have suggested that the ground containing the line of intersection of these two dominant vein orientations can host significant higher-grade zones within the plane of the veins. The line of intersection is a suggested plunge at 30° to 150° (SE). While no such arrangement has been noted from the Carla Licenses to date, this hypothesis exists as a notable exploration target.
Gold mineralization at the Carla Project is hosted in quartz veins that vary from a few cm to more than 3 m in thickness, with an average of 1 m and with dips varying from 30° to vertical. The host rock is largely granodiorite with occasional variations of diorite, quartz diorite and tonalite. The gangue mineral of the veins is quartz with subordinate calcite recorded in a number of localities. Accessory minerals present are pyrite, sphalerite, galena, chalcopyrite, bornite, magnetite, and traces of molybdenite. Pyrite is the most dominant sulfide.
Many of the veins exhibit an epidote/ chlorite alteration halo. This is particularly evident within the Carla Project mine exploration adit.
SRK Exploration Services Ltd (2010) has detailed at least four phases of fluid movement during the mineralization of the Carla Project. The petrogenesis of the auriferous veins is considered as follows:
| • | Precipitation of quartz with minor disseminated pyrite |
| • | Influx of massive sulfide bearing fluids overprinting earlier quartz |
| • | Deposition of gold along with secondary pyrite and galena |
| • | Late stage minor epithermal mineralization possibly remobilizing gold mineralization |
The mineralized structure located at the Carla Project mine discussed in this report has a typical strike of 2° N dipping 36° to the E and can be traced for around 900 m. Figure 7-14 provides an image of the typical form of the sulfide rich mineralized quartz vein observed in the GCM exploration adit at the Carla Project.
|
BP/KD |
May 2022 |
| SRK Consulting (U.S.), Inc. NI 43-101 Technical Report – Segovia 2021 PFS Update |
Page 68 |
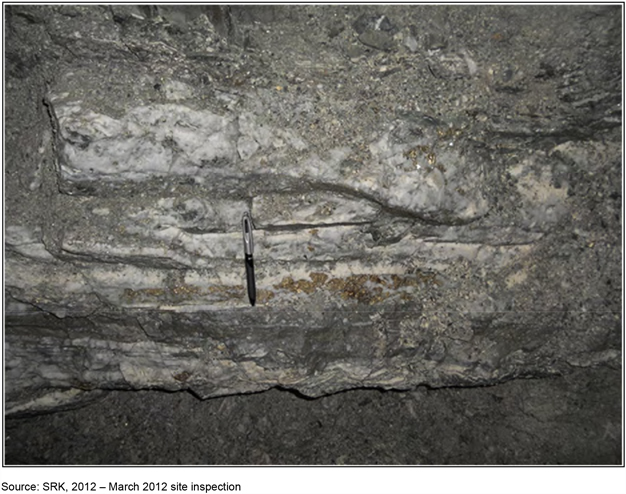
Figure 7-14: Mineralized Quartz Vein Within the GCM Exploration Adit
| 7.4 | Significant Mineralized Zones |
The modeled vein at Providencia is geologically continuous along strike for approximately 2 km and has a confirmed down dip extent that ranges from 690 m to greater than 1.3 km, and an average thickness of 0.9 m, reaching over 5 m in areas of significant swelling or thrust duplex and less than 0.1 m where the vein pinches. Locally, the Providencia vein displays significant disruption by faulting, pinch and swell structures, fault brecciation and fault gouge.
The sample data for Sandra K and El Silencio confirms geological continuity along strike for 1.2 km and 2.2 km, respectively, and indicates down-dip extents of up to 900 m, with thicknesses and structural complexities that are comparable to the Providencia vein. Although currently less well defined by sampling, the Las Verticales Veins System appears geologically continuous along strike for up to 1.3 km, and has an average thickness of 0.5 m, reaching over 2 m in areas of vein swelling. The drilling coverage at Vera confirms strike length of the structures for over 1.1 km, with an average thickness of 1.8 m.
Continual exploration and underground exploration at El Silencio have confirmed extensions to the mineralization at depth, namely within the Veta National (NAL) area of the mine which forms the lowest
|
BP/KD |
May 2022 |
| SRK Consulting (U.S.), Inc. NI 43-101 Technical Report – Segovia 2021 PFS Update |
Page 69 |
point of the current mine. SRK completed a visit during the site inspection to confirm the presence and geological conditions within this area of the mine.
Additional areas of higher grades have also been identified within the northern portions of the El Silencio mine with the main Veta Manto vein (VEM), plus confirmation of the high grades at depth within Providencia, which included definition of an additional high-grade area at the western edge of the development at depth, continual drilling down-dip of to extend this zone should be considered a priority for 2021.
Gold mineralization at the Carla Project occurs in mesothermal quartz-sulfide veins hosted by granodiorites of the Segovia Batholith. The Carla vein dips at approximately 35° to the east and is offset by three broadly NW-SE trending, steeply dipping faults, which reflect a dominantly strike-slip sinistral sense of movement. The mineralized structure shows a close spatial relationship with mafic dikes, which are interpreted as pre-dating the gold mineralization.
The modeled structure at Carla is geologically continuous along strike for approximately 900 m and has a confirmed down dip extent that ranges from 400 m to greater than 750 m, and an average thickness of 0.8 m, reaching over 3.5 m in areas of significant swelling and less than 0.1 m where the vein pinches. Mining and channel sampling during 2021 confirmed the presence of a hangingwall structure which contained higher grades (channel sampling), than previously estimated. Continuation of the channel sampling program is recommended.
|
BP/KD |
May 2022 |
| SRK Consulting (U.S.), Inc. NI 43-101 Technical Report – Segovia 2021 PFS Update |
Page 70 |
| 8 | Deposit Type |
| 8.1 | Mineral Deposit |
Gold mineralization at Segovia occurs in mesothermal quartz-sulfide veins hosted by a batholith. They have been classified as “Oxidized Pluton-Related Gold Deposits” (Sillitoe, 2008), are thought to have formed after the cooling of the batholith and may have a genetic relationship with the batholith as well as with the regional stress regime related to the Otú fault.
The deposit bears a strong resemblance to the Pataz deposits in northern Peru. The Pataz deposits have been described as orogenic gold deposits or mesothermal gold deposits, and gold mineralization has been linked to a large-scale thermal event that occurred in a thickened collisional belt undergoing uplift tectonics, rather than related to magmatism (Haeberlin, 2002; Haeberlin et al, 2002, 2004).
Mineralization at Pataz occurs over a distance of 160 km in the Pataz Batholith. This is of granodiorite to monzonite composition of calc-alkaline affinity and Carboniferous age (330 to 327 Ma). Mineralization is dated at 314 to 312 Ma, some 18 to 15 Ma younger than the batholith. The main similarities with Frontino are mesothermal gold mineralization in quartz-sulfide veins with a low dip of 20° to 45° to the east, and the predominant N to NW-strike. The main differences are the older age of Pataz, the stronger wall-rock alteration at Pataz, and the absence of pre-mineralization basic dike along the vein structures.
| 8.2 | Geological Model |
The geological model described above, for the Segovia deposit is well-understood and has been verified through multiple expert opinions as well as a history of mining. SRK is of the opinion that the model is appropriate and will serve for mining purposes going forward.
At present, the geological models have been treated on a mine by mine basis as data has been collected and verified. SRK considered there to be additional benefit from generating a property scale model of existing mines and fault networks along with known mineralized structures to identify potential near mine exploration targets. GCM has started this work in 2019 on generating the property scale geological model, which continued into 2020 and 2021. The process has been used to prioritize historical mines with the potential to add Mineral Resources to the current overall Project and represent new targets for further extensions and exploration growth. This work has continued via the capture of historical databases which are prioritized for further validation sampling, and the 2022 exploration program.
SRK’s mine license scale review considered the structural components for the vein locations but also favorable structural settings for the higher-grade mineralization shoots, noted within the current mines. Additional exploration drilling will be required to identify additional material.
|
BP/KD |
May 2022 |
| SRK Consulting (U.S.), Inc. NI 43-101 Technical Report – Segovia 2021 PFS Update |
Page 71 |
| 9 | Exploration |
This section summarizes the relevant exploration work completed at the Segovia project to date.
| 9.1 | Historical Exploration |
It is understood that the previous owners of the Segovia Project (FGM) did not complete any regional surface geological mapping, exploration geochemistry, nor surface or airborne geophysics. Historical exploration data is mainly limited to underground mapping and sampling and drilling for resource development.
The historical underground channel sampling database made available to SRK consists of more than 100,000 samples and is understood to incorporate data from the past 30 years. The database provided is largely restricted to vein samples only, with the hangingwall, footwall and face “composite” data stored separately.
Channel sampling was carried out by a pair of samplers instructed by the mine geologist. Samples are taken vertically across the vein at approximately 2 m intervals and extracted from both walls of the underground drive, in raises and from a proportion of the stoped areas. Samples were taken from the wall of the drive in a continuous channel by hand using a lump hammer or chisel. The sample was collected from a plastic sheet inside a wide bucket, and the sample sheet was replaced every few samples. The sample lengths/widths are then measured vertically and are therefore not true thicknesses.
The sample was quartered by hand by separating the sample into quarters and discarding opposite quarters. Some of the larger pieces of rock are broken by a hammer during the quartering process. The sample, averaging around 1 to 2 kg is then placed into a small plastic bag with the sample number torn from a book of consecutively numbered assay tags where location and type are recorded. No geological description was made. The mine samplers filled out a daily sample sheet with sample number, sample location and sample type.
Sample locations were limited to an X and Y coordinate, plotted in reference to mine survey pegs (with X, Y and Z data) which are located in the roof of the underground development. Survey and sample data were plotted in 2D using AutoCAD and plotted onto development plans. Since 2014, GCM has undertaken programs to increase the confidence in surveying of the underground workings and development. The improvement in the spatial location of the workings has enabled GCM and SRK to further increase the confidence in the sampling locations. SRK comments that while this work has been completed in proximity to the current workings, older areas of the mines exist where further improvements can be made. SRK recommends GCM continue to validate workings via survey, and correct the elevations of the sample database, on an on-going basis.
Given the presence of thrust displacements along a number of the fault planes at Providencia, there exists in the database a proportion of overlapping data that cannot be split into upper or lower displacement surfaces as a result of a lack of elevation data. Where this occurs, GCM has completed a review of the original sample locations underground to verify the location and adjusted the elevation accordingly. Over numerous years, SRK has completed a number of technical meetings at GCM offices in Medellín and SRK offices in Denver to review the geological database, as part of the ongoing validation phases.
|
BP/KD |
May 2022 |
| SRK Consulting (U.S.), Inc. NI 43-101 Technical Report – Segovia 2021 PFS Update |
Page 72 |
In 2020, GCM completed extensive work on capturing and validating the historical database from the Cogote Mine which is in close proximity to the current Sandra K operation. The results of the data capture and original development plans have been presented to SRK for review. Drilling down dip of these structures has confirmed the presence of the vein to enable SRK to infer the geological continuity. Figure 9-1 shows the resulting digitalization of the historical underground workings and samples in the Patio and Julio veins (Cogote) completed by GCM. SRK reviewed the location of the historical samples and the grades in relation with the historical maps. In 2021 additional review and validation of the Cogote information was performed by the exploration team of GCM the historic information (historical reports, paper maps, etc.). The database was generated for the Cogote mine (Veins Patio [PAT] and Julio [JUL]) which included the transformation of the information to the current coordinate system and the units of length and weight to the metric system. GCM updated the interpretation and the geological model. Further validation sampling and drilling will be required to increase the confidence in these areas to a level sufficient to declared Indicated Mineral Resources.
|
BP/KD |
May 2022 |
| SRK Consulting (U.S.), Inc. NI 43-101 Technical Report – Segovia 2021 PFS Update |
Page 73 |
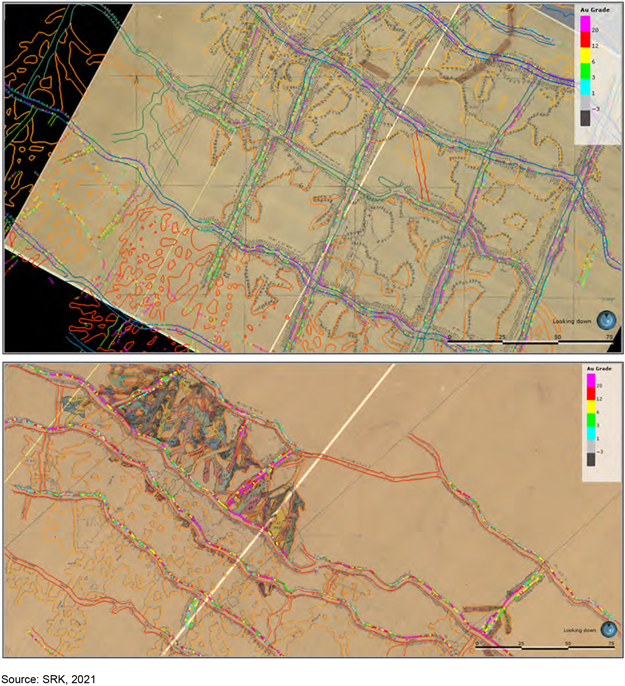
| Figure 9-1: | Example of UG Workings Digitalization and Location Validation Exercised by GCM of Historical Sampling Based on Historical Maps for Patio (top) and Julio Veins (bottom) of Cogote Mine |
| 9.2 | GCM Exploration Work |
GCM exploration staff commenced an underground channel sampling program at the mines, to verify historical underground data and increase the proportion of higher confidence quality control check samples in the exploration database.
|
BP/KD |
May 2022 |
| SRK Consulting (U.S.), Inc. NI 43-101 Technical Report – Segovia 2021 PFS Update |
Page 74 |
Sampling has been in underground development drives; development raises and from historical pillars. Samples are taken at 5 m intervals (where possible) from the vein, hangingwall and footwall from both sides of the drive depending on the exposure of the vein (complete exposure). GCM has continued to complete on-going validation on the locations of the historical sampling, namely related to the elevation.
| 9.3 | Sampling Methods and Sample Quality |
The sampling methodology used has changed over time, but in general remains consistent in terms of sample volume and methodology of collection. During the 2022 site visit, discussions with GCM geologist indicated that the sampling protocols remain consistent with previous years. SRK did an underground visit to El Silencio mine and reviewed the underground channel sampling execution and found that the sampling is in general consistent with previous years.
Sampling is completed by GCM employees who, prior to conducting any sampling, complete a safety check of any working area, with the back “barred” for any potential risk of rock falls completed. Sampling is completed from floor to ceiling, avoiding contamination of the sample with the fall of splinters of rock from upper sections.
The samples are taken with maximum lengths of 1 m, bearing in mind the following guidelines:
| • | Minimum length of sampling is 0.3 m; if the sampled structure has a smaller length the channel sample is taken with the backing material to complete the minimum length. |
| • | Greater than 1 m structures are split in two or more samples, in an equitable manner and always following the principle of optimization of resources. |
| • | In each sampling point shall be taken as far as possible three samples, thus distributed: footwall, mineralized structure and hangingwall. In areas where full exposure is not possible, this is noted on the sampling sheet. |
Prior to collection of the sample, the working face is cleaned with water and a metallic brush and if necessary, with hammer and chisel to remove any loose or weathered material which may result in poor sampling.
The initial process (which is still continued in some portions of the contractor mining) consists of marking and subsequently sampling a vertical reference line (spray paint) down and across the hangingwall, quartz vein and footwall. Samples were taken using a chisel (Figure 9-3), from the bottom of the face up to avoid contamination and collected on to a plastic sheet at the bottom of the face. Where full exposure of the vein exists, the sampling sequence involves taking the lower footwall (RI), then the structure (VT or ZC) and finally the hangingwall (RS).
In all sampling completed by the Company, a clean plastic sheet is used to collect each sample to prevent contamination. GCM guidelines state a channel of 100 cm by 5 cm by 3 cm, should be taken, with a density of rock of 2.7 grams per cubic meter (g/cm3), a desired weight of close to 4 kg is collected. In cases where the vein is less than 50 cm, the channel is extended in the hangingwall and footwall homogeneously until a minimum total weight of approximately 4 kg is obtained.
Each sample weighs approximately 2 kg, the depth of the channel should be varied for those samples of low thickness. GCM has reported subsequently that the sample depth has been increased to obtain the desired amount of sample which is required by the laboratory. GCM has not employed any subsampling routines within the mine as testwork indicates that this results in large sampling errors.
|
BP/KD |
May 2022 |
| SRK Consulting (U.S.), Inc. NI 43-101 Technical Report – Segovia 2021 PFS Update |
Page 75 |
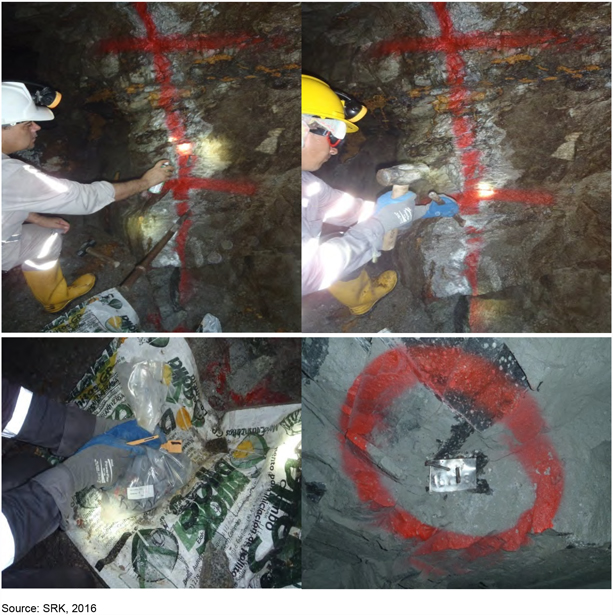
Figure 9-2: GCM Sampling Procedures 2012 to 2016
The collected samples are labelled with sample tickets attached to the bag (Figure 9-2). The bagged samples are then taken to surface where they were checked and re-labelled if required prior to dispatch to SGS Colombia S.A Medellín for sample preparation and Fire Assay. Sample numbers, lengths and locations in reference to survey pegs are logged on to sample sheets which are subsequently typed into Excel in the Exploration Department and uploaded to the central database. The location of the samples has been derived for the majority of the database measured from the nearest survey point (Figure 9-2). The channel samples collected by the mine geology team are submitted to the internal laboratory.
To define the coordinates of each sample the Total Station survey is used to define the start point of the sample in the floor and the end point of each sample. The equipment calculates the azimuth and dip of each sample. If the equipment is not available, tape and compass are used to locate the lower
|
BP/KD |
May 2022 |
| SRK Consulting (U.S.), Inc. NI 43-101 Technical Report – Segovia 2021 PFS Update |
Page 76 |
point of the channel and to measure the azimuth, dip and length of each sample. The coordinates of the samples are calculated using excel or AutoCAD. For artisanal workings the tunnel entry is surveyed using GPS and using this point as reference, the tunnels are measured using tape and compass, including the location of the samples collected, which includes some error in the location of the samples.
For every 50 samples, a hand specimen is collected for density measurements, representing different lithologies present in the work area. It is best practice that these samples are considered fresh rock and have little fracturing, so the geologist retain a length as close to 10 cm in its greatest length as possible, and do not suffer loss of fragments to be subjected to the measurement process for density. Density measurements are completed at surface using industry standard weight in air versus weight in water methodologies.
The final stage of the process is to mark the wall with all sample numbers, for any surveying requirements and for future reference which is then photographed for a digital archive and for sampling quality control (Figure 9-3).
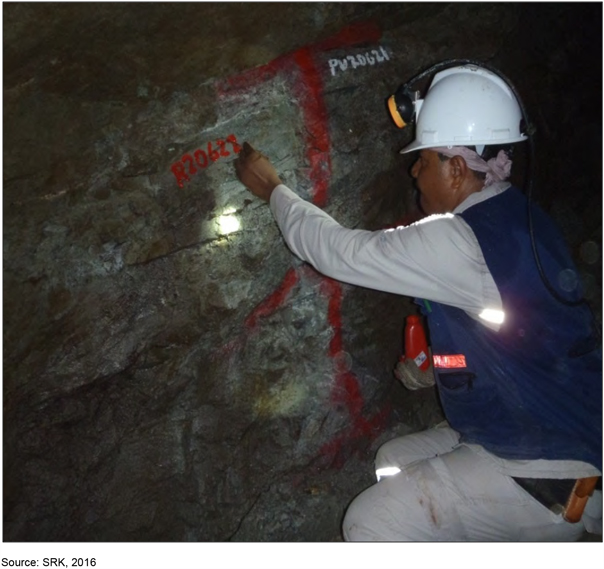
Figure 9-3: Channel Sampling Final Markups by Company During Pre-2016 Sampling Program
|
BP/KD |
May 2022 |
| SRK Consulting (U.S.), Inc. NI 43-101 Technical Report – Segovia 2021 PFS Update |
Page 77 |
In 2016 and 2018, Mr. Parsons completed site inspections with the intent to review the sampling procedures at Segovia. SRK visited Providencia during routine sampling by GCM at the base of the mine. An example channel sample, completed by the company in 2016, is shown in Figure 9.9-5. During the review, SRK noted the procedures were followed in terms of safety, mark-up, logging, but noted that the chip sampling was not always fully representative of the full width of the marked samples.. In 2022 SRK visited the Silencio mine and observed that the channel sampling procedures completed by the mine geology department are in line with the established protocols, although as it has been recommended by SRK previously, GCM should continue using the diamond as much as possible. GCM mentioned that sometimes it is not possible to use the diamond saw due to problems with the machinery and accessibility to the stopes.
The revised procedure includes marking and subsequently sampling a vertical reference line (spray paint) down across the hangingwall, quartz vein and footwall (Figure 9.9-5). A diamond saw is then used to cut the channel initially along the edges and then at regular intervals (5 cm). Samples were then extracted using a chisel, from the bottom of the face to the top, and are collected on to a plastic sheet at the bottom of the face. SRK considers the revised process to be in line with generally accepted industry best practice for sampling this style of mineralization.
|
BP/KD |
May 2022 |
| SRK Consulting (U.S.), Inc. NI 43-101 Technical Report – Segovia 2021 PFS Update |
Page 78 |
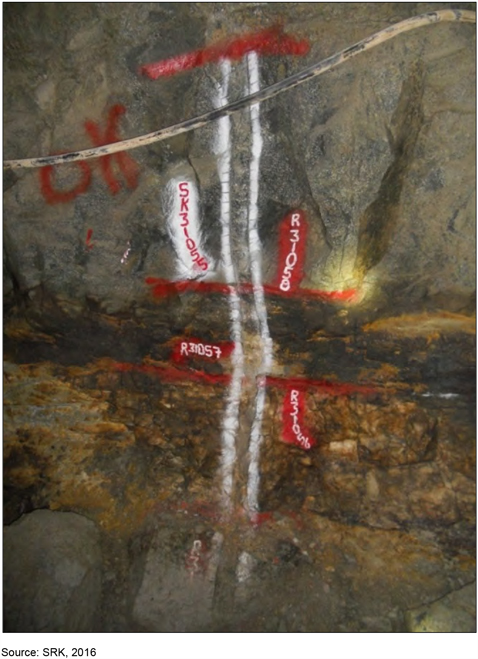
Figure 9-4: Channel Sampling Completed by GCM During 2016 Sampling Program
As part of the QA/QC protocols, a field duplicate is collected every 50 samples and consists of a new sample taken in the same position of the original sample according to the criteria of the geologist. Additionally, certified reference materials and blanks are inserted in the samples flow to check precision and contamination.
The underground mines (Providencia, Sandra K, Carla and El Silencio), the channel sample database represents the accumulation of grade control data for the underground mines for approximately the past 30 years. In total, 168,239 channel samples, totaling 156,721 m, are included in the GCM database.
|
BP/KD |
May 2022 |
| SRK Consulting (U.S.), Inc. NI 43-101 Technical Report – Segovia 2021 PFS Update |
Page 79 |
| 9.4 | Significant Results and Interpretation |
SRK has noted during the underground visits that in some cases sampling has been taken where the vein intersection is incomplete (such that the vein goes into the floor or roof of the drive). SRK highlighted the potential issues with how this material may be treated in the modeling (as the process uses the contacts as hangingwall and footwall contact points) and recommended a review of the sampling cards (Figure 9.9-6) which highlight under the “Observations” section if the vein is located in the roof or the floor (“veta sigue en el piso”).
SRK recommended that GCM’ review focus on samples in the database where the first or last sample are logged as vein. Using this sample list, the geologist should revisit the sampling cards to flag any samples which are not representative of the full vein width and import these flags to the database. These samples can then be highlighted during the geological modeling process to ignore either the hangingwall or footwall points to ensure false pinches out do not occur. SRK further recommends that this process be implemented on all new sampling to reduce any time loss in future updates to the model.
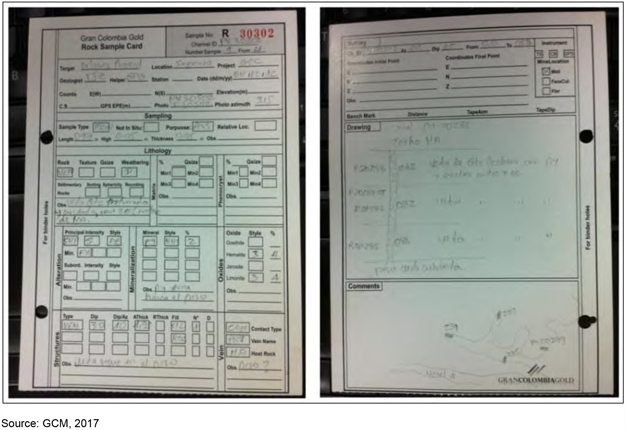
| Figure 9.9-5: | Logging Sheets Used for the Company Channel Sampling Program |
The data sourced from four companies over the history of the database are summarized in Table 9-1 while mine sampling data sources by location are presented in Figure 9.9-6 to Figure 9-9.
|
BP/KD |
May 2022 |
| SRK Consulting (U.S.), Inc. NI 43-101 Technical Report – Segovia 2021 PFS Update |
Page 80 |
| Table 9-1: | Summary of Sampling Sources in Exploration Database |
| Company | Description | |||
| FGM | Frontino Gold Mine | |||
| MRC | Medoro Resources | |||
| GEM | Mine Samples (Zandor) assayed at Mine Laboratory | |||
| GEX | Gran Colombia Gold Exploration (Zandor) assayed at SGS (Colombia) | |||
| GPE | Gran Colombia (Small Mining) assayed at SGS (Colombia) | |||
| QUIN | Quintana Sampling on adjacent license shared under agreement |
Source: SRK, 2021
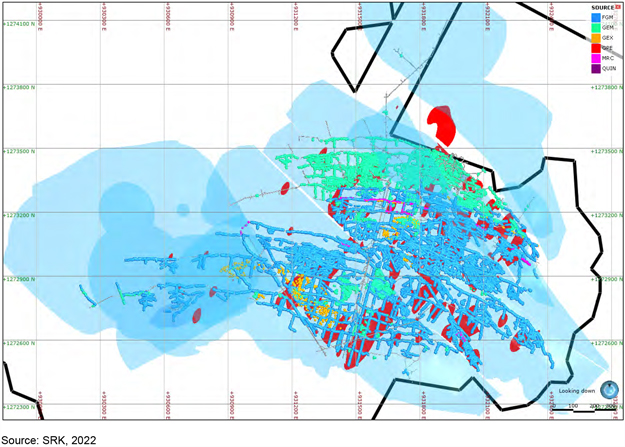
| Figure 9.9-6: | Mine Sampling Split by Data Source for Providencia |
|
BP/KD |
May 2022 |
| SRK Consulting (U.S.), Inc. NI 43-101 Technical Report – Segovia 2021 PFS Update |
Page 81 |
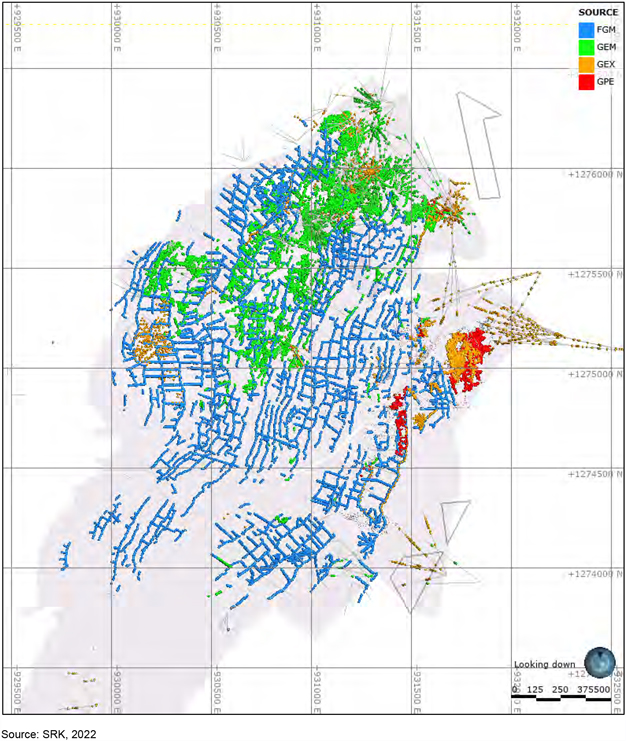
| Figure 9-7: | Mine Sampling Split by Data Source for El Silencio |
|
BP/KD |
May 2022 |
| SRK Consulting (U.S.), Inc. NI 43-101 Technical Report – Segovia 2021 PFS Update |
Page 82 |
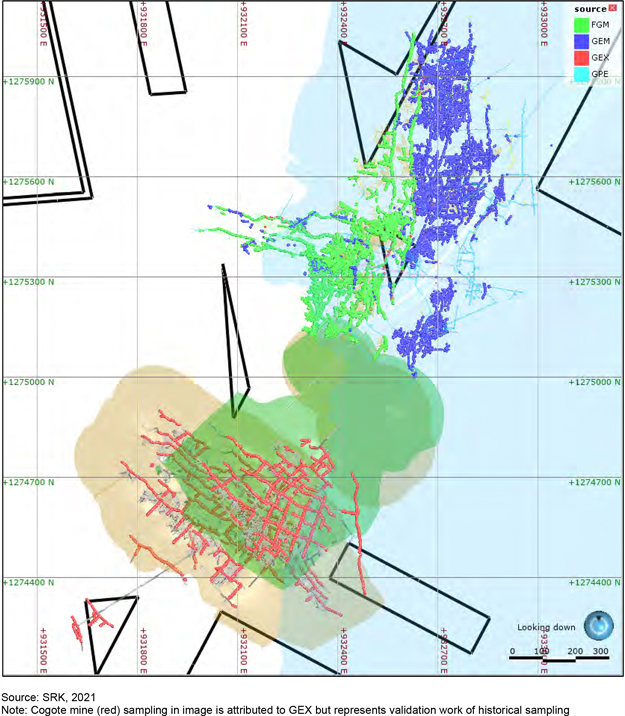
Figure 9.9-8: Mine Sampling Split by Data Source for Sandra K
|
BP/KD |
May 2022 |
| SRK Consulting (U.S.), Inc. NI 43-101 Technical Report – Segovia 2021 PFS Update |
Page 83 |
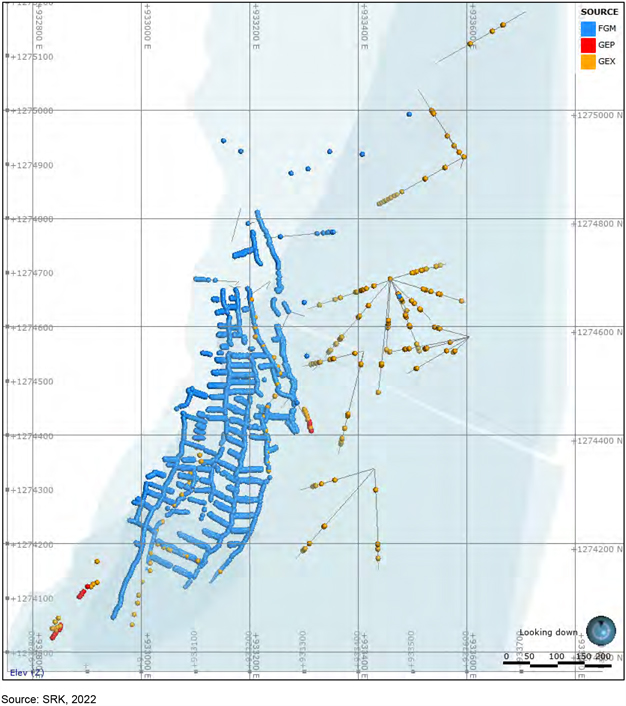
| Figure 9-9: | Mine Sampling Split by Data Source for Vera |
Overall, it is the QP’s opinion that the underground sampling methodology has not introduced any significant bias and thus is reasonably reliable for the purposes of the data verification program. Areas which are reliant on historical sampling such as the Cogote and Vera mines and portions of El Silencio are limited in terms of lower levels of confidence.
|
BP/KD |
May 2022 |
| SRK Consulting (U.S.), Inc. NI 43-101 Technical Report – Segovia 2021 PFS Update |
Page 84 |
| 10 | Drilling |
| 10.1 | Segovia |
Historic diamond drilling on the property undertaken by previous owners consisted of surface drilling oriented broadly perpendicular to the target veins and also limited underground drilling completed from crosscuts and platforms on the main levels of the existing mines. GCM has incorporated all the historical drilling into the database, but a limited number of the historical holes have only been assigned lithology and assay information is not included due to validation issues.
The majority of the historical diamond drilling was carried out by FGM for resource development at the operating mines within the RPP title and were drilled vertically from surface. Limited diamond drilling was carried out for exploration to test extensions to known veins. The main success of exploration drilling was the definition and subsequent development of the Sandra K Mine, located northeast of the Providencia Mine.
Historical surface drilling was undertaken using a Diamec 262D rig (owned by FGM) which had a 1,000 m depth capacity. The core diameters used were 36 mm (BQ) and 46 mm (NQ). The drill used conventional diamond drilling rather than wireline, resulting in the pulling of drill rods to recover the core barrel. Core recovery was not reported to have been an issue at the time, but SRK has not been able to verify this statement. Relatively limited background procedural information has been made available to SRK in terms of the historic drilling.
Drilling programs completed by GCM are better documented and involved a combination of diamond holes collared at surface, which intersected the veins largely from the northeast and southwest orientations, and via underground drilling.
The drilling for 2011 was performed by six Longyear rigs operated by PERFOTEC Drilling and managed by the Company’s geological team. SRK initially observed drilling during its site visit in November 2011. The 2012/2013 drilling programs were completed by two drilling contractors:
| • | AKD – AK Drilling International (Peruvian based drilling company) |
| • | ENE – Energold Drilling |
Drilling was predominately performed with the use of a double tube with casing progressed to around 12 m from surface. On average, HQ (64 mm) drilling continued to around the 200-m depth at which point they were cased-off and continued with NQ rods until their final depth.
SRK notes that core recovery is reported to be good despite the fact that triple tube drilling was not in use, although recoveries were seen to drop towards and at vein intersections. During later drilling programs, contractors used triple tube methods to improve core recovery. The change improved the overall core recoveries within the database such that the average over the mineralized zone is >90%.
Core was produced in 3 m core runs with recovered core lengths measured while encased in the barrel to ensure accurate measurement of crushed material, and then placed by hand into an open V-rail or drain pipe, where the core was re-orientated if required before being transported to the drill site geologist. This geologist then inspected the core before placing the core into numbered aluminum core boxes. Cut wooden blocks were used to record core depths.
|
BP/KD |
May 2022 |
| SRK Consulting (U.S.), Inc. NI 43-101 Technical Report – Segovia 2021 PFS Update |
Page 85 |
Prior to August 15, 2012, samples were sent for preparation to the SGS (Colombia) facility in Medellín, and fire assays for gold were conducted by SGS in Peru. Since August 15, 2012, all sample preparation and fire assays have been completed at the upgraded SGS (Colombia) facility in Medellín.
In 2015, the Company began completing infill drilling programs at Providencia using underground drill rigs (Figure 10.1, Boart Longyear LM30), with the aim of infill drilling via fan drilling to approximately 20 m x 20 m spacing. Drilling is completed using industry standard underground rigs using NQ core diameter which is consistent with the surface drilling.
During 2016 to March 2017, GCM completed an infill program designed to confirm and increase the confidence in the grade distribution of the eastern fault block at the Sandra K Mine. All diamond core was logged and sent for preparation and fire assay to the SGS (Colombia) facility in Medellín.
In 2016, an additional, 11 underground holes were drilled in the Chumeca vein area totaling 2,038.3 m. GCM has continued the infill drilling program since 2016 with the focus on drilling the lower levels of Providencia and El Silencio, and the northern portion of Sandra K. Since 2017, GCM increased the focus on drilling which included:
| • | Between 2017 to 2018, in addition to the drilling GCM has continued to validate the locations of historical holes. The result is an increase in the number of drillholes of 314 holes for 32,138.9 m during the period. During this period 144 holes for 13,173 m were added at Providencia, 91 holes for 11,332.2 m were added to the El Silencio database and 79 holes for 7,633.3 m at Sandra K. |
| • | During 2019, GCM continued the routine infill underground drilling programs designed to confirm and increase the confidence in the grade distribution at the mines. The program consisted of 402 holes drilled for a total of 43,968 m of additional sampling information in the databases provided. All diamond core has been logged and sent for preparation to the SGS (Colombia) facility in Medellín. |
| • | During 2020, at Segovia there has been an increase in the diamond drilling database of 441 holes for 58,535 m, compared to December 2019. This can be broken down as follows: |
| ○ | GCM exploration (GEX) with the Segovia license continued the routine infill underground drilling programs designed to confirm and increase the confidence in the grade distribution at the mines. The program consisted of 230 holes drilled for a total of 35,987 m |
| ○ | Additional to the exploration 89 holes for 12,422 m where added from the mining department (GEM) |
| ○ | 28 holes for 956 m were added from mine short term development department which have been assayed at the GCM laboratory |
| ○ | Additional data capture of 106 holes for 12,409 m where added from historical sources (FGM) |
| • | During 2021, GCM exploration continued to add to the current database through a combination of drilling and data capture from other sources. All diamond core has been logged and sent for preparation to the SGS facility in Medellin. |
| • | The increase in the data base can be summarized as follows: |
| • | In total (Segovia + Carla) there has been an increase in the diamond drilling database of 424 holes for 97,106 meters (m), compared to December 2020. A new vein has been added to the Mineral Resource at the historical Vera mine, which includes an additional 63 holes for 9,640 |
|
BP/KD |
May 2022 |
| SRK Consulting (U.S.), Inc. NI 43-101 Technical Report – Segovia 2021 PFS Update |
Page 86 |
| m, bringing the total drilling database to 2,553 holes for 378,846 m. This can be broken down between the various sources and projects as follows: |
| ○ | GCM exploration (GEX) with the Segovia license continued the routine infill underground drilling programs designed to confirm and increase the confidence in the grade distribution at the mines. The program consisted of 172 holes drilled for a total of 54,549 m |
| ○ | Additional to the exploration 160 holes for 29,787 m where added from the mining department (GEM) |
| ○ | 33 holes for 1,025 m were added from mine short term development department which have been assayed at GCM mine laboratory |
| ○ | Based on the data capture of the historical holes 2 holes were removed from historical sources (FGM) |
| ○ | At Carla License a total of 20 holes for 3,895 m were added to the database. The provided database included a further 19 holes (3,725.2 m) from the LBA target and 10 holes (2,445.5 m) at the SAN target, but these have been excluded from the current estimates as they lie outside of the license boundary. |
| • | A summary of the number of holes per mine split by GCM is shown in Table 10-1, and the drillhole and sampling plotted by location, highlighting new exploration data, are presented in Figure 10-2. Note, that no new drilling or sampling has been completed at Las Verticales during the most recent time period between the previous Mineral Resource statement. |
|
BP/KD |
May 2022 |
| SRK Consulting (U.S.), Inc. NI 43-101 Technical Report – Segovia 2021 PFS Update |
Page 87 |
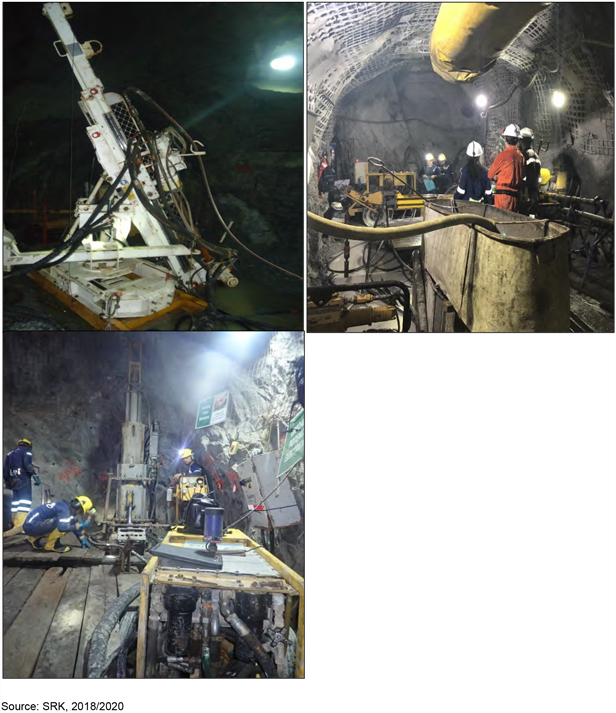
| Figure 10-1: | Underground Drilling Rig (LM30) in Use at Providencia, (H200) at El Silencio and Sandra K (bottom) |
|
BP/KD |
May 2022 |
| SRK Consulting (U.S.), Inc. NI 43-101 Technical Report – Segovia 2021 PFS Update |
Page 88 |
Table 10-1: Summary of the Data Available per Mine by Sample Type
|
Sample Type |
Source |
Providencia
|
El Silencio | Sandra K | Segovia Project Total | Carla | Vera | |||||||||||||||||||||||||||||||||||||||||||||||||||
|
Count
|
Sum (m)
|
Count
|
Sum (m)
|
Count
|
Sum (m)
|
Count
|
Sum (m)
|
Source
|
Count
|
Sum (m)
|
Source
|
Count
|
Sum (m)
|
|||||||||||||||||||||||||||||||||||||||||||||
| Channel |
FGM
|
3,091 | 2,994.60 | 1,540 | 926.30 | 1,557 | 1,416.70 | 6,188 | 5,337.60 | FGM | 180 | 207.10 | FGM | 4,588 | 3,326.40 | |||||||||||||||||||||||||||||||||||||||||||
|
GEM
|
13,018 | 12,825.60 | 23,398 | 18,996.50 | 11,368 | 10,793.10 | 47,784 | 42,615.20 | GEM | 1,069 | 1,053.70 | GEP | 31 | 18.80 | ||||||||||||||||||||||||||||||||||||||||||||
|
GEX
|
615 | 1,060.60 | 2,202 | 3,096.80 | 223 | 434.50 | 3,040 | 4,591.80 | GEX | 95 | 207.40 | GEX | 61 | 87.20 | ||||||||||||||||||||||||||||||||||||||||||||
|
MRC
|
290 | 240.30 | 290 | 240.30 | MRC | |||||||||||||||||||||||||||||||||||||||||||||||||||||
|
GPE
|
1,621 | 2,057.50 | 1,621 | 2,057.50 | GPE | 4 | 7.60 | GPE | ||||||||||||||||||||||||||||||||||||||||||||||||||
|
Channel
|
17,014 | 17,121.10 | 28,761 | 25,077.10 | 13,148 | 12,644.30 | 58,923 | 54,842.40 | Channel | 1,348 | 1,475.80 | Channel | 4,680 | 3,432.40 | ||||||||||||||||||||||||||||||||||||||||||||
|
Drillhole |
FGM
|
238 | 26,772.40 | 267 | 18,187.70 | 89 | 10,574.50 | 594 | 55,534.60 | GSG | 52 | 9,523.10 | FGM | 36 | 2,131.10 | |||||||||||||||||||||||||||||||||||||||||||
|
GEM
|
110 | 9,949.70 | 303 | 40,701.50 | 68 | 4,260.30 | 481 | 54,911.40 | GEM | 7 | 522.10 | GEM | ||||||||||||||||||||||||||||||||||||||||||||||
|
GEX
|
455 | 72,108.70 | 262 | 77,225.70 | 407 | 76,154.10 | 1,124 | 225,488.40 | GEX | 44 | 9,717.50 | GEX | 27 | 7,509.00 | ||||||||||||||||||||||||||||||||||||||||||||
|
GPE
|
59 | 1,233.50 | 79 | 2,632.00 | 9 | 234.40 | 147 | 4,099.90 | |
GSG (Other) |
|
29 | 6,170.70 | GPE | ||||||||||||||||||||||||||||||||||||||||||||
|
QUIN
|
12 | 3,238.50 | 12 | 3,238.50 | QUIN | |||||||||||||||||||||||||||||||||||||||||||||||||||||
|
Drillhole
|
874 | 113,302.80 | 911 | 138,746.90 | 573 | 91,223.20 | 2,358 | 343,272.90 | Drillhole | 132 | 25,933.30 | Drillhole | 63 | 9,640.00 | ||||||||||||||||||||||||||||||||||||||||||||
|
Sample Point |
FGM
|
36,918 | 36,404.30 | 57,178 | 64,341.10 | 22,169 | 11,224.30 | 116,265 | 111,969.70 | FGM | FGM | |||||||||||||||||||||||||||||||||||||||||||||||
|
Sample
|
36,918 | 36,404.3 | 57,178 | 64,341.10 | 22,169 | 11,224.30 | 116,265 | 111,969.70 | |
Sample Point |
|
0 | 0.00 | |
Sample Point |
|
0 | 0.00 | ||||||||||||||||||||||||||||||||||||||||
|
Grand Total (Drilling)
|
874 | 113,302.80 | 911 | 138,746.90 | 573 | 91,223.20 | 2,358 | 343,272.90 | 132 | 25,933.30 | 63 | 9,640.00 | ||||||||||||||||||||||||||||||||||||||||||||||
|
Grand Total (Channels)
|
53,932 | 53,525.40 | 85,939 | 89,418.20 | 35,317 | 23,868.60 | 175,188 | 166,812.10 | 1,348 | 1,475.80 | 4,680 | 3,432.40 | ||||||||||||||||||||||||||||||||||||||||||||||
|
Grand Total (All Sampling)
|
54,806 | 166,828.10 | 86,850 | 228,165.10 | 35,890 | 115,091.80 | 177,546 | 510,085.00 | 1,480 | 27,409.10 | 4,743 | 13,072.40 | ||||||||||||||||||||||||||||||||||||||||||||||
Source: SRK, 2022
Note: Summary by sample types are shown in shaded grey cells
|
BP/KD |
May 2022 |
| SRK Consulting (U.S.), Inc. NI 43-101 Technical Report – Segovia 2021 PFS Update |
Page 89 |
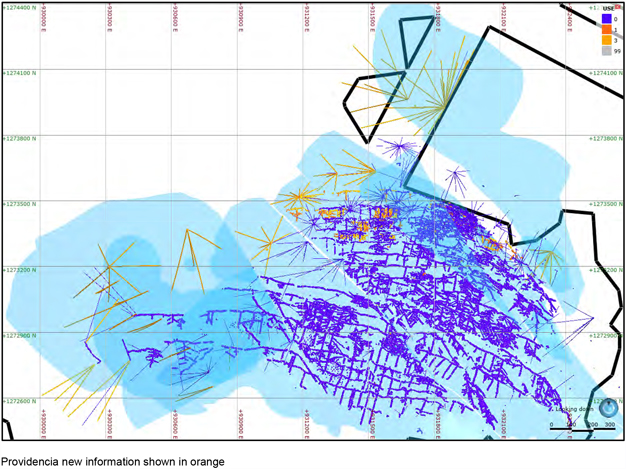
|
BP/KD |
May 2022 |
| SRK Consulting (U.S.), Inc. NI 43-101 Technical Report – Segovia 2021 PFS Update |
Page 90 |
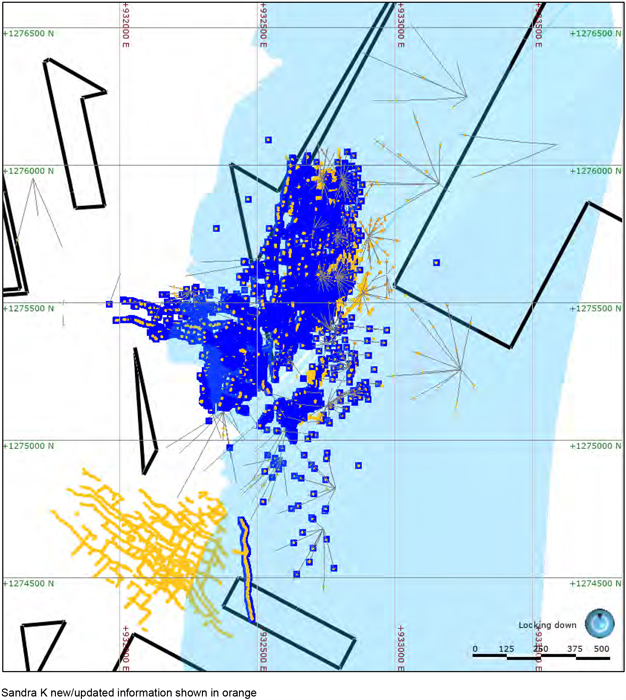
|
BP/KD |
May 2022 |
| SRK Consulting (U.S.), Inc. NI 43-101 Technical Report – Segovia 2021 PFS Update |
Page 91 |
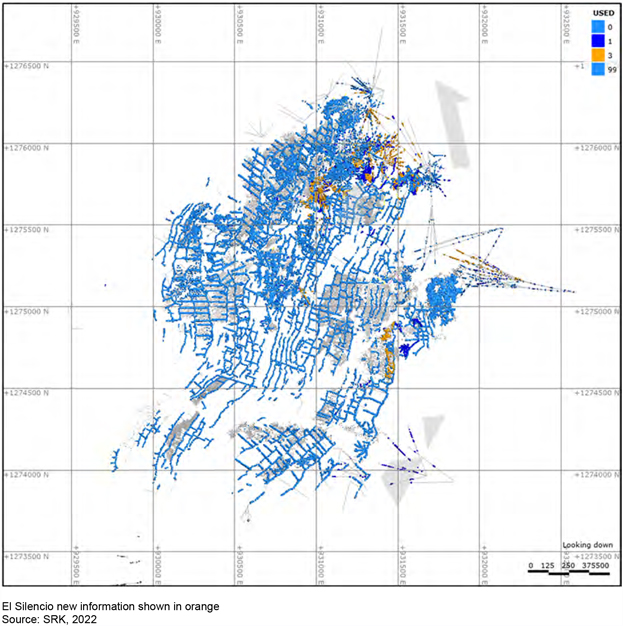
| Figure 10-2: | Sampling Data at Providencia, Sandra K, and El Silencio Colored by Database Phase (Orange indicates New Data) |
| 10.2 | Carla |
In 2011, GCM delineated a drilling program for the Carla Project, to be undertaken by PERFOTEC a Colombian drilling contractor, a total of 57 holes totaling some 10,373 m have been completed and designated with the prefix “DRILL-“or “DS-“ series holes prior to infill drilling in 2019 and 2020.
At Carla License a total of 20 holes for 3,895 m were added to the database. All completed drilling has been made available to SRK in producing the geological model and associated Mineral Resource estimate. The new program targeted infill drilling within interpreted high-grade locations of the drill platforms and had the objective to intercept the vein based on 50 m sections and to trace down-dip extensions at the south of the deposit (Figure 10-3). The provided database included a further 19 holes
|
BP/KD |
May 2022 |
| SRK Consulting (U.S.), Inc. NI 43-101 Technical Report – Segovia 2021 PFS Update |
Page 92 |
(3,725.2 m) from the LBA target and 10 holes (2,445.5 m) at the SAN target, but these have been excluded from the current estimates as they lie outside of the license boundary.
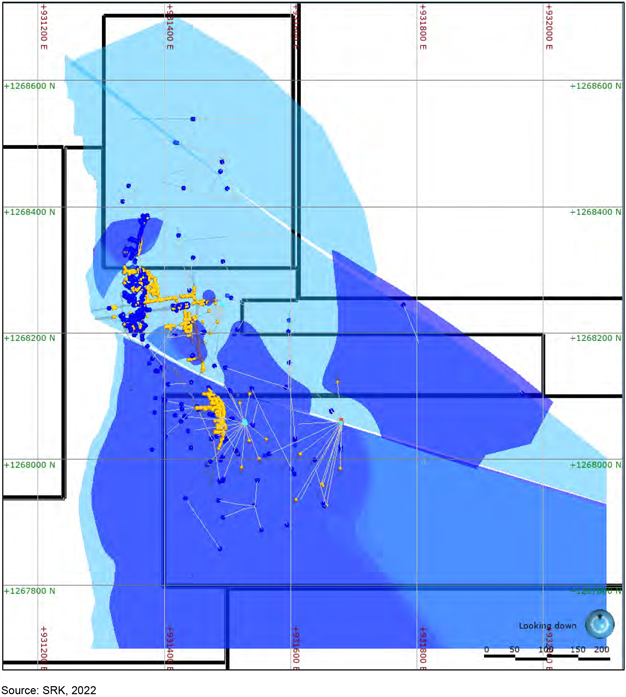
Figure 10-3: Drilling and Sampling Locations at Carla Project
| 10.3 | Vera |
GCM has undertaken drilling and validation work on another historical mine worked by local miners which have increased the potential for additional mineral resources in the area known as the Vera Project. This mine is in the vicinity of the Sandra K mine, which was mined over a strike length of 0.8
|
BP/KD |
May 2022 |
| SRK Consulting (U.S.), Inc. NI 43-101 Technical Report – Segovia 2021 PFS Update |
Page 93 |
km, with drilling coverage to over 1.0 km of strike. Between 2019 and 2021 GCM has completed exploration sampling and drilling in this area.
The verification process of the historical information included the digitizing and georeferencing of the historical images of underground workings and sampling. The sampling data (lengths and grades) was transformed to the metric system and imported into the database.
The drilling and the historical rock sampling were used to generate the geological model and to produce the Mineral Resource estimate. The drilling completed by GCM was focused on the definition of the continuity of the Vera structures at depth and to the East and North (Figure 10-4).
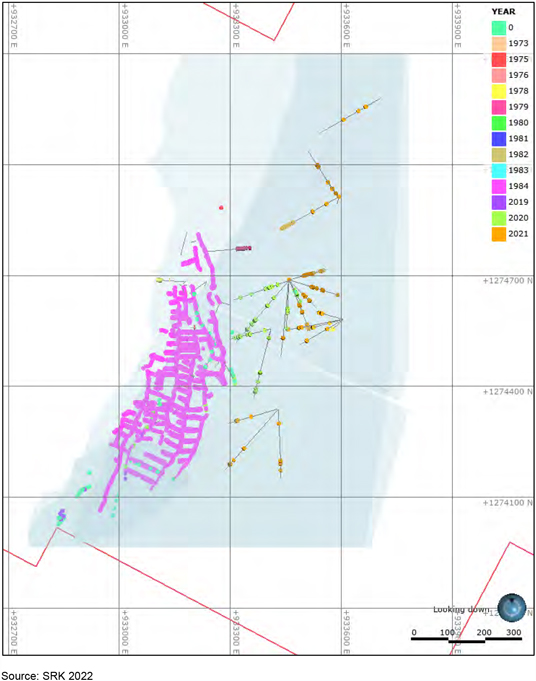
Figure 10-4: Drilling and Sampling Locations at Vera Project
|
BP/KD |
May 2022 |
| SRK Consulting (U.S.), Inc. NI 43-101 Technical Report – Segovia 2021 PFS Update |
Page 94 |
| 10.4 | Procedures |
| 10.4.1 | Collar Surveys |
All drill sites were initially located with the use of a handheld GPS with final locations recorded by a surveyor once the drilling was completed. Each hole underwent a downhole survey once completed.
All GCM drillhole collars have been surveyed using a precision GPS which is based on Total Station measurements and have been located to a high degree of confidence in terms of the X, Y and Z location. This data has been provided to SRK in digital format using UTM grid coordinates. Details of the survey methods for the historical holes is not known.
| 10.4.2 | Downhole Surveys |
The drilling from surface is reported to have been orientated broadly perpendicular to the target vein (access permitting); however, very few collar surveys are available and thus the large majority of traces are shown in the database as vertical for the historical holes. Directional surveys were not carried out during the FGM drilling programs.
FGM underground drilling appears to have largely been completed from crosscuts and platforms on the main levels. These holes tend to be short (less than 50 m) and have only been assigned a single azimuth and dip direction from the collar.
GCM has addressed the limited collar locations by utilizing fan drilling to maximize the information made available from a single drill site. The fan drilling patterns have been designed differently for underground and surface drilling. In the underground drilling GCM has completed development and established underground drilling chambers from which multiple holes can be collared at various angles (Figure 10-1). This is considered industry standard practice and in the opinion of the QP the GCM work is tied to a well-established procedure.
The fan drilling from surface has been completed by initially drilling a parent hole and then by applying wedges to designed angles to generate the fan at depth. The benefit of the wedge is it allows GCM to operate for a longer period from a single drilling platform, and that it will reduce the number meters required of drilling through the hangingwall which is known to have limited to no mineralization. SRK considers the use of the technique to be a good selection for the challenges of drilling at depth at Segovia. When working with wedge drilling the frequency of the down hole survey is an important factor.
GCM has used downhole geophysical surveys to orientate the holes carried out by the contractor ‘Weatherford’. The downhole tool has a Verticality Sonde instrument that measures azimuth and inclination every 5 m by two level cells and three magnetometers. Erratic measurements in zones of casing indicate the instrument was affected by magnetic rocks and casing and should be ignored. Outside of the casing in general, the data collected is considered to be of high precision and accuracy suitable for use in this resource estimation.
| 10.4.3 | Core Logging |
During the 2012, 2013, 2016, 2017, 2018, 2020 and 2022 site visits, SRK was able to visit the core shed facilities and observed the underground channel sampling to review the sampling methods currently employed by GCM. The following section relates to the methods and protocols used by GCM
|
BP/KD |
May 2022 |
| SRK Consulting (U.S.), Inc. NI 43-101 Technical Report – Segovia 2021 PFS Update |
Page 95 |
in the latest exploration campaign. In terms of the historical sampling methods, SRK has relied on the work completed by Dr. Stewart Redwood, a consultant geologist to GCM.
The new GCM exploration and geology offices, logging area, core and samples storage and core cutting room are located inside the El Silencio Mine complex. SRK visited the storage facility during the site visit in 2022 and found the facility to be organized and clean (Figure 10-5). The new core storage facility was completed in 2020 and a second one is in process of construction.
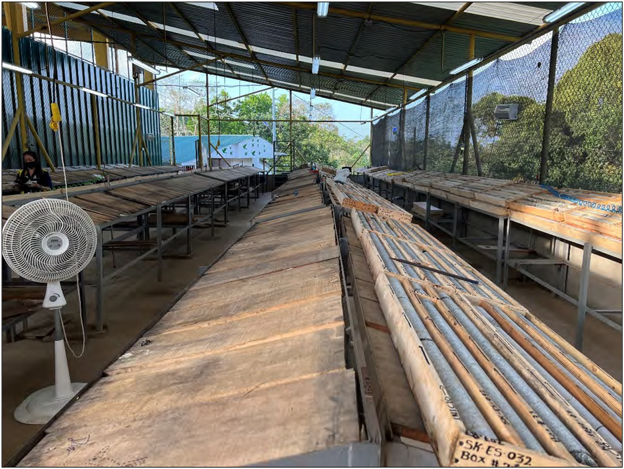
|
BP/KD |
May 2022 |
| SRK Consulting (U.S.), Inc. NI 43-101 Technical Report – Segovia 2021 PFS Update |
Page 96 |
Figure 10-5: New Core Storage Facility and Logging Room at Segovia
Core logging and sampling procedures were consistent throughout the drilling program and were performed by the Company’s exploration geology team. The main processes were as follows:
| • | Core boxes are transported from the drill sites to the core storage and logging facilities, Figure 10-5 |
| • | Technicians at the core shed log the core for recovery and RQD |
| • | All core is photographed wet (Figure 10-6) |
| • | Core is geotechnically and geologically logged using a paper logging form, specifically designed for vein type deposits, along with a Geology & Mineral Codes Legend |
|
BP/KD |
May 2022 |
| SRK Consulting (U.S.), Inc. NI 43-101 Technical Report – Segovia 2021 PFS Update |
Page 97 |
| • | Sampling lengths are allocated; only the vein material and through into the hangingwall and footwall, material is sampled in lengths ranging from 30 cm to 1 m dependent upon geological unit |
| • | For the purpose of sampling, the alteration (where present) in the wall rock is split into two distinct units, namely argillic dominant (typically more gold-bearing) and propylitic or potassic dominant |
| • | Sections are then carefully cut with the use of a diamond core cutter into two equal halves |
| • | Samples are taken and placed into heavy duty plastic bags; care is taken to ensure the same half core is removed throughout the sample interval |
| • | Samples of 5 cm, 10 cm or 20 cm are collected for specific gravity measurements. |
| • | Quality Control materials are inserted only in the mineralized intervals selected, coarse granitic blank material, different pulped standards and 1/4 core for field duplicates. Any insertion is recorded within the core box by inserting additional wooden core blocks |
| • | Samples are shipped to the SGS Colombia S.A. facilities in Medellín for sample preparation and fire assay |
| • | All core boxes are covered and housed in a centralized core storage facility |
| • | All data is inputted into a central SQL database maintained on site by one of two responsible data managers |
It is SRK’s opinion that the current sampling methods and approach are in line with industry best practice and should not lead to any bias in the sampling and assay results.
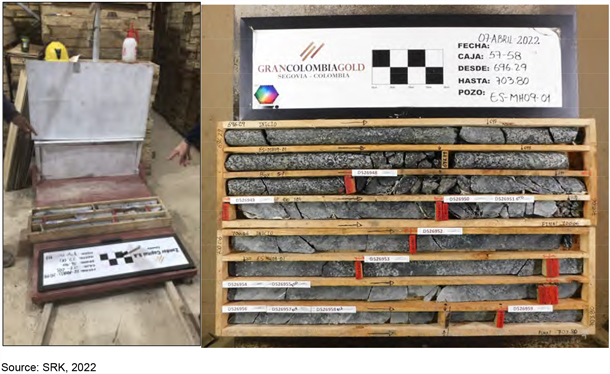
Figure 10-6: Example of Core Photography Setup (left) and Core Photographs (right)
|
BP/KD |
May 2022 |
| SRK Consulting (U.S.), Inc. NI 43-101 Technical Report – Segovia 2021 PFS Update |
Page 98 |
| 10.4.4 | Drillhole Orientation |
At Providencia, the drilling intersects the mineralized vein from the northeast, southwest and (predominant) vertical orientations in an attempt to intersect the vein target area with sufficient coverage whilst remaining inside the Segovia Concession boundary. From surface the drillholes dip range from -39° to -90°, with the average dip of the holes in the order of -79º and hole lengths ranging from 22 to 597.0 m (Figure 10-7). In 2019 and 2020 surface drilling at Providencia and El Silencio has been completed using wedged holes from a single parent hole.
In addition to the surface drilling, infill drilling has been completed from underground fan drilling to maximize the information made available from a single drill site. Fan drilling ranges from +39° to -90°. Hole depths from underground drilling at Providencia ranges from 2 m to 461 m. Infill drilling is aimed to reduce the drillhole spacing to approximately 25 by 25 m spacing.
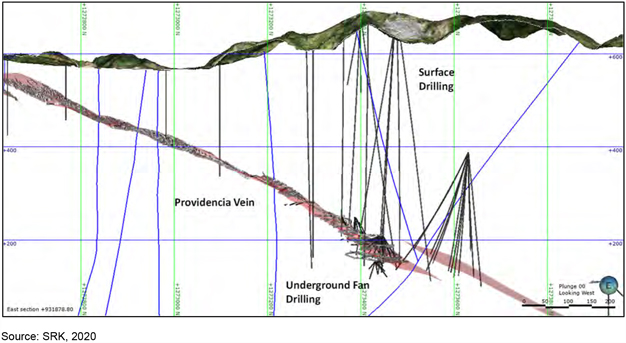
| Figure 10-7: | Cross Section (65 m Clipping Width) Through the Providencia Deposit, Showing Typical Drillhole Orientation, Looking West |
At El Silencio, the drilling database includes drilling from a variety of locations including surface and areas within the Las Verticales area to the west of the El Silencio mine. Drillholes from surface are drilled to the west/south-west/north-west or vertical orientations. Drilling is a mixture of directional and vertical holes with the average dip of the drilling from surface drillholes dip ranging from -40° to -90°, with the average dip of the holes in the order of -58º and hole lengths ranging from 25 to 1,120 m.
In 2019-2021, GCM has focused on underground fan infill drilling to reduce the drillhole spacing to approximately 50 m by 50 m spacing. Fan drilling ranges from +45° to -79°, with the average dip reported at -33°. Hole depths from underground drilling at Providencia ranges from 13.6 m to 1,183.8 m. In 2021, GCM drilled a series of wedged holes (Figure 10-8) to infill the drilling density at depth at El Silencio. The holes were drilled by a drilling contractor and made use of an initial parent hole of approximately 500 m, before a series of wedges were placed with the fans optimized to provide a drilling coverage of approximately 50 x 50 m spacing.
|
BP/KD |
May 2022 |
| SRK Consulting (U.S.), Inc. NI 43-101 Technical Report – Segovia 2021 PFS Update |
Page 99 |
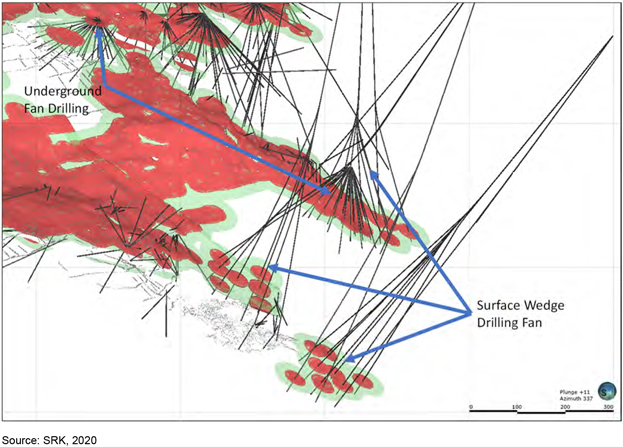
Figure 10-8: Oblique View, Showing Wedge Drilling Location in Lower Levels of El Silencio
At Sandra K, from surface the drillholes lengths ranging from 16 to 595 m, with an average depth of approximately 265 m, with dips ranging from -27° to -90°, and an average dip of the holes in the order of -72°. In addition to the surface drilling infill drilling has been completed from underground fan drilling to maximize the information made available from a single drill site. Fan drilling ranges from +38° to 90°, with the average dip reported at -40°. Hole depths from underground drilling at Providencia ranges from 3.5 m to 398.6 m, with an average of 107 m.
The predominant drilling direction at the Las Verticales area has been to the southwest which is perpendicular to the main orientation of the majority of the veins. The drillholes are plotted on sections oriented north 65° east across the principal structural control of the deposit and spaced 100 to 200 m apart. The dips range from -37° to -90°, with the average dip of the holes in the order of -63° and hole lengths ranging from 82.8 to 600 m.
| 10.5 | Interpretation and Relevant Results |
The drilling results are used to guide ongoing exploration efforts and to support the resource estimation. SRK notes that for the majority of the individual deposits, drilling is as perpendicular to the deposit as possible although there is a degree of concern relating to the low angle of intersection of the deep drilling with the Las Verticales Veins System (resulting in a vein interval length that may not closely represent true thickness).
|
BP/KD |
May 2022 |
| SRK Consulting (U.S.), Inc. NI 43-101 Technical Report – Segovia 2021 PFS Update |
Page 100 |
It is SRK’s opinion that with the exceptions noted at Las Verticales and limited areas of underground fan at Providencia and El Silencio, the drilling orientations are sufficiently reasonable to accurately model the geology and mineralization based on the current geological interpretation. Areas with poor interception angles have been accounted for in the mineral resource classification, and SRK strongly recommends drilling these areas from different positions to improve the angle of intersection in any future programs.
During 2021, GCM has focused drilling exploration on underground drilling at Providencia, El Silencio Sandra K and the Vera Project looking for down-dip extensions to existing mineralization. The updated MRE for the Segovia and Carla operations incorporates diamond drilling database of 424 holes for 97,106 meters (m), compared to December 2020. A new vein has been added to the Mineral Resource at the historical Vera mine, which includes an additional 63 holes for 9,640 m, bringing the total drilling database to 2,553 holes for 378,846 m.
The location and key results of 2021 drilling program findings discussed below. Results included the discovery of new structures within the El Silencio Mine and extension to some previously known structures. A summary of the key finding includes:
| • | At Providencia, the current mineralization at depth is limited by the property boundary. The 2021 drilling has targeted the lower levels of the mine and the western edge of the lower levels, which exist within the property boundary (Figure 10-9). In-mine infill drilling from underground station PV6115, located at the westernmost end and off Level 14, was completed to test the high-grade intercept encountered in drill hole PV-IU-276, located below the development of Level 14 to the west that intersected a new orebody with 42 meters horizontal width at an average grade of 25.0 g/t Au. Multiple medium to high gold grades were intersected from 20 drill holes |
| • | At El Silencio the ongoing directional drilling program on the El Silencio Deep Zone is targeted to extend and better delineate the southern ore-shoot down-plunge below Level 40 (Figure 10-10). Drilling on the southern ore-shoot continues to be successful in confirming the high- grade nature of the 450 Vein and extending the down-plunge continuity of one (southern) of the two distinct high-grade domains. The ongoing in-mine exploration drilling from underground station ES4170, installed off Level 17 of the Providencia mine, was designed to prove the continuity of the Manto Vein in the southernmost portion of El Silencio mine. Drilling was successful in demonstrating such continuity coupled with high grades. |
| • | At Sandra K drilling from a number of underground stations (SK5290 and SK5480) has further extended down-plunge, to approximately future levels 7 to 9 (Figure 10-11). Drilling from SK5290 has extended an ore-shoot outlined by previous drilling, which occurs in a block of the Sandra K Vein System delimited by a set of faults striking NE and steeply dipping to the north related to the Lejanias Fault System. This orebody remains open at depth. Exploration drilling from surface on the southern fault block intersected high grade gold grades in 9 holes which potentially extends mineralization down to level 12. Additional exploration drilling from surface platforms SK5700, SK5875 and SK6020, located in the northern fault block of the vein system designed on a wide drilling spacing, from 100 m x 100 m to 150 m x 150 m and aimed to extend down-dip the main vein system by 500 meters from Level 6, which is the deepest level of the mine. Drilling was successful in extending further along strike and down-dip, to approximately Level 11, the main vein system. Multiple high gold grades were intersected from 13 drill holes |
|
BP/KD |
May 2022 |
| SRK Consulting (U.S.), Inc. NI 43-101 Technical Report – Segovia 2021 PFS Update |
Page 101 |
| • | Validation of channel sampling within the historical Cogote Mine confirmed the up-dip extension of the GCM drilling at depth. The grades in the channel samplings within the mine area appear to show more continuity to the high-grade shoots than the current drilling intersections at depth, which indicates the potential for high-grade shoots. |
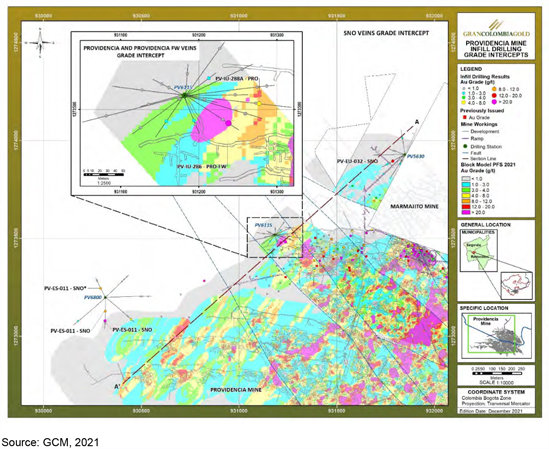
Figure 10-9: Summary of key intersections at Providencia
|
BP/KD |
May 2022 |
| SRK Consulting (U.S.), Inc. NI 43-101 Technical Report – Segovia 2021 PFS Update |
Page 102 |
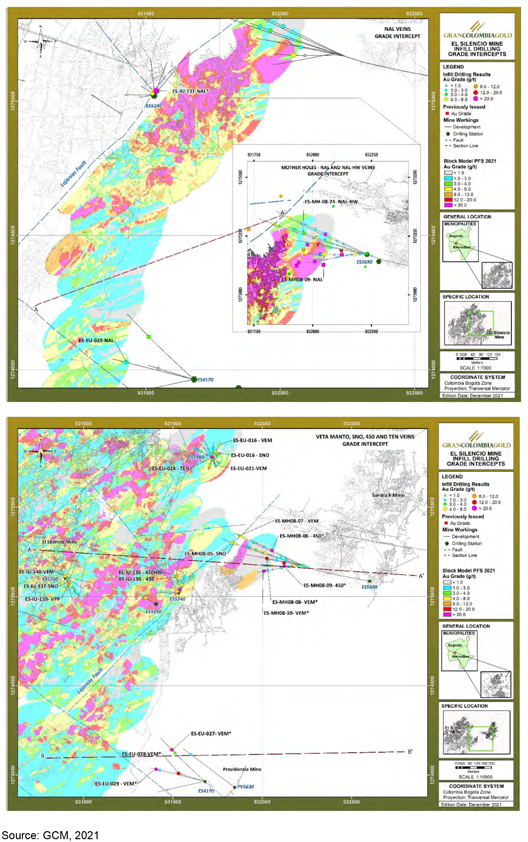
Figure 10-10: Summary of key intersections at El Silencio (top = south, bottom = north)
|
BP/KD |
May 2022 |
| SRK Consulting (U.S.), Inc. NI 43-101 Technical Report – Segovia 2021 PFS Update |
Page 103 |
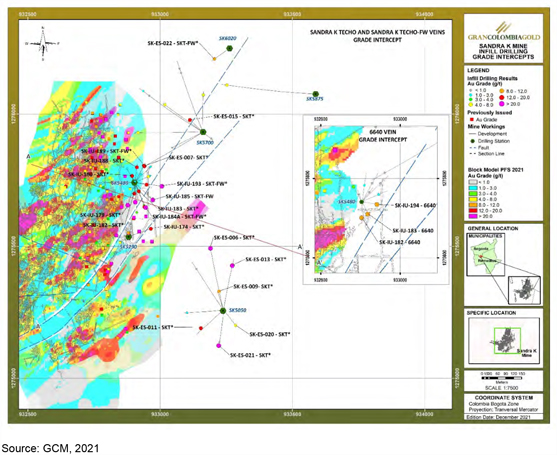
Figure 10-11: Summary of key intersections at Sandra K
|
BP/KD |
May 2022 |
| SRK Consulting (U.S.), Inc. NI 43-101 Technical Report – Segovia 2021 PFS Update |
Page 104 |
| 11 | Sample Preparation, Analysis and Security |
GCM employs material handling protocols at the mines for underground drilling and sampling. All underground sampling (Channel Sampling) is completed by mine personal or mining contractors depending on the location in the mines. Samples are collected in plastic bags and labelled and transported back to surface. Diamond drill (DD) core is collected at the rig and measured by the drilling contractors. A GCM geologist from the exploration team visits the rig at regular intervals to confirm sampling protocols are being followed. Each core box (wooden) is sealed at the drill station prior to transport to surface by GCM personnel. All exploration sampling is transferred at surface to the exploration offices, where any logging or subsampling required is completed prior to dispatch to the laboratory.
| 11.1 | Core Logging |
Core logging and sampling procedures were consistent throughout the drilling programs by GCM and were performed by GCM’s exploration geology team. The main processes are as follows:
| • | Technicians at the drill site log the core for recovery and RQD before transportation to the core shed |
| • | Core boxes are transported from the drill sites to the core storage and logging facilities within the El Silencio Mine complex (Figure 11-1) |
| • | All core is photographed wet |
| • | Core is geologically logged by GCM Geologists using logging sheets designed for detailed descriptions |
| • | Sampling lengths are allocated by the geologists; only the vein material and the hanging-wall and footwall selvage material is sampled on lengths ranging between 30 cm to 1 m dependent upon geological unit |
| • | For the purpose of sampling, the alteration (where present) in the wall rock is split in to two distinct units, namely argillic dominant (typically more gold-bearing) and propylitic or potassic dominant |
| • | Geologists mark the center line of the core and half-core samples are cut with a diamond core cuter into two equal halves |
| • | Samples are taken and placed into heavy duty plastic bags; care is taken to ensure the same side half of core is removed throughout the sample interval |
| • | Samples of 5 cm, 10 cm or 20 cm are collected for specific gravity measurements. |
| • | Quality Control materials are randomly inserted following the GCM defined QA/QC procedures discussed in section 11.5, which include coarse blank material, three different pulped standards and 1/4 core for field duplicates, any insertion is recorded within the core box by inserting additional wooden core blocks |
| • | Samples are shipped to SGS Colombia S.A. facilities in Medellín for preparation and fire assay |
| • | All core boxes are covered and housed in a centralized core storage facility which is within the mine grounds and require access control. |
All drilling, logging, and analytical data is inputted into a central structured query language (SQL) database maintained on site by one of two responsible data managers
|
BP/KD |
May 2022 |
| SRK Consulting (U.S.), Inc. NI 43-101 Technical Report – Segovia 2021 PFS Update |
Page 105 |
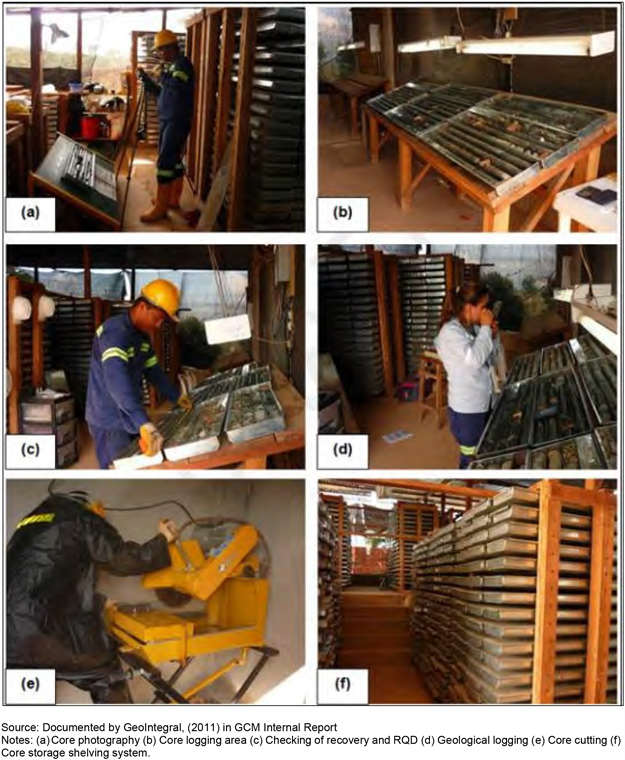
Figure 11-1: Core Storage Facility at the Carla Project
|
BP/KD |
May 2022 |
| SRK Consulting (U.S.), Inc. NI 43-101 Technical Report – Segovia 2021 PFS Update |
Page 106 |
| 11.2 | Sample Preparation for Analysis |
| 11.2.1 | Channel/Chip Sampling at Mine Laboratory, Pre-2015 |
SRK visited the mine laboratory located in close proximity to the Maria Dama Plant during the 2013 site inspection.
The sample preparation method at the mine laboratory consisted of placing samples in individual steel trays, which were then inserted into a large oven (heated at 105ºC for approximately three hours).
The entire sample was crushed to more than 85% passing -10 mesh (2 mm) using a jaw crusher, then spilt to 250 g using a Jones splitter (if required) and pulverized to more than 90% passing -140 mesh (140 µm) with an LM2 pulverizing ring mill.
The fineness of the pulverized sample was reported to be tested using a sieve once per shift by SRK has not reviewed the procedure during the site inspections.
From the pulverized material, a 50 g sample was selected using a cone and quarter method and mixed with a flux. Gold assays were then taken using fire assay techniques with a gravimetric finish only.
Tested barren silica sand (in addition to compressed air) was used as a clean wash between each sample in the crushing and pulverization stages.
| 11.2.2 | Mine Laboratory, 2015 - Present |
GCM commissioned a new mine laboratory in 2015. The laboratory is located near the current Maria Dama processing facility and can complete sample preparation and fire assay (channel samples). The facility was constructed under the guidance of SGS but is run by GCM.
SRK visited the facility on August 10, 2016 and April 12, 2018, and noted that the laboratory was organized and clean, with dust extraction units in place to minimize potential contamination issues. Samples are tracked through the system using barcodes placed on the samples within the sample receipt bay.
The sample preparation methodology at the mine remains the same as the old laboratory but is improved by the quality of the equipment and the space in the new facility.
From the pulverized material, a 50 g sample was selected using a cone and quarter method and mixed with a flux. Gold assays were then taken using fire assay techniques with a gravimetric finish only.
| 11.2.3 | Exploration Channel Sampling and Diamond Drilling SGS (Colombia) Laboratory |
Since the 2011 drill program, samples were sent for sample preparation to the ISO 9001:2000 accredited, SGS laboratories (SGS Colombia S.A.) sample preparation facility in Medellín and assayed for gold by SGS in Peru (SGS Peru).
SRK has not visited the SGS Medellín sample preparation facilities during the current site inspections but has during previous visits. The sample preparation method at SGS Colombia S.A. in Medellín was the same as designed for the mine laboratory.
|
BP/KD |
May 2022 |
| SRK Consulting (U.S.), Inc. NI 43-101 Technical Report – Segovia 2021 PFS Update |
Page 107 |
| 11.3 | Sample Analysis |
| 11.3.1 | Mine Laboratory, Pre-2013 |
From the pulverized material, a 50 g sample was selected using a cone and quarter method and mixed with a flux. Gold assays were then taken using fire assay techniques with a gravimetric finish only.
| 1.1.1 | Mine Laboratory, 2015 |
The only samples assayed in the onsite laboratory and used in the current resource estimate are the channel samples collected by the Mine Geology Department. All exploration drilling and sampling has been dispatched to SGS Colombia S.A. in Medellín for sample preparation and analysis. Since early November 2020, all exploration samples are still dispatched to SGS Colombia S.A. in Medellín for sample preparation but returned to the on-site facilities in Segovia for analysis, as the SGS fire assay facilities in Medellín were shut down in October 2020.
The sample preparation methods are consistent with those used at the SGS Colombia S.A. facility (Figure 11-2). SGS Colombia S.A. in Medellín analyzed the samples for gold by fire assay with AAS finish, using an Aligent Technologies 200 Series AA machine. Silver samples above 100 g/t were assayed by fire assay with gravimetric finish. All information is captured directly into the laboratory database to remove any transcription errors. Samples over 5 g/t Au were assayed by fire assay with gravimetric finish.
|
BP/KD |
May 2022 |
| SRK Consulting (U.S.), Inc. NI 43-101 Technical Report – Segovia 2021 PFS Update |
Page 108 |
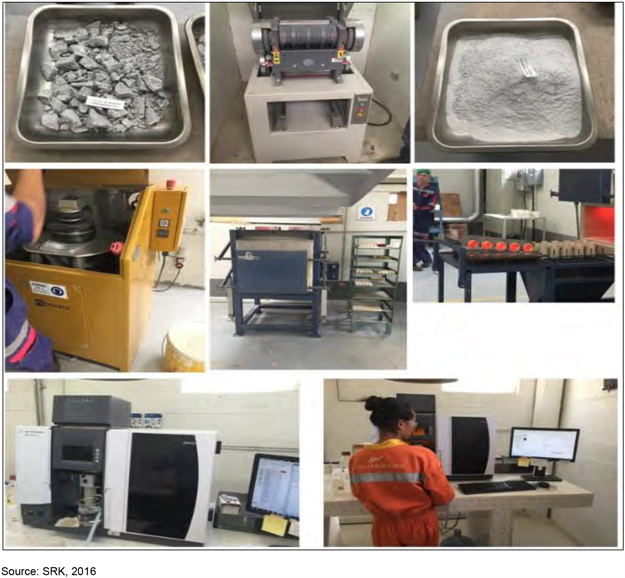
| Figure 11-2: | Mine Laboratory at Segovia, Showing Crusher, Pulverizer, Furnace and AA Assay Capture |
| 11.3.2 | SGS Laboratory |
Since August 15, 2013, SGS Colombia S.A. has upgraded the SGS laboratory at Medellín from a sample preparation only facility to both sample preparation and fire assay. Mr. Giovanny Ortiz of SRK has not completed a visit to the laboratory during the current site inspections, but Mr. Ben Parsons has visited the laboratory in previous years. Samples are tracked through the system using barcodes placed on the samples within the sample receipt bay. The sample preparation method follows the same process as the old laboratory.
SGS Colombia S.A. in Medellín analyzed the samples for gold by fire assay with atomic absorption spectrophotometer (AAS) finish. Samples over 5 g/t Au were assayed by fire assay with gravimetric finish. Silver was assayed by aqua regia digestion and AAS finish. All field samples and drill samples up to hole ZC 0086 were analyzed for multiple elements by aqua regia digestion and inductively coupled plasma (ICP) finish (39 Element ICP Package).
|
BP/KD |
May 2022 |
| SRK Consulting (U.S.), Inc. NI 43-101 Technical Report – Segovia 2021 PFS Update |
Page 109 |
Since early November 2020, all exploration samples are dispatched to SGS Colombia S.A. in Medellín for sample preparation and analysis.
| 11.4 | Specific Gravity (Density) |
GCM, with guidance from SRK, developed a density measurement protocol based on Archimedes immersion methodology:
Samples of 5 cm (3 pieces), 10 cm (2 pieces) and 20 cm (1 piece) are collected from drill core for each lithology. Samples from the vein rock type are collected after assaying to avoid losing sample.
| • | Weigh dry sample |
| • | Weigh sample covered in paraffin |
| • | Immerse in water on suspended tray |
| • | Manually record weight |
| • | Back-calculate density based on fixed formula within an Excel spreadsheet |
An example of the equipment used to measure the weights during the analysis and a typical prepared core sample with logging sheet is illustrated in Figure 11-3. At Segovia, prior to 2017, the program implemented by GCM for specific gravity included a total of 580 drill core and channel samples analyzed. Density values measured range from 1.51 to 4.97 g/cm3.
Check samples have been taken in both the historical and more recent sampling. A total of seven samples were sent to SGS Peru in 2012 for external verification. A further 10 check samples were submitted in 2018 to ALS Medellín for analysis. The results of the analysis confirmed the initial values are reasonable with the difference in the mean density reporting within ± 1 %, and therefore SRK has considered the database from the GCM to be acceptable.
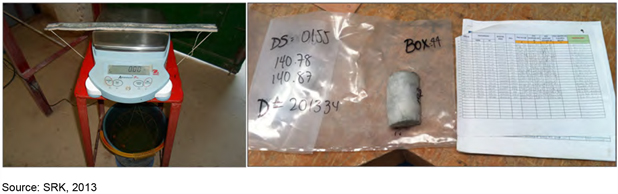
Figure 11-3: Core Sample Coated in Paraffin Wax with Logging Sheet, Prior to Entry to the Database
Between 2017 and 2018, an additional 179 samples were selected and tested using the same immersion methodology. The density values ranged from 2.58 to 4.86 g/cm3, with an average density of 2.77 g/cm3. The routine sampling of density has continued with results reviewed on an annual basis. In 2020 a total of 176 samples were taken, which increased to 564 samples with the increased exploration program in 2021. A review of the 2020 and 2021 results is shown in Table 11-1.
It is the QP’s opinion that the average value of 2.7 g/cm3 as used in the previous models remains as a reasonable representation of mineralized vein density.
|
BP/KD |
May 2022 |
| SRK Consulting (U.S.), Inc. NI 43-101 Technical Report – Segovia 2021 PFS Update |
Page 110 |
Table 11-1: Summary of 2020 and 2021 Density Sampling by Lithology
| Lithology |
Count | Minimum | Maximum | Average | Standard Deviation | |||||||||
| Unknown |
8 | 2.65 | 3.09 | 2.79 | 0.14 | |||||||||
| HA1 |
49 | 2.66 | 2.92 | 2.82 | 0.05 | |||||||||
| HA2 |
17 | 2.73 | 2.90 | 2.83 | 0.05 | |||||||||
| HA2A |
91 | 2.59 | 3.01 | 2.83 | 0.07 | |||||||||
| HA2B |
42 | 2.68 | 2.89 | 2.83 | 0.05 | |||||||||
| HA3 |
37 | 2.65 | 2.84 | 2.74 | 0.03 | |||||||||
| IAP |
61 | 2.54 | 2.74 | 2.62 | 0.03 | |||||||||
| IGD |
94 | 2.59 | 2.93 | 2.73 | 0.05 | |||||||||
| IGD1 |
54 | 2.69 | 2.90 | 2.76 | 0.03 | |||||||||
| IGD2 |
116 | 2.54 | 2.86 | 2.74 | 0.04 | |||||||||
| IGD4 |
60 | 2.49 | 2.77 | 2.69 | 0.04 | |||||||||
| IPE |
11 | 2.55 | 2.64 | 2.60 | 0.03 | |||||||||
| other |
44 | 2.52 | 2.92 | 2.75 | 0.09 | |||||||||
| VEN |
56 | 2.58 | 3.93 | 2.70 | 0.21 | |||||||||
|
Grand Total |
740 | 2.49 | 3.93 | 2.75 | 0.10 |
Source: SRK, 2022
| 11.5 | Quality Assurance/Quality Control Procedures |
Quality Assurance/Quality Control (QA/QC) measures ensure the reliability and trustworthiness of exploration data. These measures include written field procedures and independent verifications of aspects such as drilling, surveying, sampling and assaying, data management, and database integrity. Appropriate documentation for quality control measures and regular analysis of quality control data are important as a safeguard for project data and form the basis for the quality assurance program implemented during exploration.
A QA/QC program is independent of the testing laboratory. The purpose of a QA/QC program is to ensure reliable and accurate analysis is obtained from exploration samples for use in resource estimation as part of industry best practice. Correctly implemented, a QA/QC program monitors for detects, and corrects any errors identified at a project.
The following control measures were implemented by GCM to monitor both the precision and accuracy of sampling, preparation and assaying. Results shown have been limited to the QA/QC samples inserted during routine 2021 sample submissions. Results from 2019 and 2020 sample submissions are outlined in the report “Gran Colombia Segovia Mineral Resource Estimate December 31, 2019”. Results from 2020 sample submissions are outlined in the report “Gran Colombia Segovia Mineral Resource Estimate December 31, 2020”.
GCM uses a variety of samples within the QA/QC program which includes routine submissions of Certified Standard Reference Material (CSRM), blanks and duplicates into the routine sample stream. QA/QC samples are inserted at a rate of approximately 15%, as illustrated in Table 11-2. In every 100 samples sent to the laboratory, the following QA/QC materials were inserted: seven CRM, three blanks, one field duplicate, two coarse reject preparation duplicates and two sample pulp duplicates.
|
BP/KD |
May 2022 |
| SRK Consulting (U.S.), Inc. NI 43-101 Technical Report – Segovia 2021 PFS Update |
Page 111 |
Table 11-2: Quality Control Data Produced by the Company for the Project (2021)
| Sampling Program | Count | Comment | ||||||
| Mine Geology Sampling |
||||||||
| Coarse Blanks (ALS) |
0 |
Combined Channel & Drillhole submissions |
||||||
| Coarse Blanks (SGS) |
154 |
Combined Channel & Drillhole submissions |
||||||
| Coarse Blanks (GCM) |
1,321 |
Combined Channel & Drillhole submissions |
||||||
| Field Duplicates (GCM) |
1,298 |
Combined Channel & Drillhole submissions |
||||||
| Field Duplicates/core (SGS) |
64 |
Combined Channel & Drillhole submissions |
||||||
| CRM (ALS) |
0 |
Combined Channel & Drillhole submissions |
||||||
| CRM (SGS) |
148 |
Combined Channel & Drillhole submissions |
||||||
| CRM (GCM) |
1,297 |
Combined Channel & Drillhole submissions |
||||||
| Exploration Sampling |
||||||||
| Fine Blanks |
641 |
Combined Channel & Drillhole submissions |
||||||
| Pulp Blanks |
642 |
Combined Channel & Drillhole submissions |
||||||
| Channel Coarse Blanks |
178 | |||||||
| Drilling Coarse Blanks |
970 | |||||||
| Drilling Duplicates |
411 | |||||||
| Channel Coarse Duplicates |
76 | |||||||
| Channel Pulp Duplicates |
75 | |||||||
| Channel Field Duplicates |
71 | |||||||
| Drilling Coarse Duplicates |
388 | |||||||
| Drilling Pulp Duplicates |
404 | |||||||
| Drilling Field Duplicates |
0 | |||||||
| Drilling CRM |
1,012 | |||||||
| Channel CRM |
182 | |||||||
| Subtotal Mine Geology |
4,282 | |||||||
| Subtotal Exploration |
9,332 | |||||||
| Total QC Samples |
13,614 | |||||||
Source: SRK, 2022
| 11.5.1 | Certified Standard Reference Material (CSRM) |
GCM historically has used 41 different CSRMs in the sample analysis stream. During the 2020 exploration program CRMs for gold were supplied by Rocklabs, New Zealand, by Geostats, Australia, and by Ore Research and Exploration, Australia. Summary statistics are shown in (Table 11-3) for CSRM samples used in the exploration drilling program and (Table 11-4) for CSRM samples used in sampling mine geology channels. GCM has defined performance related goals on which batches are accepted or rejected and therefore requested for reanalysis. The guidelines can be summarized as follows:
| • | A single CSRM greater than three times the standard deviation is considered unacceptable and means the subsequent samples are rejected |
| • | A single CSRM greater than two times the standard deviation but less than three standard deviations is considered acceptable and no immediate action is taken |
| • | Two consecutive CSRMs greater than two times the standard deviation but less than three standard deviations are considered unacceptable, the laboratory is notified and samples falling between the two are re-assayed |
SRK has reviewed the CSRM results and associated graphs and is satisfied that they demonstrate in general a high degree of accuracy at the assaying laboratory (with the exception of a limited number of anomalies, generally associated with very high grade assays) and hence give sufficient confidence in the assays for these to be used to derive an MRE. A summary of the 2021 submissions of CSRM
|
BP/KD |
May 2022 |
| SRK Consulting (U.S.), Inc. NI 43-101 Technical Report – Segovia 2021 PFS Update |
Page 112 |
material separated by exploration and mine sampling submissions and the comparison with the same CSRMs sent in 2020 (Table 11-3 and Table 11-4).
| Table 11-3: | Summary of Certified Reference Material Produced by GEOSTATS, Rocklabs and Oreas and Submitted by GCM Exploration in Drilling/Channel Submissions to External Laboratories in 2020 and 2021 |
| 2020 Submissions | 2021 Submissions |
|||||||||||||||||||||||||||||
| Supplier | Material ID |
Certified Value |
Standard Deviation |
Count | Average Assay Au (g/t) |
Count | Average Assay Au (g/t) |
Standard Deviation |
||||||||||||||||||||||
| GEOSTATS |
G915-2 | 4.980 | 0.19 | 5 | 5.05 | 0.13 | ||||||||||||||||||||||||
| GEOSTATS |
G915-6 | 0.670 | 0.04 | 41 | 0.74 | 147 | 0.69 | 0.04 | ||||||||||||||||||||||
| GEOSTATS |
G916-5 | 19.920 | 0.69 | 52 | 19.77 | 1.15 | ||||||||||||||||||||||||
| GEOSTATS |
G916-6 | 30.940 | 0.87 | 8 | 31.57 | 0.72 | ||||||||||||||||||||||||
| GEOSTATS |
G916-8 | 3.200 | 0.12 | 15 | 3.20 | 0.04 | ||||||||||||||||||||||||
| GEOSTATS |
G917-6 | 0.760 | 0.04 | 121 | 0.78 | 0.03 | ||||||||||||||||||||||||
| GEOSTATS |
G314-1 | 0.750 | 0.04 | 1 | 0.82 | |||||||||||||||||||||||||
| GEOSTATS |
G315-2 | 0.980 | 0.02 | 82 | 0.99 | 68 | 1.00 | 0.03 | ||||||||||||||||||||||
| GEOSTATS |
G315-8 | 9.930 | 0.32 | 127 | 9.68 | 0.25 | ||||||||||||||||||||||||
| GEOSTATS |
G914-6 | 3.210 | 0.02 | 68 | 3.15 | |||||||||||||||||||||||||
| GEOSTATS |
G312-4 | 5.300 | 0.17 | 47 | 5.16 | 35 | 5.22 | 0.11 | ||||||||||||||||||||||
| GEOSTATS |
G311-8 | 1.570 | 0.08 | 86 | 1.54 | 0.05 | ||||||||||||||||||||||||
| GEOSTATS |
G313-7 | 6.930 | 0.05 | 13 | 7.82 | 43 | 7.13 | 0.26 | ||||||||||||||||||||||
| GEOSTATS |
G318-4 | 5.930 | 0.20 | 92 | 6.13 | 0.23 | ||||||||||||||||||||||||
| GEOSTATS |
G914-10 | 10.260 | 0.71 | 24 | 10.41 | 12 | 10.15 | 0.20 | ||||||||||||||||||||||
| GEOSTATS |
G914-06 | 24 | 3.22 | 0.03 | ||||||||||||||||||||||||||
| GEOSTATS |
HiSilP3 | 12.244 | 0.38 | 6 | 11.51 | |||||||||||||||||||||||||
| GEOSTATS |
G917-8 | 17.120 | 0.45 | 16 | 16.53 | 24 | 17.52 | 1.00 | ||||||||||||||||||||||
| GEOSTATS |
G917-9 | 12.140 | 0.40 | 50 | 11.86 | 0.47 | ||||||||||||||||||||||||
| GEOSTATS |
GLG304-1 | 0.154 | 0.017 | 19 | 0.15 | 0.00 | ||||||||||||||||||||||||
| GEOSTATS |
G319-5 | 3.920 | 0.12 | 103 | 3.98 | 0.10 | ||||||||||||||||||||||||
| GEOSTATS |
G919-6 | 2.330 | 0.08 | 33 | 2.27 | 0.12 | ||||||||||||||||||||||||
| Oreas |
OREAS 65A |
0.52 | 0.03 | 3 | 0.7 | 27 | 0.54 | 0.03 | ||||||||||||||||||||||
| Oreas |
OREAS 67A |
2.238 | 0.1 | 40 | 2.22 | 9 | 2.21 | 0.07 | ||||||||||||||||||||||
| Oreas |
61D | 4.760 | 0.14 | 25 | 4.82 | 0.15 | ||||||||||||||||||||||||
| Oreas |
62C | 8.790 | 0.21 | 22 | 9.10 | 0.42 | ||||||||||||||||||||||||
| Rocklabs |
SE-101 | 0.606 | 0.01 | 39 | 0.77 | 2 | 0.62 | 0.01 | ||||||||||||||||||||||
| Rocklabs |
SJ80 | 2.656 | 0.06 | 9 | 2.55 | |||||||||||||||||||||||||
| Rocklabs |
SK94 | 3.899 | 0.23 | 41 | 3.81 | 5 | 3.85 | 0.04 | ||||||||||||||||||||||
| Rocklabs |
SL76 | 5.960 | 0.12 | 25 | 5.82 | 8 | 5.86 | 0.19 | ||||||||||||||||||||||
| Rocklabs |
SN75 | 8.671 | 0.63 | 11 | 8.78 | 1 | 8.63 | |||||||||||||||||||||||
| Rocklabs |
SP73 | 18.170 | 0.37 | 7 | 18.03 | 7 | 18.18 | 0.26 | ||||||||||||||||||||||
| Rocklabs |
SQ88 | 39.723 | 0.59 | 22 | 37.69 | 23 | 38.49 | 0.35 | ||||||||||||||||||||||
| Rocklabs |
HISILP3 | 12.244 | 0.246 | 1 | 12.06 | |||||||||||||||||||||||||
Source: SRK, 2022
|
BP/KD |
May 2022 |
| SRK Consulting (U.S.), Inc. NI 43-101 Technical Report – Segovia 2021 PFS Update |
Page 113 |
| Table 11-4: | Summary of Certified Reference Material Produced by GEOSTATS, Rocklabs and Oreas and Submitted by GCM Mines in Drilling/Channel Submissions to External Laboratories in 2020 and 2021 |
| 2020 Submissions | 2021 Submissions |
|||||||||||||||||||||||||||||
| Supplier | Material ID | Certified Value |
Standard Deviation |
Count | Average Assay Au (g/t) |
Count | Average Assay Au (g/t) |
Standard Deviation |
||||||||||||||||||||||
| GEOSTATS |
G312-4 | 5.3 | 217 | 5.22 | 0.1 | 486 | 5.26 | 0.11 | ||||||||||||||||||||||
| GEOSTATS |
G315-2 | 0.98 | 96 | 0.99 | 0.04 | 181 | 0.99 | 0.03 | ||||||||||||||||||||||
| GEOSTATS |
G315-8 | 9.93 | 0.32 | 212 | 10.11 | 0.27 | ||||||||||||||||||||||||
| GEOSTATS |
G914-10 | 10.26 | 278 | 10.25 | 0.2 | 38 | 10.28 | 0.12 | ||||||||||||||||||||||
| GEOSTATS |
G914-6 | 3.21 | 318 | 3.23 | 0.13 | 122 | 3.22 | 0.06 | ||||||||||||||||||||||
| GEOSTATS |
G915-2 | 4.98 | 90 | 5.13 | 0.12 | 44 | 5.11 | 0.15 | ||||||||||||||||||||||
| GEOSTATS |
G915-5 | 17.95 | 7 | 17.62 | 0.70 | |||||||||||||||||||||||||
| GEOSTATS |
G915-6 | 0.67 | 18 | 0.66 | 0.04 | 10 | 0.74 | 0.03 | ||||||||||||||||||||||
| GEOSTATS |
G916-5 | 19.92 | 0.69 | 27 | 19.23 | 0.79 | ||||||||||||||||||||||||
| GEOSTATS |
G916-6 | 30.94 | 90 | 30.67 | 0.49 | 115 | 30.55 | 2.04 | ||||||||||||||||||||||
| GEOSTATS |
G916-8 | 3.2 | 0.12 | 81 | 3.23 | 0.06 | ||||||||||||||||||||||||
| GEOSTATS |
G917-1 | 48.52 | 18 | 48.75 | 0.88 | |||||||||||||||||||||||||
| GEOSTATS |
G917-8 | 17.12 | 65 | 17.22 | 0.75 | 97 | 17.43 | 0.59 | ||||||||||||||||||||||
| GEOSTATS |
G919-6 | 2.33 | 0.08 | 32 | 2.30 | 0.08 | ||||||||||||||||||||||||
| RockLabs |
SP73 | 18.17 | 32 | 18.14 | 0.40 | |||||||||||||||||||||||||
| RockLabs |
SQ87 | 30.87 | 22 | 30.48 | 1.10 | |||||||||||||||||||||||||
| RockLabs |
SQ88 | 39.723 | 7 | 39.81 | 0.96 | |||||||||||||||||||||||||
Source: SRK, 2022
Within the exploration submissions, SRK has focused on the six standards have been most heavily used in 2021: G915-6, G917-6, G315-8, G319-5, G311-8 and G318-4. Figure 11-4 shows the performance of these selected CSRMs. In general, samples submitted as standards return Au values within two standard deviations of their certified value. When a standard fails (by falling outside GCM’s failure criteria of three standard deviations from the certified value), it is flagged by GCM personnel, reported to the laboratory, and submitted for re-assay. Overall, SRK notes that the majority of standards fall below or are very close to the expected Au value, with some failures of the +-3SD limits in G915-6 and G917-6. It is observed as well that in early 2021 the results for the G915-6 are closer and some consecutive values above the +2SD failures which were re-assayed but represents a problem which has to be evaluated with the laboratory.
In the mine submissions SRK has reviewed all CRM’s but presents the results from the top five submissions (G914-6, G315-8, G312-4, G916-6 and G315-2) which are shown in Figure 11-5. The results all report within the two standard deviation lines, with the only minor comment is that the grade is trending lower in G915-2.
|
BP/KD |
May 2022 |
| SRK Consulting (U.S.), Inc. NI 43-101 Technical Report – Segovia 2021 PFS Update |
Page 114 |
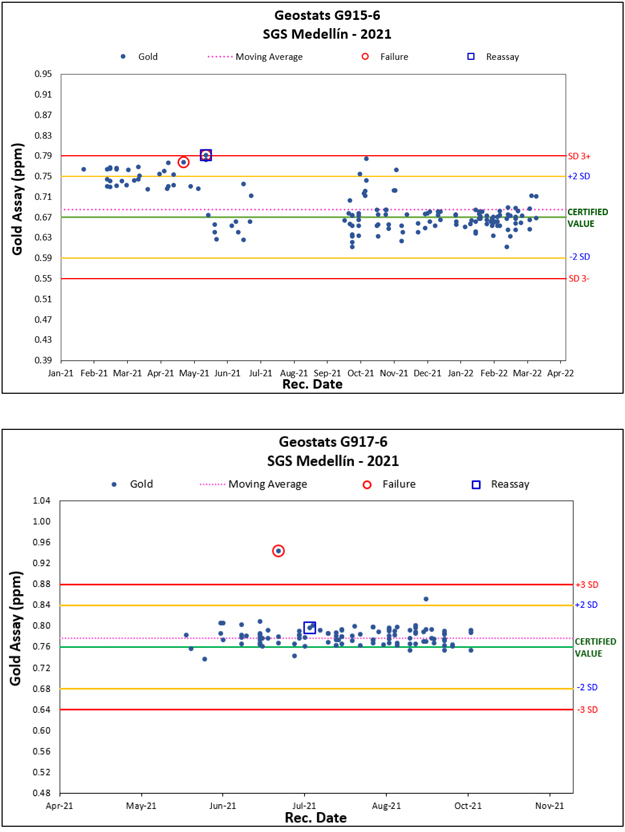
|
BP/KD |
May 2022 |
| SRK Consulting (U.S.), Inc. NI 43-101 Technical Report – Segovia 2021 PFS Update |
Page 115 |
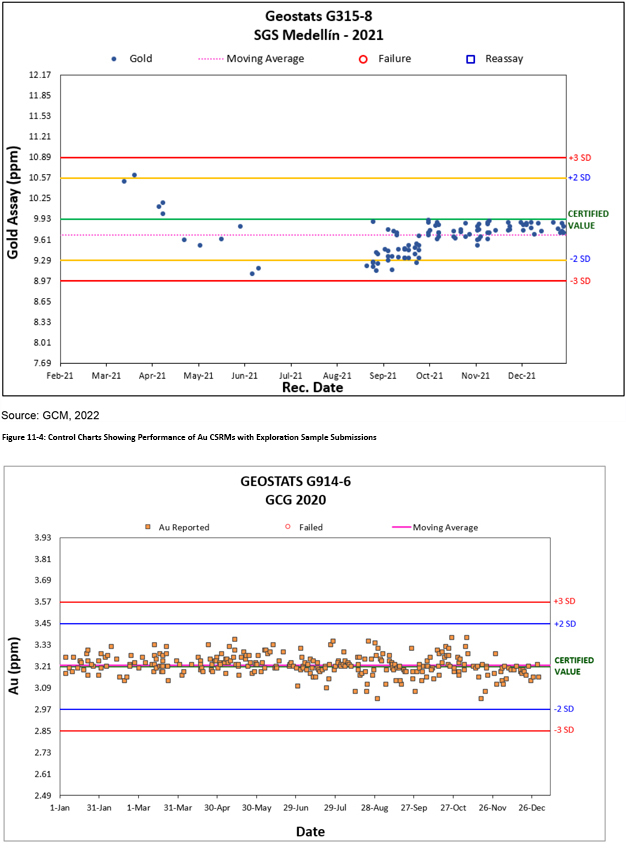
|
BP/KD |
May 2022 |
| SRK Consulting (U.S.), Inc. NI 43-101 Technical Report – Segovia 2021 PFS Update |
Page 116 |
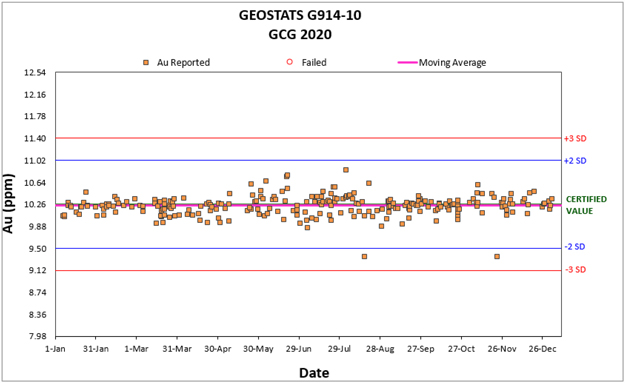
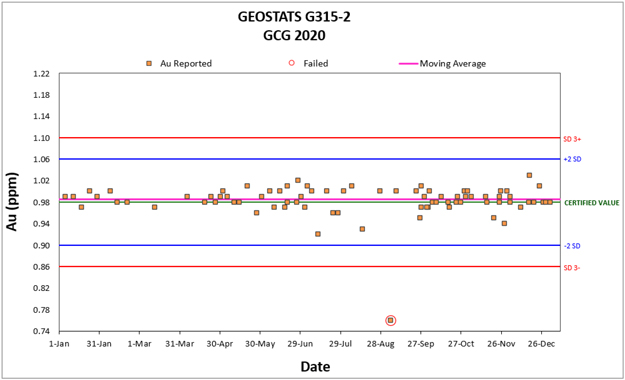
|
BP/KD |
May 2022 |
| SRK Consulting (U.S.), Inc. NI 43-101 Technical Report – Segovia 2021 PFS Update |
Page 117 |
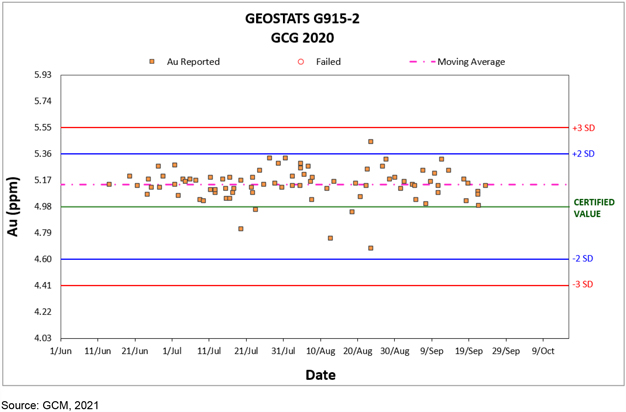
Figure 11-5: Control Charts Showing Performance of Au CSRMs with Mine Sample Submissions
| 11.5.2 | Blanks |
Coarse quartz brought in from Medellín, and a certified fine-grained blank from Rocklabs are included in the sample stream. Blank samples were submitted with both mine drill core (Figure 11-6) and mine pulps (Figure 11-7). Through 2021, 1,321 blanks were submitted with mine pulps at the GCM laboratory, which reported no errors, with seven samples reporting measurable results above the 2.5x detection limit. Through 2021, 1,321 coarse blanks were submitted with mine samples at the GCM laboratory, which reported 2 failures (Above 5x DL). SRK has reviewed the results from the blank sample analysis and has determined that there is little evidence of sample contamination at SGS Colombia S.A. or GCM’s facilities. For SGS there are not evidences of contamination the 154 blank controls sent.
SRK has also reviewed the submissions of exploration samples submitted to SGS Colombia S.A. to review the laboratory performances. The results from the submission of fine coarse blanks (which are testing the complete sample preparation process), are shown in Figure 11-9, for all 2021 submissions. SRK has also conducted the review on a time (submission date) basis, which indicated that four coarse blank samples reported above 5x detection limits between February and March of 2021 for SGS, and an additional two samples reporting above 3x detection limits for controls sent to which equates to approximately 0.3% of the 2021 coarse blank submissions. SRK notes that even with these failures, the evidence of contamination is limited at SGS Colombia S.A..
|
BP/KD |
May 2022 |
| SRK Consulting (U.S.), Inc. NI 43-101 Technical Report – Segovia 2021 PFS Update |
Page 118 |
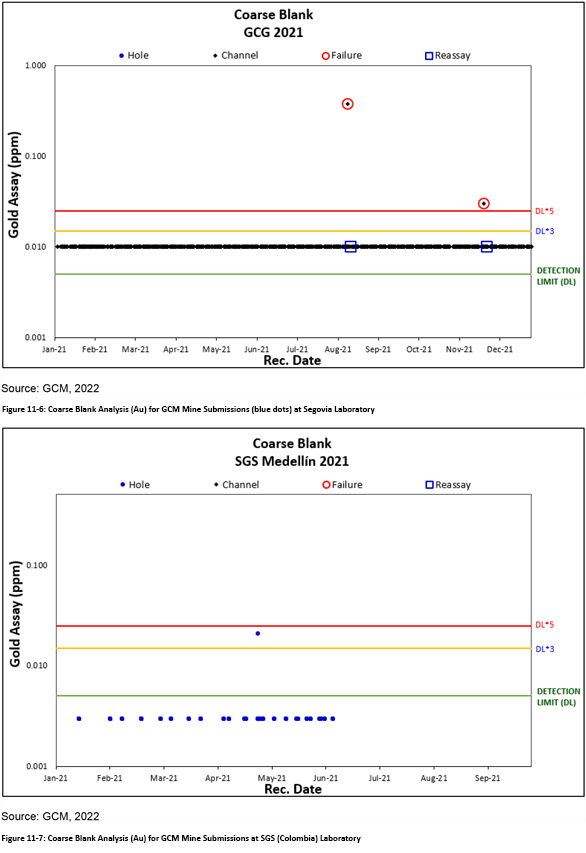
|
BP/KD |
May 2022 |
| SRK Consulting (U.S.), Inc. NI 43-101 Technical Report – Segovia 2021 PFS Update |
Page 119 |
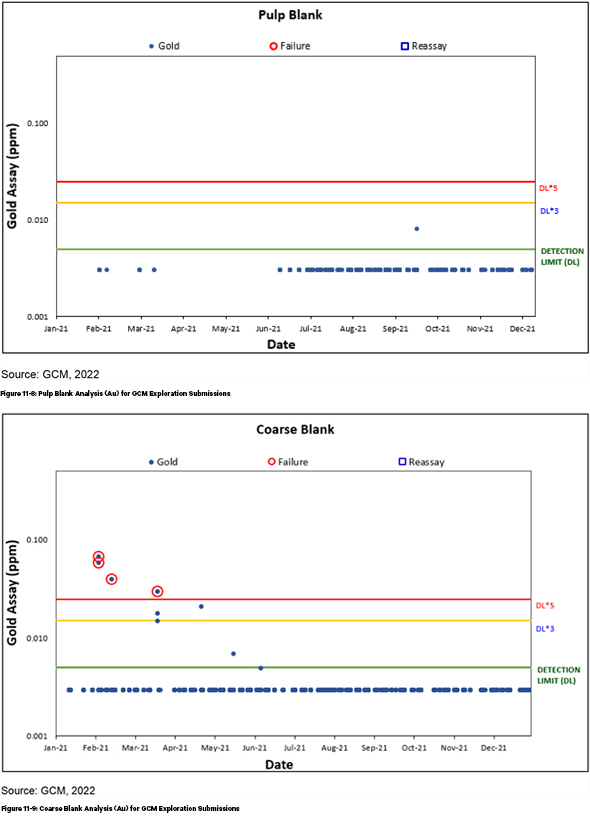
|
BP/KD |
May 2022 |
| SRK Consulting (U.S.), Inc. NI 43-101 Technical Report – Segovia 2021 PFS Update |
Page 120 |
| 11.5.3 | Duplicates |
GCM uses a combination of field duplicates and third-party duplicates that are inserted into the sample stream at Segovia to evaluate the ability of a third-party laboratory to repeat the assay results from the remaining sample. Field duplicates are generated by submitting 1/4 core or splitting a channel sample by rock saw or hammer. Third-party laboratory duplicates are generated by the laboratory by generating new samples from both reject and pulp material. The new pulp is created using the rejection material of the original sample. This new pulp is tested, and the results are compared with the results of the original sample assayed.
In 2021, 76 channel coarse duplicates, 75 channel pulp duplicates, 71 channel field duplicates (taken adjacent to the main sample), 388 drilling coarse duplicates and 404 drilling pulp duplicates were inserted into the routine sample submissions by the exploration department and assayed for Au to ensure laboratory precision. Core duplicates were not inserted in 2021
The field duplicates collected by the mine geology department in Carla display a low correlation coefficient and a reasonably wide scatter (Figure 11-10), which reflects the heterogeneity of the mineralization in Carla.
The core duplicates collected by the exploration and mine geology departments show low correlation coefficient in the case of the mine geology sampling and wide scatter in both cases (Figure 11-11).
In the context of a deposit with noted high geological variability, these results can be expected, although following and reviewing the procedures of channel sampling and core sampling is and aspect to review the be sure that the quality of the samples is maintained. SRK recommends that individual high grades should be treated with caution.
SRK considers the correlation between the two dataset represents the high variability of the deposit. SRK recommends due to the high variability switching to 1/2 core samples may improve the correlation. Overall SRK recommends continuation of the GCM sampling protocols and the continuous review and supervision of the channel and core sampling activities.
|
BP/KD |
May 2022 |
| SRK Consulting (U.S.), Inc. NI 43-101 Technical Report – Segovia 2021 PFS Update |
Page 121 |
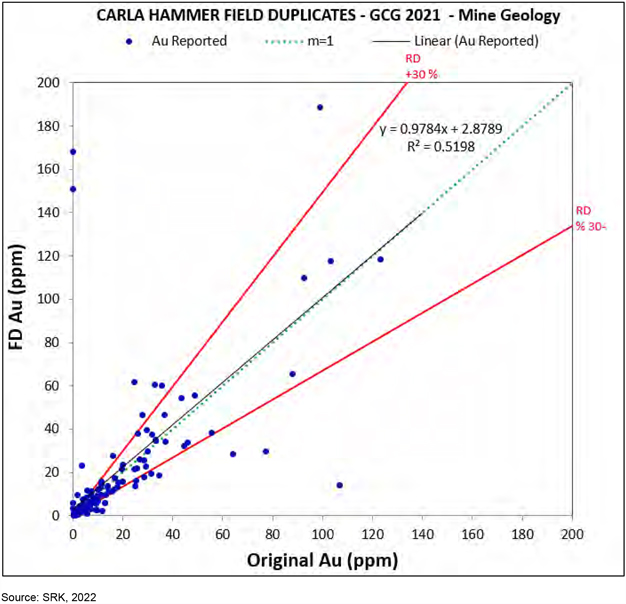
Figure 11-10: Au Dispersion Plots for Segovia Mine Geology Field Duplicates – Carla
|
BP/KD |
May 2022 |
| SRK Consulting (U.S.), Inc. NI 43-101 Technical Report – Segovia 2021 PFS Update |
Page 122 |
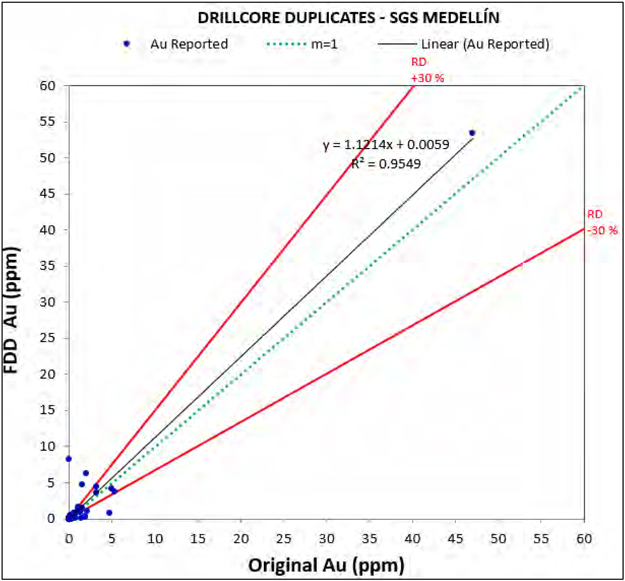
|
BP/KD |
May 2022 |
| SRK Consulting (U.S.), Inc. NI 43-101 Technical Report – Segovia 2021 PFS Update |
Page 123 |
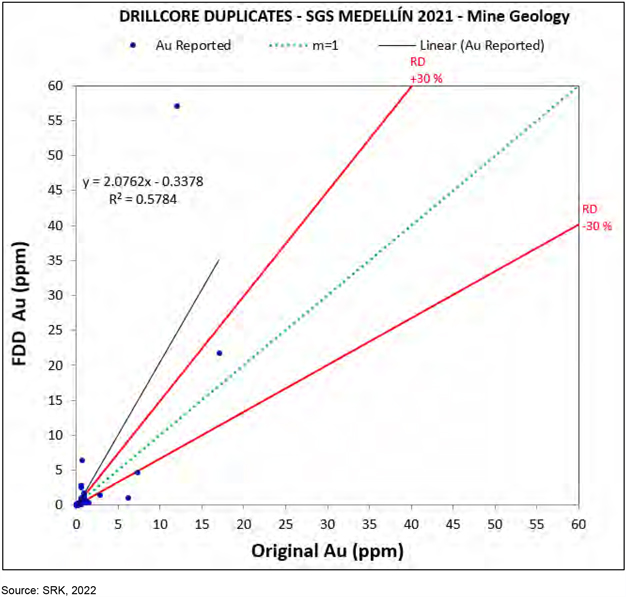
| Figure 11-11: | Au Dispersion Plots for Segovia Exploration (top image) and Mine Geology (bottom image) Drill Core Duplicates |
In 2021, coarse rejects from previous samples were submitted in both the drill core and channel samples submissions to the laboratory.
The reject duplicates show an improvement compared to the field duplicates in terms of the scatter (Figure 11-12). A review of the mean grades for original and duplicates respectively are 3.27 g/t and 3.27 g/t Au for core and mine geology field duplicates (a 0.2% difference), and 5.20 g/t and 5.21 g/t Au for exploration core duplicates (a 0.25% difference). There is a strong correlation when reviewing the two trend lines for the populations with a reported correlation above R2=0.99 for the core and channel submissions.
In 2021, pulp rejects from previous samples were submitted in both the drillcore and channel samples submissions to the laboratory.
|
BP/KD |
May 2022 |
| SRK Consulting (U.S.), Inc. NI 43-101 Technical Report – Segovia 2021 PFS Update |
Page 124 |
The pulp duplicates show best correlation of the duplicate sample types which is expected as the samples have been homogenized prior to splitting the pulps as part of the sample preparation process (Figure 11-13). There is a strong correlation with the correlation coefficient above R2=0.99 for the pulp duplicates sent by the exploration and mine geology departments.
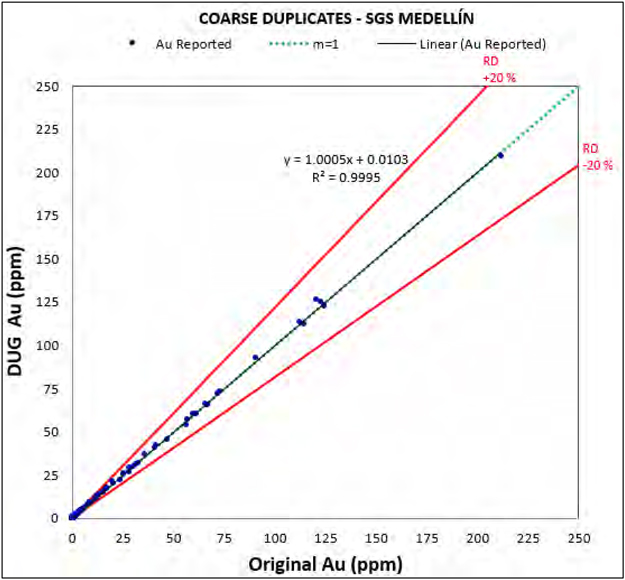
|
BP/KD |
May 2022 |
| SRK Consulting (U.S.), Inc. NI 43-101 Technical Report – Segovia 2021 PFS Update |
Page 125 |
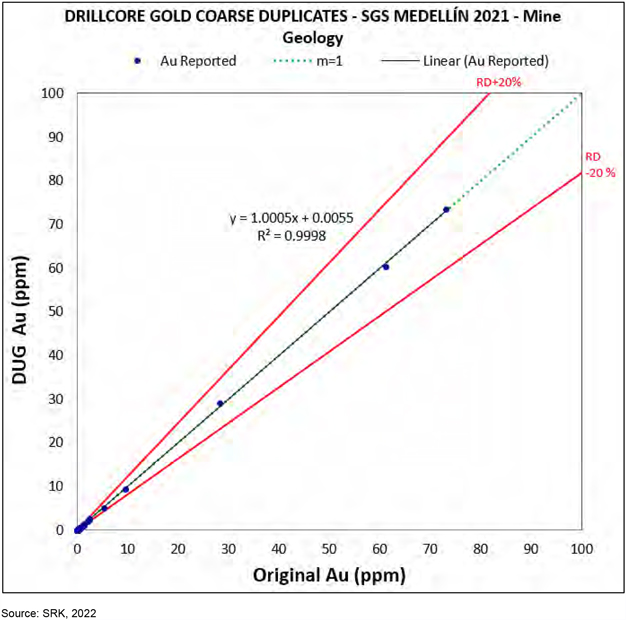
| Figure 11-12: | Au Dispersion Plots for Segovia Exploration (top image) and Mine Geology (bottom image) Reject Duplicates |
|
BP/KD |
May 2022 |
| SRK Consulting (U.S.), Inc. NI 43-101 Technical Report – Segovia 2021 PFS Update |
Page 126 |
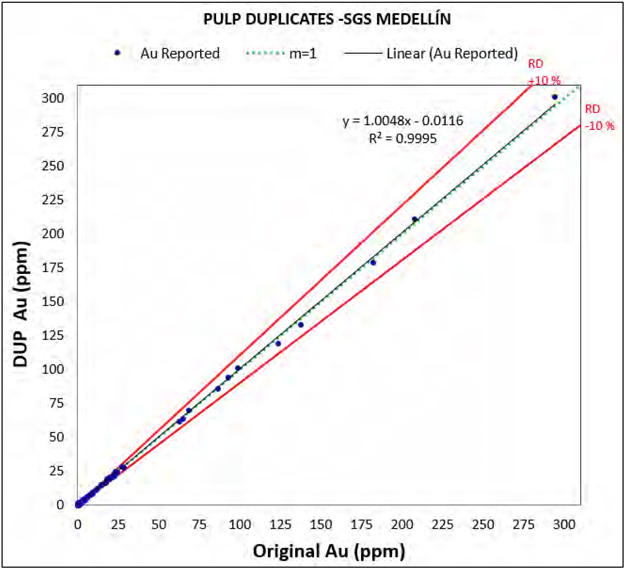
|
BP/KD |
May 2022 |
| SRK Consulting (U.S.), Inc. NI 43-101 Technical Report – Segovia 2021 PFS Update |
Page 127 |
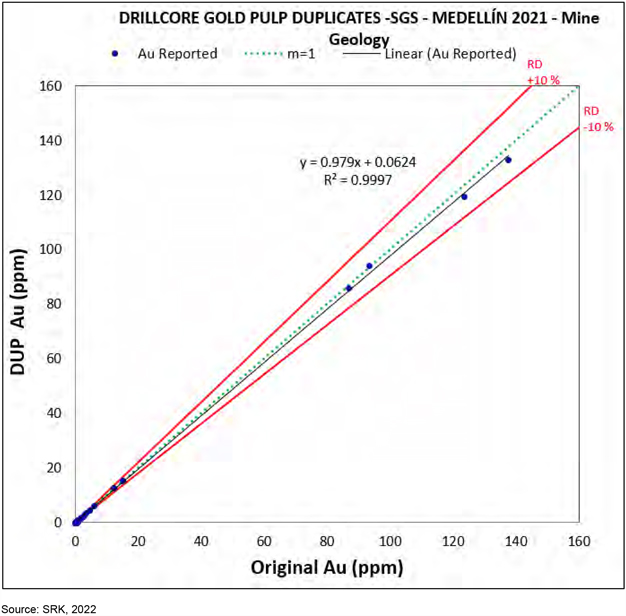
| Figure 11-13: | Au Dispersion Plots for Segovia Exploration (top image) and Mine Geology (bottom image) Pulp Duplicates Including |
| 11.5.4 | Umpire Laboratory Checks |
The results of the 2021 umpire laboratory checks sent by the exploration department were not received by SRK and at the time of reporting and this item remains unchecked. The current status is that selected batches have been sent to SGS Colombia S.A. with some additional batches also tested at ALS (preparation in Medellín and analysis in Peru).
The mine geology department sent 2nd laboratory checks to SGS (GCG is the primary laboratory) and the results until March 2021 were received by SRK. The information for the rest of 2021 were not received.
|
BP/KD |
May 2022 |
| SRK Consulting (U.S.), Inc. NI 43-101 Technical Report – Segovia 2021 PFS Update |
Page 128 |
The selected samples were sourced from both reject and pulp material from channel sampling of underground drives and pillars. Samples were selected on a batch basis. GCM completed a check analysis program on selected rejects and pulps from the operating mines during 2021. A total of 726 reject duplicates and 788 pulp duplicates were submitted to SGS Colombia S.A. for checks. A total of 428 pulp duplicates and 425 reject duplicates were analyzed at ALS. The results of the submissions are shown in Figure 11-14 and Figure 11-15 for SGS and ALS respectively. The results for the pulp duplicates at ALS (Colombia) have a correlation coefficient of R2 = 0.95. The controls sent by the mine geology team show some dispersion and correlations are reasonable for all the submissions (in excess of R2=0.82). Comparisons of the mean grades in the sample populations are reasonable with the highest variability noted in the pulp duplicates at SGS Colombia S.A ., influenced by some extreme grade material.
SRK recommends continuing its submission but to modify the procedure so that there is continuous evaluation of the laboratory performance on a quarterly basis. This will avoid situations with large batches being processes and delayed reporting, but also allow the geologist to identify any potential issues and be more proactive.
|
|
||||||||||||||
| All Data | Au Original |
Au Reassay |
||||||||||||
|
Mean |
|
13.16 |
|
|
14.12 |
|
7.32%
|
|||||||
|
Median |
|
3.30 |
|
|
3.48 |
|
||||||||
|
Mode |
|
0.64 |
|
|
1.13 |
|
||||||||
|
Standard Deviation |
|
27.61 |
|
|
30.83 |
|
||||||||
|
Sample Variance |
|
762.25 |
|
|
950.58 |
|
||||||||
|
Kurtosis |
|
30.98 |
|
|
27.64 |
|
||||||||
|
Skewness |
|
4.74 |
|
|
4.65 |
|
||||||||
|
Range |
|
281.47 |
|
|
282.21 |
|
||||||||
|
Minimum |
|
0.01 |
|
|
0.01 |
|
||||||||
|
Maximum |
|
281.48 |
|
|
282.22 |
|
||||||||
|
Sum |
|
10,369.44 |
|
|
11,128.25 |
|
||||||||
|
Count
|
|
788.00
|
|
|
788.00
|
|
||||||||
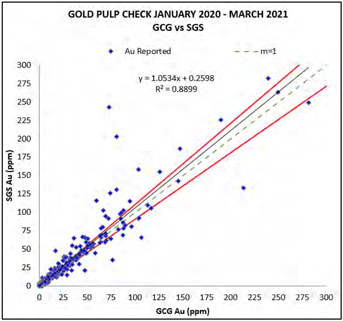
|
BP/KD |
May 2022 |
| SRK Consulting (U.S.), Inc. NI 43-101 Technical Report – Segovia 2021 PFS Update |
Page 129 |
|
|
||||||||||||||
| All Data | Au Original |
Au Reassay |
||||||||||||
|
Mean |
|
13.35 |
|
|
14.20 |
|
6.39%
|
|||||||
|
Median |
|
3.38 |
|
|
3.46 |
|
||||||||
|
Mode |
|
0.39 |
|
|
0.76 |
|
||||||||
|
Standard Deviation |
|
27.43 |
|
|
31.87 |
|
||||||||
|
Sample Variance |
|
752.64 |
|
|
1,015.96 |
|
||||||||
|
Kurtosis |
|
32.07 |
|
|
30.81 |
|
||||||||
|
Skewness |
|
4.78 |
|
|
4.95 |
|
||||||||
|
Range |
|
281.47 |
|
|
291.19 |
|
||||||||
|
Minimum |
|
0.01 |
|
|
0.00 |
|
||||||||
|
Maximum |
|
281.48 |
|
|
291.19 |
|
||||||||
|
Sum |
|
9,692.12 |
|
|
10,311.70 |
|
||||||||
|
Count
|
|
726.00 |
|
|
726.00 |
|
||||||||
| Figure 11-14: | Comparison of Umpire Laboratory Check Analysis Between GCM Laboratory and SGS Colombia – 2020 – March 2021 – Mine Geology Department |
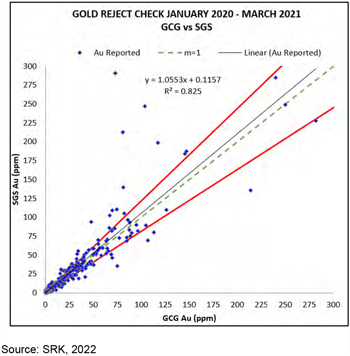
|
||||||||||||||
| All Data | Au Original |
Au Reassay |
||||||||||||
|
Mean |
|
1.57 |
|
|
1.48 |
|
-5.86%
|
|||||||
|
Median |
|
0.14 |
|
|
0.13 |
|
||||||||
|
Mode |
|
0.003 |
|
|
0.003 |
|
||||||||
|
Standard Deviation |
|
6.72 |
|
|
6.08 |
|
||||||||
|
Sample Variance |
|
45.15 |
|
|
37.00 |
|
||||||||
|
Kurtosis |
|
57.14 |
|
|
74.64 |
|
||||||||
|
Skewness |
|
7.25 |
|
|
7.98 |
|
||||||||
|
Range |
|
63.92 |
|
|
65.90 |
|
||||||||
|
Minimum |
|
0.003 |
|
|
0.003 |
|
||||||||
|
Maximum |
|
63.92 |
|
|
65.90 |
|
||||||||
|
Sum |
|
283.21 |
|
|
266.62 |
|
||||||||
|
Count
|
|
180 |
|
|
180 |
|
||||||||
| Figure 11-15: | Comparison of Umpire Laboratory Check Analysis Between GCM Laboratory and ALS Medellín – 2020 – Exploration Department |
|
BP/KD |
May 2022 |
| SRK Consulting (U.S.), Inc. NI 43-101 Technical Report – Segovia 2021 PFS Update |
Page 130 |
Overall, it is the QP’s opinion that the QA/QC program conducted by GCM to be in line within industry best practices and the results indicate no major issues in the laboratories used. The key recommendations involve increasing the frequency of the umpire laboratory checks.
|
BP/KD |
May 2022 |
| SRK Consulting (U.S.), Inc. NI 43-101 Technical Report – Segovia 2021 PFS Update |
Page 131 |
| 12 | Data Verification |
| 12.1.1 | GCM Verification |
GCM has undertaken a number of verification sampling programs to date for the historic underground channel sampling, including the initial check sampling, which concluded a low degree of confidence in the results from the historic mine laboratory (SRK, 2012; previous NI43-101 SRK Mineral Resource Report, dated April 2012).
As a result, it was recommended to increase the confidence in the sampling by increasing the underground mine/channel database completed by GCM, inclusive of further verification sampling. On the basis of the subsequent verification (2011 to 2012) of the sampling databases (which indicated reasonable sample integrity), SRK used the combined historical and more recent GCM data for the previous MRE.
Additional channel sampling completed at the operating mines between 2013 to 2021, and infill drilling exploration programs have enabled further verification of the historic database, which (whilst indicating a variable correlation) has increased the geological confidence within the re-sampled areas, as discussed in Section 11.5.
Further key verification work completed by GCM during the latest phase of exploration included the following:
| • | Infill drilling of the historic drillhole database at Sandra K |
| • | Data capture and cross checking of historical database of historical plans for the Cogote Mine |
| • | Survey and mapping of underground workings, at all mines |
| • | Validation of the Carla database, including geotechnical re-logging and assaying of previously (selectively) non-sampled core within the mineralized zone, as recommended by SRK |
| • | Anomalous GCM downhole surveys were resurveyed by an external contractor (Weatherford) and all GCM collars resurveyed by a land survey Company (SIGMA Ingenieria) |
| 12.1.2 | Verifications by SRK |
In accordance with NI 43-101 guidelines, SRK visited the Project from November 27 to 30, 2016, February 10, 2017, April 11 to 13, 2018, December 2 to 7, 2020 and January 25 to 28, 2022. The main purpose of the site visits was to:
| • | Observe the extent of the exploration work completed to date |
| • | Inspect the core drilling and underground channel sampling completed during the latest phase of exploration |
| • | In 2020, El Silencio, Carla and Sandra K mines were visited, including the areas where new geological interpretations have been included in the updated geological model. (SRK previously visited Providencia). |
| • | In 2022, the focus of the underground visit was to El Silencio mine where the mine geology team presented the reinterpretation of the area of the veins including veta manto and the 1040, 1180 and 1150 splays. |
| • | Complete an audit of sampling procedures underground |
| • | Review updated core logging protocols and QA/QC used by the exploration and mine geology teams |
|
BP/KD |
May 2022 |
| SRK Consulting (U.S.), Inc. NI 43-101 Technical Report – Segovia 2021 PFS Update |
Page 132 |
| • | The onsite laboratory was not visited as part of the latest site inspection. In previous years, SRK completed the audit of the laboratory onsite. |
| • | Inspect the existing and the new core logging and sample storage facilities. |
| • | Discuss updated geological and structural interpretations with the exploration and mine geology teams, including the recognition of the new geological interpretation of some veins in the underground workings in Sandra K, Carla and El Silencio. |
| • | Conducted remote meetings with key GCM staff to review the geological database and progress on updating the 3D spatial locations with the new mine survey information. |
SRK completed a phase of data validation on the digital sample database supplied by GCM which included but was not limited to the following:
| • | SRK completed a two-week meeting with a senior GCM geologist in charge of the Segovia geological information in the SRK offices in Denver in December 2019 and February 2020. During these meetings the main focus was to check and correct elevation issues and provide training to GCM on how to validate and model the veins using Leapfrog® on a regular basis. |
| • | The processes and data methods used from this meeting were reviewed as part of the on- going database reviews during the current update. |
| • | Search for sample overlaps or significant gaps in the interval tables, duplicate or absent samples, errors in the length field, anomalous assays and survey results. GCM’s geological team was notified of any issues that required correction or further investigation. No material issues were noted in the final sample database. |
| • | Excluded vein samples that are flagged as having the footwall or hanging wall of the structure continuing into the floor or roof of the underground drive (and therefore effectively representing incomplete samples). The exposed hanging wall or footwall (point) of the flagged vein sample was used to guide the appropriate surface of the geological model, however such samples were excluded from all statistical analyses and the resource estimate |
| • | Confirmation of historic assays digitized from 2D mine plans for the Cogote Mine. Due to the historic method of recording channel sample grade in pennyweights (dwts) and length in inches, SRK cross-checked from original mine plans that the correct conversions had been used (to reflect g/t Au and length in m). Minor adjustments to the survey were also reviewed to reflect corrections to a standard datums used for the Project. SRK was satisfied that the data capture accurately reflected the original maps and database. |
| • | In 2021, the geological modeling process in Leapfrog® was reviewed with the collaboration of the exploration staff geologist, to clarify the interpretation of faults and the small new vein splays that have been interpreted based on historical information and new field mapping. |
| • | The area with the most significant changes in the El Silencio model were visited and validation underground visually by SRK. |
SRK was able to verify the quality of geological and sampling information and develop an interpretation of gold grade distributions appropriate to use in the Mineral Resource model.
|
BP/KD |
May 2022 |
| SRK Consulting (U.S.), Inc. NI 43-101 Technical Report – Segovia 2021 PFS Update |
Page 133 |
| 12.2 | Limitations |
SRK did not review 100% of the analyses from the analytical certificates as part of this report. In addition, in previous years SRK reviewed analyses from certificates that are likely to have been reanalyzed either as a part of the recent resampling program, or over the normal course of the previous six years of work. SRK has not completed site inspections to all levels of the mining areas but has focused on the areas operated by GCM at lower levels.
| 12.3 | Opinion on Data Adequacy |
SRK considers that in the recent years the geological interpretation, data collection and data management has improved at El Silencio, Providencia and Sandra K mines. In 2021, GCM completed a reinterpretation of the coding for the channel sampling to account for more veins and splays of the main veins (VEM, NAL, 1040, 1180 and 1150 splays.), which included information from new mapping, historical information and the discussions between the exploration and mine geological teams which is considered appropriated to improve the geological models and the understanding of the complexities of the mineralization controls, especially at El Silencio. Despite this, SRK still noted a number of areas at El Silencio where issues still occur. GCM provided a geological model that was reviewed by SRK.
In 2020, GCM completed an initial data capture of the historical database from the Cogote Mine which is in close proximity to the current Sandra K operation. The results of the data capture and original development plans were presented to SRK for review. At the time SRK conducted sufficient checks on the Cogote Mine historical data to confirm the database is representative of the historical maps.
In 2021, additional review and validation of the historic Cogote (which is considered as part of the Sandra K mine for the purpose of reporting) information (historical reports, paper maps, etc.) was performed by the GCM exploration team. The database was generated for the Cogote mine (Veins Patio [PAT] and Julio [JUL]) which included the transformation of information to the current coordinate system and correction of the units due to the historic method of recording channel sample grade in pennyweights (dwts) and length in inches which needed to be transformed to the metric units. SRK cross-checked from original mine plans that the correct conversions had been used (to reflect g/t Au and length in m). GCM updated the interpretation and the geological model with the transformed data. Drilling down dip of these structures has confirmed the presence of the vein to enable SRK to infer the geological continuity, but further validation sampling and drilling will be required to increase the confidence in these areas to a level sufficient to declared Indicated Mineral Resources.
Between 2019 and 2021, GCM reviewed and validated the Vera mine information (surveying and sampling) and completed three drilling campaigns. The results and the information were used to generate the geological model. GCM conducted a quantity of checks of the Vera information and considers that the information is representative and reflects the historical information.
SRK believes that the efforts should remain ongoing. While a lack of definition in portions of the 3D survey of the mines has limited the ability to accurately place all of the samples in their “True” location, it is SRK opinion that the general survey of the mines has improved (especially in new areas) and that the exploration and assay data is sufficiently reliable to support evaluation and classification of Mineral Resources in accordance with generally accepted CIM Estimation of Mineral Resource and Mineral Reserve Best Practices Guidelines (November, 2019). It is the QP’s opinion that the data provided is adequate for estimation of Mineral Resources and classification in the Indicated and Inferred categories.
|
BP/KD |
May 2022 |
| SRK Consulting (U.S.), Inc. NI 43-101 Technical Report – Segovia 2021 PFS Update |
Page 134 |
| 13 | Mineral Processing and Metallurgical Testing |
GCM ore is processed through the Maria Dama process plant utilizing a process flowsheet that includes crushing, grinding, gravity concentration, gold flotation, concentrate regrinding, concentrate cyanidation, Merrill-Crowe zinc precipitation and refining of both the zinc precipitate and gravity concentrate to produce a final gold/silver doré product.
The Maria Dama process plant has been in production for many years and the metallurgical requirements for processing ore from the Providencia, El Silencio and Sandra K mines are well understood. GCM is now planning to mine and process ore from the Carla vein, which is part of the Segovia complex and has conducted metallurgical testwork at SGS on a single test composite that was formulated from selected drillholes and intervals from the Carla vein. The metallurgical program included rougher flotation followed by cyanidation of the reground rougher concentrate using process conditions currently practiced at GCM’s Maria Dama process plant. In addition, whole-ore cyanidation and BWI tests were conducted. The results of this testwork demonstrated that the gold contained in ore from the Carla vein is highly recoverable using the process conditions currently in use at the Maria Dama process plant. Gold and silver recoveries were reported at about 95% and 77%, respectively. The results of this program are fully documented in SGS’s report, “An Investigation into Gold and Silver Recovery Using a Composite from Gran Colombia Gold’s Carla Vein”, April 24, 2020.
| 13.1 | Sample Source |
The Carla vein composite was formulated from 10 different drill core interval samples. As shown in Table 13-1.
a total of 20.45 m of 1⁄4 HQ core intervals were used to create a 43.7 kg composite with an estimated gold grade of 10.34 g/t Au, which is the expected average grade of the deposit. The location of each of the samples is shown in Figure 13-1.
Table 13-1: Drillholes Used for the Carla Vein Composite
| Sample No. | Drillhole | Interval (m) | Kg | Au (g/t) | ||||||
| 1 |
DS-0159 | 2.56 | 5.47 | 9.83 | ||||||
| 2 |
Drill-042 | 2.15 | 4.60 | 10.6 | ||||||
| 3 |
Drill-029 | 2.80 | 5.99 | 36.26 | ||||||
| 4 |
Drill-027 | 1.80 | 3.85 | 5.36 | ||||||
| 5 |
DS-0151 | 1.30 | 2.78 | 10.01 | ||||||
| 6 |
Drill-025 | 1.70 | 3.63 | 7.54 | ||||||
| 7 |
CA-ES-004 | 1.53 | 3.27 | 5.61 | ||||||
| 8 |
Drill-033 | 1.92 | 4.10 | 0.81 | ||||||
| 9 |
CA-ES-008 | 2.26 | 4.83 | 3.04 | ||||||
| 10 |
Drill-025 | 2.43 | 5.19 | 3.93 | ||||||
|
Total |
20.45 | 43.71 | 10.34 |
Source: GCM, 2020
|
BP/KD |
May 2022 |
| SRK Consulting (U.S.), Inc. NI 43-101 Technical Report – Segovia 2021 PFS Update |
Page 135 |
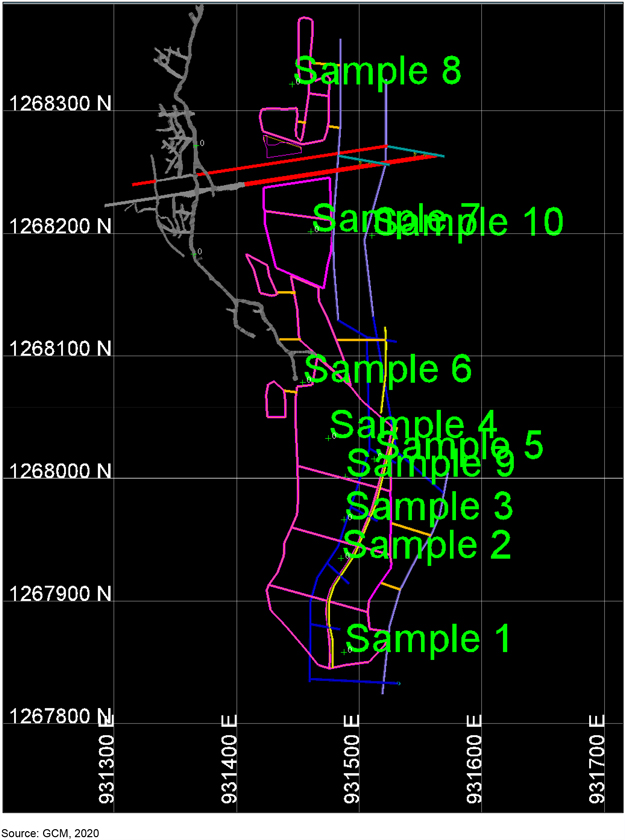
Figure 13-1: Location of Drill Core Intervals Used to Formulate the Carla Composite
|
BP/KD |
May 2022 |
| SRK Consulting (U.S.), Inc. NI 43-101 Technical Report – Segovia 2021 PFS Update |
Page 136 |
| 13.2 | Sample Characterization |
Head analyses for the Carla composite are shown in Table 13-2. Duplicate gold fire assays averaged
5.53 g/t Au and the calculated head analyses from the test program averaged 7.15 g/t Au, lower than the targeted composite grade of about 10 g/t Au. Silver averaged 5.7 g/t Ag. Total sulfur and sulfide sulfur were reported at 2.71% and 2.47%, respectively, indicating that sulfur occurs primarily as sulfide mineralization. Organic carbon was reported at <0.05% Corg, indicating that preg-robbing would likely not be an issue. Additionally, cyanide soluble copper was reported at <0.002%, indicating that copper would not present any issues during cyanidation.
Table 13-2: Carla Vein Composite Head Analyses
| Element | Segovia Comp. | |||
| Au 1 (g/t) |
6.2 | |||
| Au 2 (g/t) |
4.86 | |||
| Au Avg. (g/t) |
5.53 | |||
| Au Calc. (g/t) |
7.15 | |||
| Ag 1 (g/t) |
7 | |||
| Ag 2 (g/t) |
4.4 | |||
| Ag Avg. (g/t) |
5.7 | |||
| Ag Calc. (g/t) |
6 | |||
| AuCN (g/t) |
3.3 | |||
| Cu NaCN (%) |
<0.002 | |||
| S(%) |
2.71 | |||
| S= (%) |
2.47 | |||
|
SO4 (%) |
0.10 | |||
| S(o) (%) |
<0.05 | |||
| CT (%) |
1.04 | |||
| C(g) (%) |
<0.05 | |||
| TOC (%) |
<0.05 | |||
| CO3 (%) |
5.26 |
Source: SGS, 2020
Notes: Au assays = 30 g fire assay (to extinction)
Calc. values = Average values from test program
| 1.2 | Comminution Testwork |
A single BWI grindability test was performed using a 120 mesh (125 µm) closing screen. The test results are summarized in Table 13-3. The BWI value was 15.5 kWh/t, which indicates a medium range of hardness, which is somewhat harder than the ore typically processed at the Maria Dama process plant, which was reported to have a BWI of about 14 kWh/t.
Table 13-3: Summary of BWI Test on the Carla Test Composite
| Sample Name |
Mesh of Grind |
F80 (µm) |
P80 (µm) |
Gram per Revolution |
Work Index (kWh/t) |
Hardness Percentile | ||||||
| Segovia Comp. |
120 | 2,193 | 95 | 1.36 | 15.5 | 64 |
Source: SGS, 2020
| 13.3 | Flotation Testwork |
One 2 kg rougher/scavenger kinetic flotation test and one 10 kg bulk rougher/scavenger flotation test were completed using process conditions that are currently in use at the Maria Dama process plant, which include:
|
BP/KD |
May 2022 |
| SRK Consulting (U.S.), Inc. NI 43-101 Technical Report – Segovia 2021 PFS Update |
Page 137 |
| • Grind size: |
P80 105 µm | |
| • Slurry density: |
40% solids (w/w) | |
| • Pulp pH: |
7-8 (natural) | |
| • Retention time: |
||
|
○ Rougher: |
13.5 minutes (scaled to 5 minutes for lab testing) | |
|
○ Scavenger: |
68 minutes (scaled to 27 minutes for lab testing) | |
| • Reagent Additions: |
||
|
○ Copper sulfate: |
20 g/t | |
|
○ PAX: |
35 g/t | |
|
○ Aero 404: |
10 g/t | |
|
○ MX5160: |
10 g/t | |
| ○ Aerofroth-65: |
Stage-added as required | |
The results of these flotation tests are presented in Table 13-4. The initial 2 kg test (Test F-1) was a kinetic test which was completed to ensure the plant conditions would yield results similar the current plant operation. Gold and silver recoveries were 99.1% and 92.2%, respectively. The sulfur recovery was 96.8% and the mass pull was 12.8%, which was close to the target value (approximately 15% in the plant operation). Gold, silver and sulfur recovery versus mass % to the concentrate are shown in Figure 13-2. Upon completion of the kinetic test, a bulk rougher test (F-2) was completed under similar test conditions to provide sufficient concentrate sample for downstream leach tests. Gold and silver recovery during the bulk flotation test were 98.6% and 92.1%, respectively.
Table 13-4: Flotation Test Results on Carla Test Composite
| Test No. |
Ro Tail P80 µm |
Product |
Mass% |
Assays, g/t, % | % Distribution | |||||||||||||||||||||||||||||||||
| Au | Ag | S | Au | Ag | S | |||||||||||||||||||||||||||||||||
| F-1 |
|
94 |
|
Rougher Conc. 1 |
7.4 | 97.7 | 68.0 | 34.5 | 86.7 | 89.6 | 92 | |||||||||||||||||||||||||||
| Rougher Conc. 1-2 |
9.1 | 87.2 | 55.9 | 28.7 | 95.5 | 90.8 | 94.6 | |||||||||||||||||||||||||||||||
| Rougher Conc. 1-3 |
10.1 | 79.8 | 50.8 | 26.2 | 96.8 | 91.4 | 95.6 | |||||||||||||||||||||||||||||||
| Rougher Conc. 1-4 |
11.4 | 71.9 | 45.3 | 23.5 | 98.1 | 91.8 | 96.2 | |||||||||||||||||||||||||||||||
| Rougher Conc. 1-5 |
12.8 | 64.5 | 40.4 | 21 | 99.1 | 92.2 | 96.8 | |||||||||||||||||||||||||||||||
| Rougher Tailing |
87.2 | 0.09 | <0.5 | 0.10 | 0.9 | 7.8 | 3.2 | |||||||||||||||||||||||||||||||
|
Calculated Head |
100 | 8.32 | 5.60 | 2.77 | 100 | 100 | 100 | |||||||||||||||||||||||||||||||
| Direct Head |
5.53 | 5.70 | 2.71 | |||||||||||||||||||||||||||||||||||
| Rougher Conc |
14.2 | 39.9 | 35 | 19 | 98.6 | 92.1 | 97.2 | |||||||||||||||||||||||||||||||
| F-2 | 94 | Rougher Tailing |
85.8 | 0.10 | <0.5 | 0.09 | 1.4 | 7.9 | 2.8 | |||||||||||||||||||||||||||||
|
Calculated Head |
100 | 5.75 | 5.40 | 2.78 | 100 | 100 | 100 | |||||||||||||||||||||||||||||||
| Direct Head |
5.53 | 5.70 | 2.71 | |||||||||||||||||||||||||||||||||||
Source: SGS, 2020
|
BP/KD |
May 2022 |
| SRK Consulting (U.S.), Inc. NI 43-101 Technical Report – Segovia 2021 PFS Update |
Page 138 |
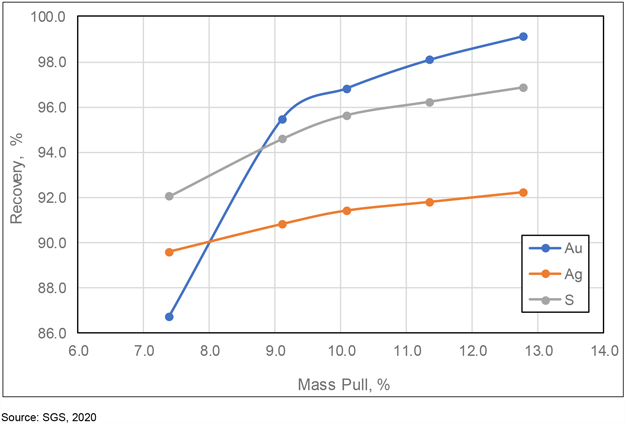
Figure 13-2: Gold, Silver and Sulfur Recovery Versus Mass % to Concentrate
| 13.4 | Flotation Concentrate Cyanidation Testwork |
Two identical cyanidation tests were completed on the flotation concentrate produced from the bulk flotation test. The flotation concentrate was reground to 80% passing (P80) 38 µm prior to standard bottle roll cyanidation tests. The cyanidation tests were completed using the following conditions:
| • Grind size target: |
P80 38 µm | |
| • Slurry density: |
30% solids (w/w) | |
| • Pulp pH: |
10.5-11 (maintained with lime) | |
| • Cyanide conc: |
1 g/L NaCN (maintained) | |
| • Retention time: |
96 hours (kinetic sub-samples at 8,12, 24, 36, 48 and 72 hours) | |
|
• Dissolved oxygen: |
5-8 mg/L (air sparged into the bottles to maintain) | |
| • Temperature: |
Ambient |
The results of the concentrate leach tests are shown in Table 13-5 and Table 13-6. Gold extraction from the flotation concentrate averaged 96.5% and silver extraction averaged 83.9%. As shown in Figure 13-3 and Figure 13-4, gold and silver extraction were essentially complete at 24 hours of leaching. Sodium cyanide consumption averaged 2.28 kg/t of concentrate (0.32 kg/t ore) and lime consumption averaged 2.93 kg/t of concentrate (0.42 kg/t ore).
|
BP/KD |
May 2022 |
| SRK Consulting (U.S.), Inc. NI 43-101 Technical Report – Segovia 2021 PFS Update |
Page 139 |
Table 13-5: Gold Extraction from Flotation Concentrate Produced from Carla Test Composite
| CN Test No. |
Feed Size P80 µm |
Reagent Cons. K g/t of CN Feed |
Au Extraction (%) |
Au Residue (g/t) | Au Head (g/t) | |||||||||||||||||||||||||
| NaCN | CaO | 8 h | 12 h | 24 h | 36 h | 48 h | 72 h | 96 h | A | C | Avg. | Calc. | Direct | |||||||||||||||||
| 3 | 33 | 2.65 | 2.57 | 85.3 | 90.6 | 95.8 | 95.6 | 95.9 | 95.6 | 96.4 | 1.37 | 1.31 | 1.34 | 37.3 |
39.9 | |||||||||||||||
| 4 |
31 |
1.90 | 3.28 |
81.4 |
88.4 |
95.6 |
96.8 |
97.6 |
97.2 |
96.6 |
1.29 |
1.19 |
1.24 |
36.8 | ||||||||||||||||
| 2.28 | 2.93 | 96.5 | 37.1 | |||||||||||||||||||||||||||
Source: SGS, 2020
Table 13-6: Silver Extraction from Flotation Concentrate Produced from Carla Test Composite
| CN Test No. |
Ag Extraction (%) | Ag Residue (g/t) | Ag Head (g/t) | |||||||||||||||||||||||||||||||||||||||||||||
| 8h | 12 h | 24 h | 36 h | 48 h | 72 h | 96 h | A | C | Avg. | Calc. | Direct | |||||||||||||||||||||||||||||||||||||
| 3 |
80 | 83.9 | 89.4 | 88.5 | 88.6 | 86.8 | 84.5 | 5.4 | 5.6 | 5.5 | 35.4 | 35 | ||||||||||||||||||||||||||||||||||||
| 4 | 71.7 | 78.6 | 84.1 | 86.2 | 84.7 | 84.2 | 83.2 | 5.5 | 6 | 5.75 | 34.2 | |||||||||||||||||||||||||||||||||||||
| 83.9 | 34.8 | |||||||||||||||||||||||||||||||||||||||||||||||
Source: SGS, 2020
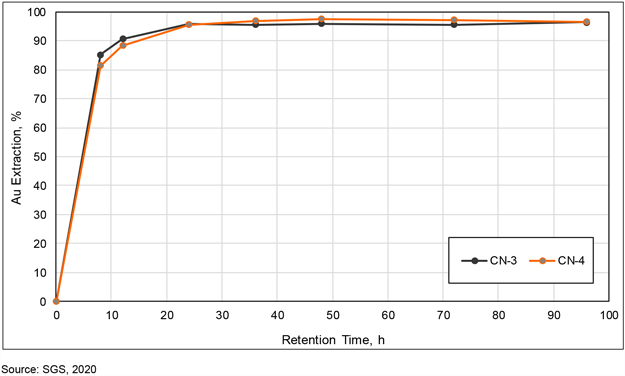
Figure 13-3: Gold Extraction from Flotation Concentrate Versus Leach Retention Time
|
BP/KD |
May 2022 |
| SRK Consulting (U.S.), Inc. NI 43-101 Technical Report – Segovia 2021 PFS Update |
Page 140 |
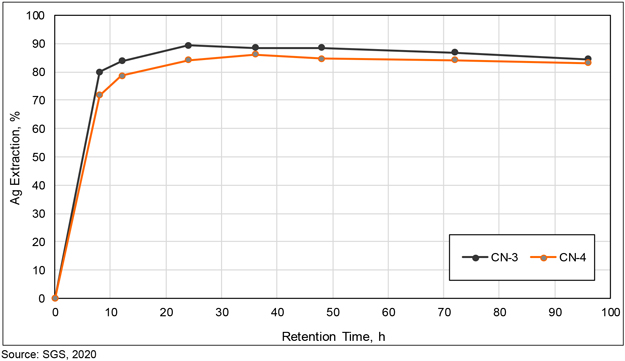
Figure 13-4: Silver Extraction from Flotation Concentrate Versus Leach Retention Time
| 1.3 | Whole-Ore Cyanidation Testwork |
For comparative purposes, two whole-ore cyanidation tests were conducted on the Carla test composite using the following test conditions:
| • Grind size target: |
P80 38 µm | |
| • Slurry density: |
45% solids (w/w) | |
| • Pulp pH: |
10.5 to 11 (maintained with lime) | |
| • Cyanide conc: |
1 g/L and 0.5 g/L NaCN (maintained) | |
| • Retention time: |
72 hours (kinetic sub-samples at 4, 8,12, 24, 36 and 48 hours) | |
| • Dissolved oxygen: |
5 to 8 mg/L (air sparged into the bottles to maintain) | |
| • Temperature: |
Ambient |
The results of the whole-ore cyanidation tests are shown in Table 13-7 and Table 13-8. Gold extraction was reported at 97.6% when leaching at a concentration of 1 g/L NaCN and 98.1% when leaching at 0.5 g/L NaCN. Silver extraction was reported at 91.4% and 92.9%, respectively. Cyanide consumption was 1.51 kg/t when leaching at a maintained cyanide concentration of 0.5 g/L NaCN and 2.62 kg/t at a maintained cyanide concentration of 1 g/L NaCN. Gold and silver extraction versus retention time are shown in Figure 13-5 and Figure 13-6. When leaching at a cyanide concentration of 0.5 g/L NaCN, gold extraction is complete after 24 hours and silver extraction is complete after 36 hours.
|
BP/KD |
May 2022 |
| SRK Consulting (U.S.), Inc. NI 43-101 Technical Report – Segovia 2021 PFS Update |
Page 141 |
Table 13-7: Whole-Ore Gold Extraction from Carla Test Composite
| CN Test No. |
Feed P80 |
Reagent Cons. kg/t of CN Feed |
Au Extraction (%) | Au Residue (g/t) | Au Head (g/t) | |||||||||||||||||||||||||
| NaCN | CaO | 4h | 8 h | 12 h | 24 h | 36 h | 48 h | 72 h | A | C | Avg. | Calc. | Direct | |||||||||||||||||
| 1 | 32 | 2.62 | 1.09 | 12.4 | 76.8 | 93 | 99.4 | 99 | 99.9 | 97.6 | 0.15 | 0.15 | 0.15 | 6.18 | 5.53 | |||||||||||||||
| 2 | 33 | 1.51 | 1.34 | 6.4 | 44.8 | 62.7 | 89 | 97.9 | 99.2 | 98.1 | 0.16 | 0.16 | 0.16 | 8.37 | ||||||||||||||||
Source: SGS, 2020
Table 13-8: Whole-Ore Silver Extraction from Carla Test Composite
| CN Test No. | Ag Extraction (%) | Ag Residue (g/t) | Ag Head (g/t) | |||||||||||||||||||||||||||||||||||||||||||||
| 4 h | 8 h | 12 h | 24 h | 36 h | 48 h | 72 h | A | C | Avg. | Calc. | Direct | |||||||||||||||||||||||||||||||||||||
| 1 |
13.3 | 70.1 | 82.7 | 89.5 | 93.2 | 91.5 | 91.4 | <0.5 | <0.5 | <0.5 | 5.8 | 5.7 | ||||||||||||||||||||||||||||||||||||
| 2 | 7.6 | 48.4 | 62.5 | 84.8 | 94.1 | 94.4 | 92.9 | 0.5 | 0.5 | 0.5 | 7.1 | |||||||||||||||||||||||||||||||||||||
Source: SGS, 2020
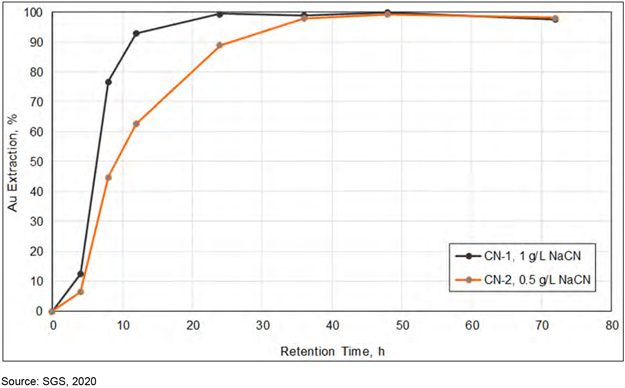
Figure 13-5: Whole-Ore Gold Extraction Versus Leach Retention Time
|
BP/KD |
May 2022 |
| SRK Consulting (U.S.), Inc. NI 43-101 Technical Report – Segovia 2021 PFS Update |
Page 142 |
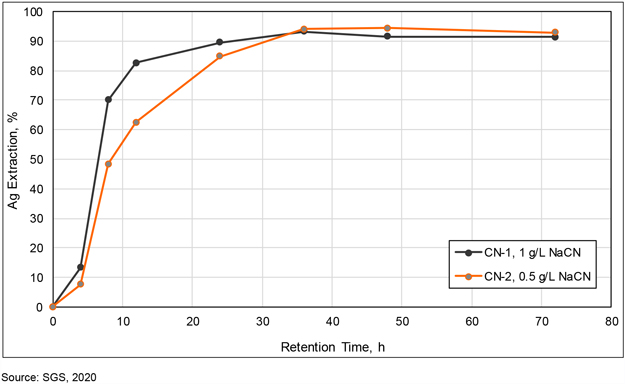
Figure 13-6: Whole-Ore Silver Extraction Versus Leach Retention Time
| 13.5 | Estimated Recovery |
Estimated gold and silver recovery from Carla ore is shown in Table 13-9. Laboratory testwork using conditions that are currently in use at the Maria Dama process plant indicate an overall gold recovery of 95.1% and an overall silver recovery of 77.3% after flotation and cyanidation of the reground flotation concentrate. SRK has reduced the reported laboratory recoveries by 2% in order to account for inherent plant inefficiencies. As such, overall gold and silver recoveries from Carla ore are projected at 93% and 75%, respectively. It is noted that the Carla test composite was somewhat lower grade than the average ore grade planned to be mined from the Carla vein. Actual gold and silver recoveries from higher grade Carla ore processed in the Maria Dama process plant could be incrementally higher.
Table 13-9: Estimated Gold and Silver Recovery from Carla Ore
| Rougher Flotation Recovery (%) |
Conc. Cyanidation Extraction (%) |
Overall Recovery Flot. + Cyanide |
Adjusted Overall Recovery |
|||||||||||||||||||||||||||
| Au | Ag | Au | Ag | Au | Ag | Au | Ag | |||||||||||||||||||||||
| 98.6 | 92.1 | 96.5 | 83.9 | 95.1 | 77.3 | 93 | 75 | |||||||||||||||||||||||
Sources: SGS and SRK, 2020
|
BP/KD |
May 2022 |
| SRK Consulting (U.S.), Inc. NI 43-101 Technical Report – Segovia 2021 PFS Update |
Page 143 |
| 14 | Mineral Resource Estimate |
The Mineral Resource statement presented herein represents the latest Mineral Resource evaluation prepared for the Project in accordance with NI 43-101.
The Mineral Resource model prepared by SRK utilizes 2,553 DDs, for a combined length 378,846 m, and 181,216 channel samples contained in the databases. The MRE was completed by Mr. Benjamin Parsons, MAusIMM (CP) an appropriate “independent qualified person” as this term is defined in NI 43-101. The effective date of the resource statement is December 31, 2021.
This section describes the MRE methodology and summarizes the key assumptions considered by SRK. In the opinion of SRK, the MRE reported herein is a reasonable representation of the global Mineral Resources found at the Project with the current level of sampling. The Mineral Resources have been estimated in conformity with generally accepted CIM “Estimation of Mineral Resource and Mineral Reserves Best Practices” guidelines and are reported in accordance with NI 43-101. Mineral Resources are not Mineral Reserves and do not have demonstrated economic viability. There is no certainty that all or any part of the Mineral Resource will be converted into Mineral Reserve.
The resource estimation methodology involved the following procedures:
| • | Database compilation and verification |
| • | Construction of 3D wireframe models for the fault networks and centerlines of mining development per vein |
| • | Definition of resource domains |
| • | Data conditioning (compositing and capping) for statistical analysis, geostatistical analysis |
| • | Variography |
| • | Block modeling and grade interpolation |
| • | Resource classification and validation |
| • | Assessment of “reasonable prospects for eventual economic extraction” and selection of appropriate reporting cut-off grades (CoG) |
| • | Preparation of the Mineral Resource statement |
SRK has been supplied with an export of the geological database and preliminary interpretations of the main faults and veins in DXF format by GCM. The database used to estimate the Project Mineral Resources was audited by SRK. SRK is of the opinion that the current drilling information is sufficiently reliable to interpret with confidence the boundaries for gold mineralization and that the assay data are sufficiently reliable to support MRE.
Leapfrog® was used to construct the geological solids, while Datamine™ was used to domain assay data for statistical and geostatistical analysis, construct the block model, estimate quality variables and tabulate the resultant Mineral Resources. Phinar X10-Geo software was used to conduct the capping analysis with Snowden Supervisor software used for geostatistical analysis, variography and statistical validation of the grade estimates.
SRK has not updated the Mineral Resource model for Las Verticales areas as no new information is currently available and therefore, the last estimate (December 31, 2018) remains valid for this area.
|
BP/KD |
May 2022 |
| SRK Consulting (U.S.), Inc. NI 43-101 Technical Report – Segovia 2021 PFS Update |
Page 144 |
| 14.1 | Drillhole Database |
SRK was supplied with Microsoft Excel files for each mine/project, which was exported from the Company’s main structured query language (SQL) database. The files supplied had an effective cutoff date of December 31, 2021. Separate files were supplied for the drilling database and channel sampling programs. The database was reviewed by SRK and imported into Datamine™ to complete the MRE.
The total database for all mines/projects includes bringing the total drilling database to 2,553 holes for 378,846 m. In total (Segovia + Carla) there has been an increase in the DD database of 424 holes for 97,106 meters (m), compared to December 2020.The increase in the database can be summarized as follows:
| • | A new vein has been added to the Mineral Resource at the historical Vera mine, which includes an additional 63 holes for 9,640 m. |
| • | GCM exploration (GEX) with the Segovia license continued the routine infill underground drilling programs designed to confirm and increase the confidence in the grade distribution at the mines. The program consisted of 172 holes drilled for a total of 54,549 m. |
| • | Additional to the exploration, 160 holes for 29,787 m were added from the mining department (GEM). |
| • | 33 holes for 1,025 m were added from small scale department which have been assayed at SGS (GPE). |
| • | Based on the data capture of the historical holes, two holes were removed from historical sources (FGM). |
| • | At Carla License a total of 20 holes for 3,895 m were added to the database. The provided database included a further 19 holes (3,725.2 m) from the LBA target and 10 holes (2,445.5 m) at the SAN target, but these have been excluded from the current estimates as they lie outside of the license boundary. |
In addition to the drilling there has been an increase in the underground channel databases as combination of new channel sampling, and the capture of historical samples at El Silencio and Sandra K mines.
In total there has been an increase of 7,368 channels for 10,716 m in length added to the database of new channels at the Segovia Project, with an additional 929 channels for 850 m of sampling at Carla, and 929 channels for 3,432 m of sampling at Vera, in the databases provided. A breakdown of the increase in the database per mine is as follows:
| • | Providencia: 2,073 channels for 1,634 m of sampling |
| • | El Silencio: 2,994 channels for 3,274 m of sampling |
| • | Sandra K: 2,293 channels for 7,201 m of sampling |
| • | Carla: 929 channels for 850 m of sampling |
| • | Vera: 4,680 channels for 3,432 m of sampling (including 4,588 channels for 3,326.4 m from historical FGM sources). |
SRK notes that some holes do not have assays and therefore, these holes have only been used in the development of the geological model to position the veins. SRK is of the opinion that the quality of the database is sufficient for use in the construction of the geological block model and associated MRE.
|
BP/KD |
May 2022 |
| SRK Consulting (U.S.), Inc. NI 43-101 Technical Report – Segovia 2021 PFS Update |
Page 145 |
Areas of lower quality data from sample points are considered to have lower confidence and therefore, limited to lower confidence categories (Inferred) in the absence of detailed verification sampling.
| 14.2 | Geologic Model |
The MRE process was completed by SRK with input/review from GCM staff for the geological model. GCM provided to SRK an exploration database with a preliminary interpretation of the main veins supplied within Leapfrog® marking the first pass interpretation of the main structures, with the geological logging reflecting through the areas investigated by core drilling for each of the main veins.
SRK reviewed the geological information provided in Leapfrog® and has updated the geological models as appropriate. The following process was undertaken to complete the geological models:
| • | Reviewed the geological database and checked the standard validation processes (such as absent values, overlapping intervals, extreme values etc.) have been completed appropriately.Any erroneous data was reported to GCM for review. |
| • | High-level review of the GCM geological interpretation. |
| • | SRK updated the fault model using polyline inputs adjustments to the initial interpretations from the GCM exploration team. |
| • | Define the timing and interaction of faults to generate fault blocks which veins are defined. The veins terminate at the contact with each fault. |
| • | Creation of the veins based initially on lithological coding provided by GCM, then edited by SRK based on either grade or location validation issues. SRK recommends that the elevation validation work continues and that efforts should be made to initially define the mining levels and development in full before reviewing the channel elevations further. |
A fault network for Providencia, Sandra K, El Silencio and Carla was interpreted by the Company using mine survey points and underground fault mapping. The geological model of Vera was completed using the digitized and validated historical information and the new drilling completed by GCM. The structural model (provided as surface wireframes or polylines in DXF format), was approved as a reasonable geological representation by the Company’s external structural consultant (Dr. Tony Starling, Telluris Consulting Ltd). Dr. James Siddorn, PGeo of SRK (Ontario) visited the Segovia site between June 10 to 14, 2019 to review the structural model prepared by the GCM geological team and to comment on the controls on the mineralization. Based on the review, the structural model was deemed as acceptable and has been used to define domain breaks for construction of the mineralization wireframes. SRK made minor adjustments to the model during the geological modelling process based on the latest underground channel sampling and survey information.
In the current model, all four of the main operating mines have been treated individually as independent geological models (due to file size). Interpretation of the vein structure in areas of mining development is relatively clear given the abundance of on-vein channel samples and development surveys, whereas in areas of less-densely spaced sampling (for example down-dip of the mine) a greater consideration for development is required.
Infill drilling from underground drilling locations has improved the geological knowledge of short to medium scale mine plans ahead of the current development. SRK considers the use of tightly spaced infill holes important and recommends this practice continues across all three operating mines.
|
BP/KD |
May 2022 |
| SRK Consulting (U.S.), Inc. NI 43-101 Technical Report – Segovia 2021 PFS Update |
Page 146 |
To generate the model, interpreted vein intervals and vein locations (single plane) were provided by mine geologists and used by the GCM exploration team as a modeling guide. These interpretations have been used where possible to prevent misallocation of mineralized intercepts where multiple veins exist, which are supplied to SRK for review.
SRK final models use the interpreted veins provided, vein intervals based on lithology logs or elevated gold grades and knowledge of the relationship between adjacent veins noted from underground mapping. SRK utilized the interval selection tool in Leapfrog® to generate new logging codes to provide a smoothed interpretation of the vein and avoid isolated pinches or pulls in the interpretation. The geological model was reviewed by GCM to confirm that the current interpretation is representative of the underlying geological data, and the knowledge of the veins from site.
Statistical analysis and visual validation of the database during exploratory data analysis (EDA) indicated the presence of two sample populations (medium- and high-grade), at El Silencio and Providencia as shown in Figure 14-1, and to a limited extent at Sandra K, Carla and Vera.
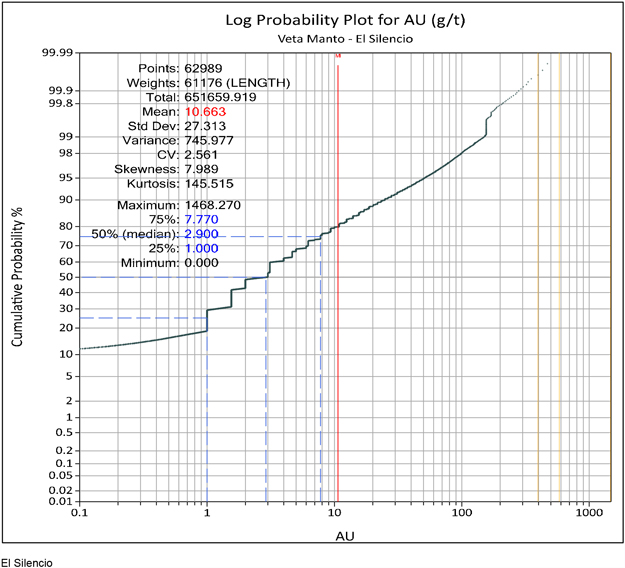
|
BP/KD |
May 2022 |
| SRK Consulting (U.S.), Inc. NI 43-101 Technical Report – Segovia 2021 PFS Update |
Page 147 |
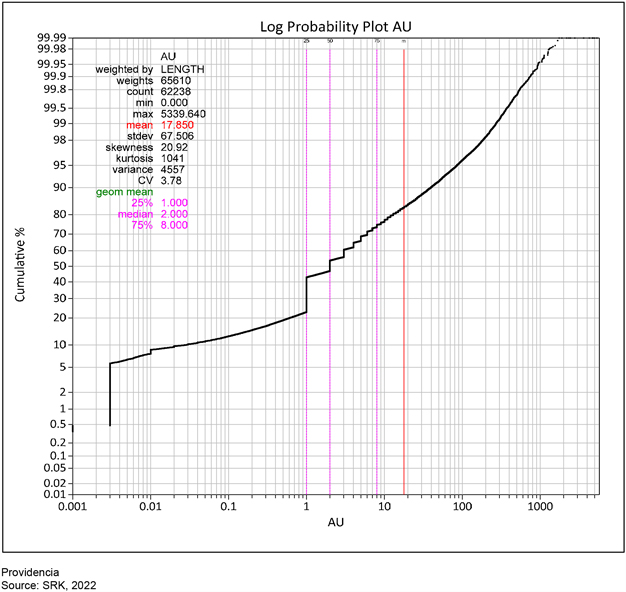
Figure 14-1: Summary of Log-Probability Analysis to Test for Breaks in Trend
SRK considers that the application of internal high-grade domains forms an important component to the different Segovia mines. From 2018 to 2021, SRK introduced the use of high-grade domains at Sandra K and Carla, respectively. SRK elected to exclude the southern fault block at Sandra K from the high-grade domaining as the sampling has been predominately from surface drilling, and therefore the sample population is considered too low to assign limits with sufficient levels of confidence.
During the review of the high-grade domains, SRK noted that the orientation of the high-grade samples is to the northeast on all three mines due to the regional structural controls creating preferential deposition of gold mineralization. This is consistent with the structural model proposed by GCM geologist and reviewed by a SRK structural geologist in 2019.
The grade estimation domains therefore are comprised of the narrow vein zones interpreted by SRK/GCM geologists and discrete high-grade gold shoot domains. The presence and orientation of the high-grade shoots were validated during underground visits and with discussions with the mines
|
BP/KD |
May 2022 |
| SRK Consulting (U.S.), Inc. NI 43-101 Technical Report – Segovia 2021 PFS Update |
Page 148 |
geological team as part of on-going technical support provided by SRK for short and medium-term mine planning.
The high-grade domains for each of the three mines have been created using a form of Indicator modelling using Leapfrog®, with the first pass imported into Datamine™ software for review, and final smoothed domains defined using 2D polylines. SRK has used variable grade indictors on four deposits based on initial review of the histograms as follows:
| • | Providencia – 7 g/t gold |
| • | El Silencio – 6 g/t gold |
| • | Sandra K – 7 g/t gold |
| • | Vera – 10 g/t gold |
To remove any potential small volumes or isolated pockets created by the estimation process, SRK generated a series of strings from the initial interpretation and manually edited the interpretation to provide reasonable representation of the underlying grade continuity.
The final geological coding was stored in the block model under the field “HG” for the main domains, but each individual wireframe was coded into the model dependent on its various fault block locations in sequence under the field “KZONE”. A summary of the final domains is provided in Figure 14-2 and a description of the files used to define each domain in Figure 14-2.
|
BP/KD |
May 2022 |
| SRK Consulting (U.S.), Inc. NI 43-101 Technical Report – Segovia 2021 PFS Update |
Page 149 |
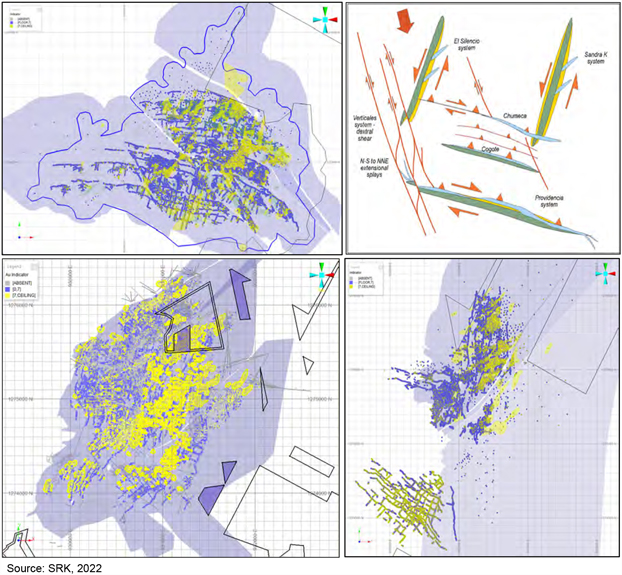
| Figure 14-2: | Plots Showing Orientation of High-Grade Shoots from Top Left (Clockwise), Providencia, Telluris Consulting Structural Control Model, El Silencio, And Sandra K (December 2021) |
Table 14-1: Summary of Final Geological Domain and Coding
| Mine | HG | Wireframe/Coding | Main Vein | Description | ||||||
| Providencia | 10 | pro_vn_1010 - pro_vn_1140 | Providencia | LG | ||||||
| 20 | pv_shoot_0222 | Providencia | HG | |||||||
| 30 | pro_vn_2010 | 3180 | COR & 3180 | |||||||
| 40 | pro_vn_2860 | 2860 | 2860 | |||||||
| 50 | pro_vn_3680 | 3680 | 3680 | |||||||
| 60 | pro_vn_4020 | 4020 | 4020 | |||||||
| 70 | pro_vn_4150 | 4150 | 4150 | |||||||
| 80 | pro_vn_4320 | 4320 | 4320 | |||||||
| 90 | pro_vn_5010 | 5010 | 5010 | |||||||
| 100 | pro_vn_f14 | F14 | Fault14 |
|
BP/KD |
May 2022 |
| SRK Consulting (U.S.), Inc. NI 43-101 Technical Report – Segovia 2021 PFS Update |
Page 150 |
| Mine | HG | Wireframe/Coding | Main Vein | Description | ||||||
| El Silencio | 10 | vem1001 - vem1011 | Manto | VEM - LG | ||||||
| 11 | Vem1012 | Manto HW1 | VEM_hw1 | |||||||
| 20 | es_shoot_0222 | Manto | VEM - HG | |||||||
| 30 | nal2001 - nal2003 | Nacional | nal | |||||||
| 40 | vep3001 | Piso | vep | |||||||
| 50 | esi4001 | El Silencio | esi | |||||||
| 51 | Ven_4002 | Oba | OBA_hw | |||||||
| 60 | lan5001-Lan5002 | La Antioqueña | lan | |||||||
| 61 | Lan-5003 | La Antioqueña FW | lan_fw | |||||||
| 70 | vpn6001 | Principal | vpn | |||||||
| 80 | 1320 | 1320 | 1320 | |||||||
| 90 | 1040 | 1040 | 1040 | |||||||
| 100 | 1140 | 1140 | 1140 | |||||||
| 110 | 1150 | 1150 | 1150 | |||||||
| 120 | Ven1000 | 1000 | 1000 | |||||||
| 130 | 1180 | 1180 | 1180 | |||||||
| 160 | Ven450 | 450 | 450 | |||||||
| 170 | Ven980 | 980 | 980 | |||||||
| 190 | Ven80S | 80S | 80S | |||||||
| 210 | vten | ten | ten | |||||||
| 220 | Ven920 | 920 | 920 | |||||||
| Sandra K | 10 | skt_1001 - skt_1004 | Techo | Techo North LG | ||||||
| 11 | skt_fw_1006 | Techo | Techo Footwall LG | |||||||
| 15 | skt_1005 | Techo | Techo South LG | |||||||
| 20 | sk_shoot_0222 | Techo | Techo HG | |||||||
| 30 | skp_2001 - skp_2003 | Piso | Piso 1 | |||||||
| 31 - 32 | skp_2004 | Piso | Piso FW | |||||||
| 40 |
skc_3001 & sk_3002 |
Chumeca |
Chumeca |
|||||||
| 41 | skc_3003 | Chumeca | Chumeca FW | |||||||
| 41 | skc_3004 | Chumeca | Chumeca HW | |||||||
| 50 | 6640_4001 | 6640 | 6640 | |||||||
| 60 – 61 | pat_5001 – jul_5002 | Patio | Pat | |||||||
| 62 – 64 | jul_5003 – jul_5005 | Juliet | Jul | |||||||
| 65 | jul_fw_5006 | Juliet | Jul FW | |||||||
| 70 – 71 | cog_6001 – cog_6002 | cogote | Cogote | |||||||
| Vera | 10 | ver_vn | Vera | 1010_LG | ||||||
| 20 |
ver_vn |
Vera |
1010_HG |
|||||||
| 30 | llv_vn | Lluvia | 1030 | |||||||
| 40 | sur_vn | Sur | 1040 | |||||||
| Carla | 10 | vn_1010 – 1030 | LGC | Carla | ||||||
| 20 |
vn_2010 |
LGC-HW |
Hangingwall vein |
|||||||
| 30 | vn_3010 | SNO | No Name | |||||||
| 40 | vn_4010 | LGC-FW | Footwall vein |
Source: SRK, 2022
| 14.3 | Assay Capping and Compositing |
SRK evaluated capping of outlier populations and compositing of variable-length data to minimize variance prior to the estimation as well as to obtain a more reasonable approximation of grades during the resource estimation.
|
BP/KD |
May 2022 |
| SRK Consulting (U.S.), Inc. NI 43-101 Technical Report – Segovia 2021 PFS Update |
Page 151 |
| 14.3.1 | Outliers |
High grade capping is undertaken where data is no longer considered to be part of the main population. SRK completed the analysis based on log probability plots, raw and log histograms which can be used to distinguish the grades at which samples have significant impacts on the local estimation and whose affect is considered extreme. SRK notes that the mean grades within the different veins are sensitive to changes in the capping values.
SRK completed a statistical analysis of the impact of grade capping by importing the geologically domained coded samples into Phinar’s X10 Geo (X10) and Snowden Supervisor statistical software packages for review. The raw assay data (length weighted) was first plotted on histograms and cumulative distribution plots (Figure 14-3) to understand its basic statistical distribution. High-grade capping was applied based on a combination of these plots, plus log histogram information.
The plots were used to distinguish the grades at which the sample population starts to break down and that additional samples will likely have significant impacts on the local estimation and whose affect is considered extreme (Figure 14-3). Samples for both channel and drilling were considered in the analysis. Using this methodology top-cuts were defined for each domain by reviewing the information from the different sample types.
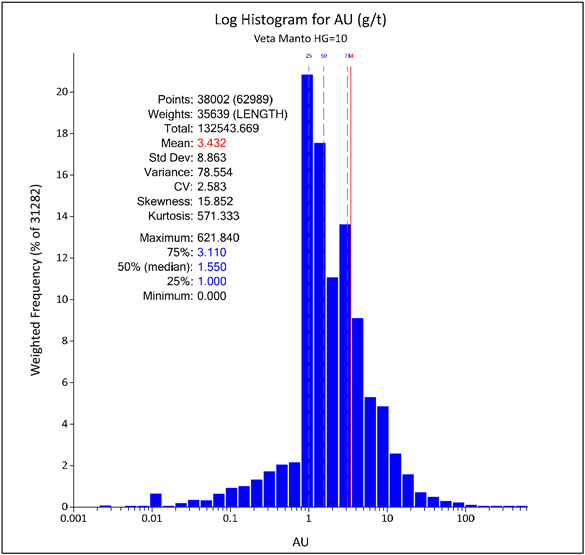
|
BP/KD |
May 2022 |
| SRK Consulting (U.S.), Inc. NI 43-101 Technical Report – Segovia 2021 PFS Update |
Page 152 |
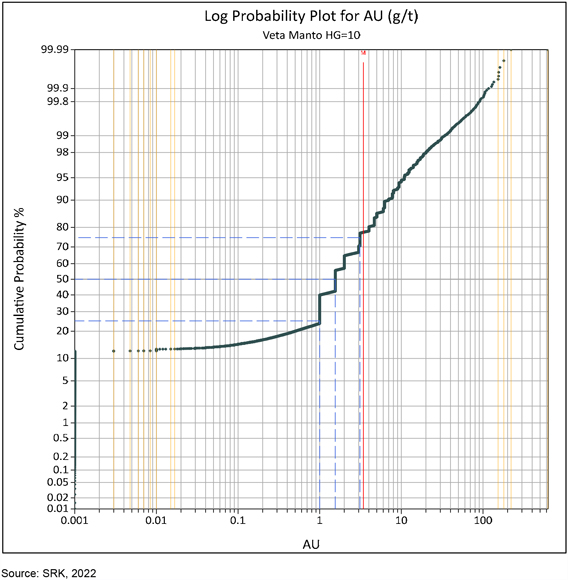
Figure 14-3: Example of Raw Au Histogram and Log-Probability Plots for Veta Manto, El Silencio - Low-Grade Domain
The influence of the capping was reviewed by SRK, to confirm the potential impact on the number of samples capped and the mean grades within each estimation domain, within X10. Figure 14-4 shows and example of a probability plot and the different levels of capping used as part of the analysis. To assess the impact on sampling the following statistical parameters have been considered, cap value, percentage of samples capped per domain, total metal reduction from capped values, percentage change in the coefficient of variation (CV), mean grade and the CV. An example of the analysis is shown in Table 14-2. These results are tabulated for comparison with the aim to reduce the CV below a value of 1.50 to 1.75, where reasonable.
The spatial occurrence of the capped values was visually verified to determine if they formed discrete zones which could potentially be domained separately.
During the on-going work with SRK and GCM at Segovia, the capping levels in the minor veins should be considered with caution, and GCM geologist recommended that stricter application of capping
|
BP/KD |
May 2022 |
| SRK Consulting (U.S.), Inc. NI 43-101 Technical Report – Segovia 2021 PFS Update |
Page 153 |
would be more appropriate. SRK therefore reviewed the statistics and lognormal probability plots per domain to determine appropriate grade capping thresholds.
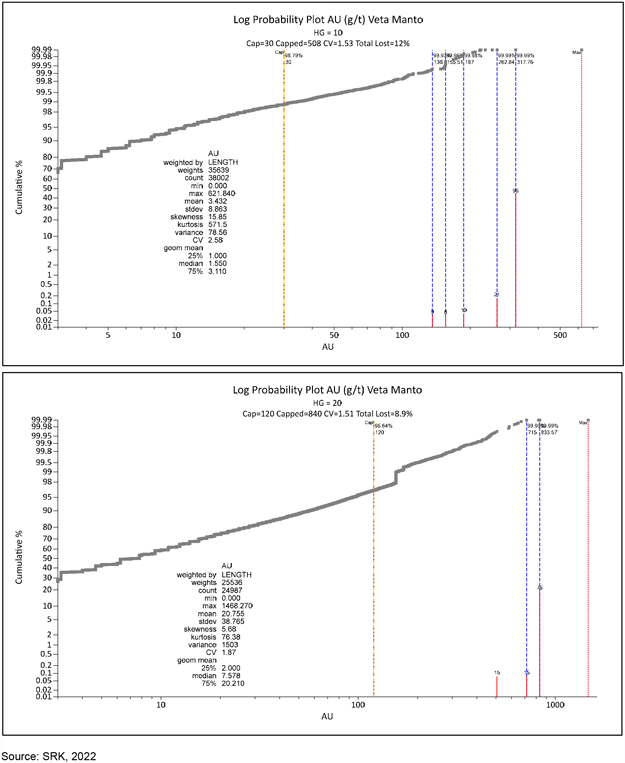
| Figure 14-4: | Log Probability Plots Showing Impact of Capping to Various Levels on the Mean (El Silencio – Veta Manto: Top image: Low-grade; Bottom image: High-grade) |
|
BP/KD |
May 2022 |
| SRK Consulting (U.S.), Inc. NI 43-101 Technical Report – Segovia 2021 PFS Update |
Page 154 |
| Table 14-2: | Example of Capping Statistical Analysis Completed per Domain (Low-Grade and High-Grade Veta Manto – El Silencio) |
| Column | Filter | Cap | Capped | Percentile | Capped% | Lost Total% | Lost CV% | Max | Mean | Variance | CV | |||||||||||||||||||||||||||||||||
| AU |
HG = 10 | 621.8 | 3.432 | 78.56 | 2.58 | |||||||||||||||||||||||||||||||||||||||
| AU |
HG = 10 | 318 | 1 | 99.99 | % | 0 | % | 0.1 | % | 2.9 | % | 317.8 | 3.427 | 73.78 | 2.51 | |||||||||||||||||||||||||||||
| AU |
HG = 10 | 263 | 2 | 99.99 | % | 0.01 | % | 0.2 | % | 3.6 | % | 262.8 | 3.425 | 72.68 | 2.49 | |||||||||||||||||||||||||||||
| AU |
HG = 10 | 250 | 3 | 99.99 | % | 0.01 | % | 0.2 | % | 3.8 | % | 250 | 3.424 | 72.35 | 2.48 | |||||||||||||||||||||||||||||
| AU |
HG = 10 | 233 | 4 | 99.99 | % | 0.01 | % | 0.3 | % | 4.1 | % | 233.2 | 3.423 | 71.9 | 2.48 | |||||||||||||||||||||||||||||
| AU |
HG = 10 | 187 | 11 | 99.98 | % | 0.03 | % | 0.4 | % | 5.5 | % | 187 | 3.418 | 69.61 | 2.44 | |||||||||||||||||||||||||||||
| AU |
HG = 10 | 156 | 20 | 99.96 | % | 0.1 | % | 0.7 | % | 7.2 | % | 155.5 | 3.409 | 66.83 | 2.4 | |||||||||||||||||||||||||||||
| AU |
HG = 10 | 136 | 31 | 99.93 | % | 0.1 | % | 1 | % | 9.4 | % | 136 | 3.396 | 63.15 | 2.34 | |||||||||||||||||||||||||||||
| AU |
HG = 10 | 112 | 48 | 99.89 | % | 0.1 | % | 1.7 | % | 13 | % | 112 | 3.374 | 57.82 | 2.25 | |||||||||||||||||||||||||||||
| AU |
HG = 10 | 30 | 508 | 98.79 | % | 1.3 | % | 12 | % | 41 | % | 30 | 3.034 | 21.55 | 1.53 | |||||||||||||||||||||||||||||
| AU |
HG = 20 | 1468 | 20.76 | 1503 | 1.87 | |||||||||||||||||||||||||||||||||||||||
| AU |
HG = 20 | 834 | 1 | 99.99 | % | 0 | % | 0.05 | % | 0.7 | % | 833.6 | 20.74 | 1479 | 1.85 | |||||||||||||||||||||||||||||
| AU |
HG = 20 | 715 | 3 | 99.99 | % | 0.01 | % | 0.09 | % | 1.1 | % | 715 | 20.74 | 1468 | 1.85 | |||||||||||||||||||||||||||||
| AU |
HG = 20 | 672 | 4 | 99.99 | % | 0.02 | % | 0.1 | % | 1.3 | % | 671.6 | 20.73 | 1461 | 1.84 | |||||||||||||||||||||||||||||
| AU |
HG = 20 | 584 | 8 | 99.98 | % | 0.03 | % | 0.2 | % | 1.8 | % | 584.4 | 20.72 | 1443 | 1.83 | |||||||||||||||||||||||||||||
| AU |
HG = 20 | 505 | 10 | 99.97 | % | 0.04 | % | 0.3 | % | 2.6 | % | 505.4 | 20.69 | 1417 | 1.82 | |||||||||||||||||||||||||||||
| AU |
HG = 20 | 120 | 840 | 96.64 | % | 3.4 | % | 8.9 | % | 19 | % | 120 | 18.91 | 814.3 | 1.51 | |||||||||||||||||||||||||||||
Source: SRK, 2022
|
BP/KD |
May 2022 |
| SRK Consulting (U.S.), Inc. NI 43-101 Technical Report – Segovia 2021 PFS Update |
Page 155 |
Given the high-grades noted at Providencia, SRK elected to use a sliding cap whereby a more restrictive cap is placed on samples beyond a set distance, this is sometimes referred to as clamping the high-grade samples. An examples is whereby the initial cap was set to 300 g/t Au (in the first estimation pass of the high-grade shoot), dropping to 200 g/t Au in the second and third search ranges, with a more significant cap in the low-grade domain of 60 g/t Au at Providencia. This process has been used to define a threshold limit for how high-grade samples influence the estimate within the Datamine software. It is the QP’s opinion that the initial high grades are realistic, but efforts are made to limit their impact on influencing estimates beyond a given range.
At El Silencio, a maximum of 120 g/t Au was used within the high-grade domain, and 30 g/t Au within the low-grade vein material and sliding cap was used for several veins where necessary. The other veins at El Silencio were reviewed on a vein-by-vein basis with the selected caps ranging between 15 and 120 g/t Au. At Sandra K, capping levels have been completed on a vein-by-vein basis and range from 20 g/t Au to 120 g/t Au, including sliding cap for the Veta Techo high grade (HG=20), using 120 g/t Au capping for the first estimation pass and 60 g/t Au cap for the second pass.
At Vera, a maximum of 130 g/t Au was used within the high-grade domain, and 30 g/t Au within the low-grade vein material. Sliding cap was implemented in Lluvia (30 g/t Au and 15 g/t Au) and Sur vein (60 g/t Au and 30 g/t Au) according to the search number.
At Carla, capping has been completed on a vein by vein basis with the main Carla vein and footwall vein capped at 37.5 g/t Au, while the higher grades noted in the 2021 channel sampling has increased the grade range and distributions in the hangingwall vein, which has increased the cap to 70 g/t Au. The final structure modelled at the mine is currently considered sub-economic and has a restrictive 5 g/t Au cap applied. SRK still considered there potential with more intersections this might increase and therefore has estimated the structure.
SRK completed sensitivity studies both on samples and estimation to changes in the capping levels which showed that adjusting the capping has a reasonably significant impact on the resultant contained metal. Capping the Providencia high-grade at 300 g/t Au resulted in approximately 1.8 % of the values being capped but dropping the cap to 200 g/t Au increased this percentage to approximately 3.9 % of the database, which increases to 8.5% at 120 g/t Au. Based on the analysis, SRK selected the variable capping approached previously defined, to ensure high-grades have limited local influence.
A comparison of the raw versus capped statistical analysis for the key domains is shown in Figure 14-5 to Figure 14-11.
|
BP/KD |
May 2022 |
| SRK Consulting (U.S.), Inc. NI 43-101 Technical Report – Segovia 2021 PFS Update |
Page 156 |
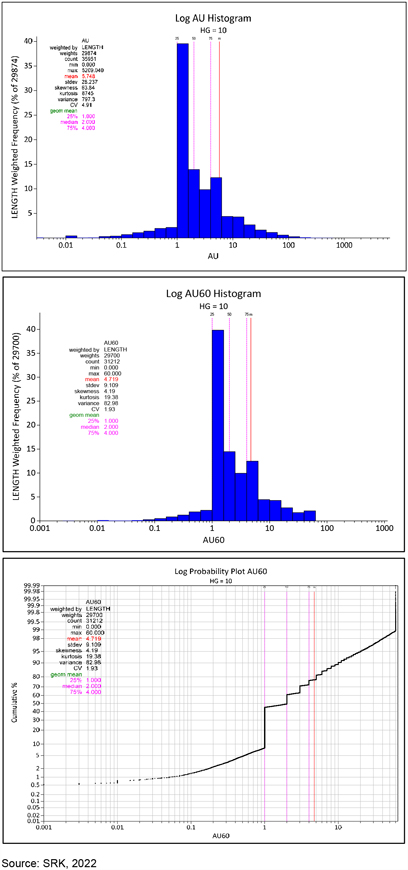
| Figure 14-5: | Example of Raw versus Capped Histogram and Log-Probability Plots for Providencia Low-Grade Domain (HG=10) |
|
BP/KD |
May 2022 |
| SRK Consulting (U.S.), Inc. NI 43-101 Technical Report – Segovia 2021 PFS Update |
Page 157 |
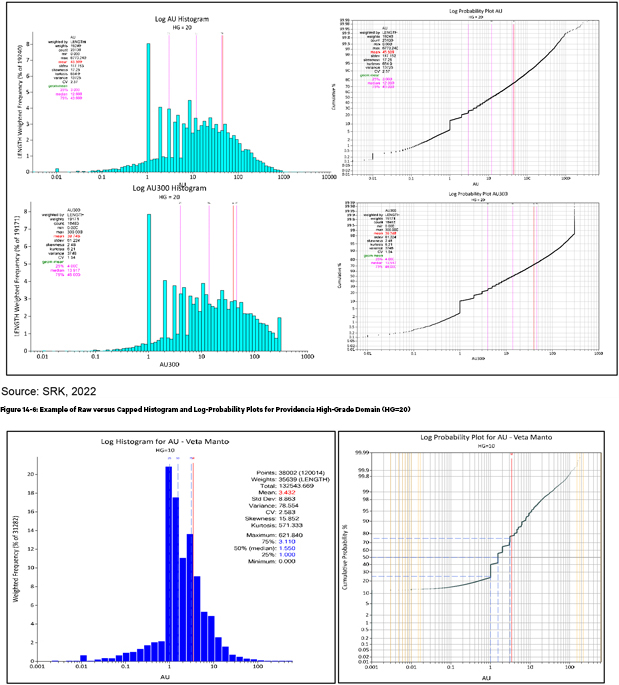
|
BP/KD |
May 2022 |
| SRK Consulting (U.S.), Inc. NI 43-101 Technical Report – Segovia 2021 PFS Update |
Page 158 |
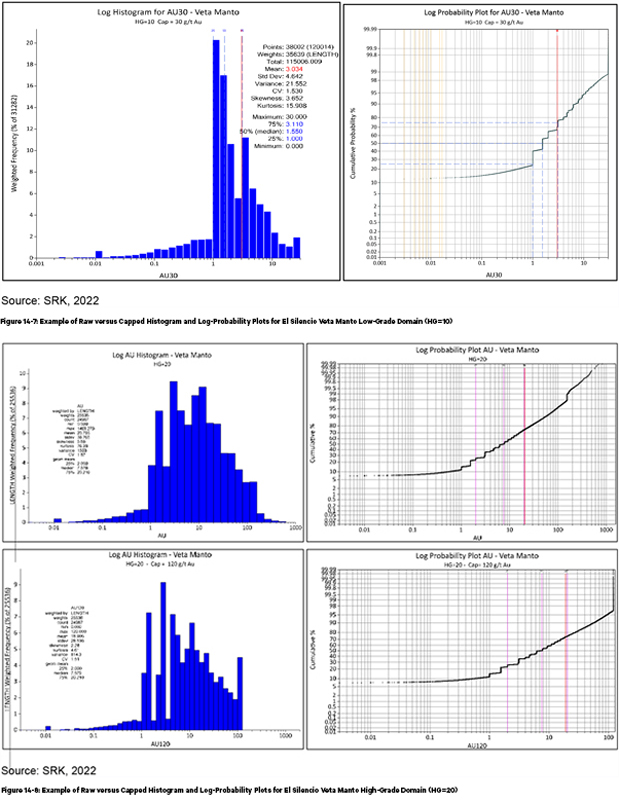
|
BP/KD |
May 2022 |
| SRK Consulting (U.S.), Inc. NI 43-101 Technical Report – Segovia 2021 PFS Update |
Page 159 |
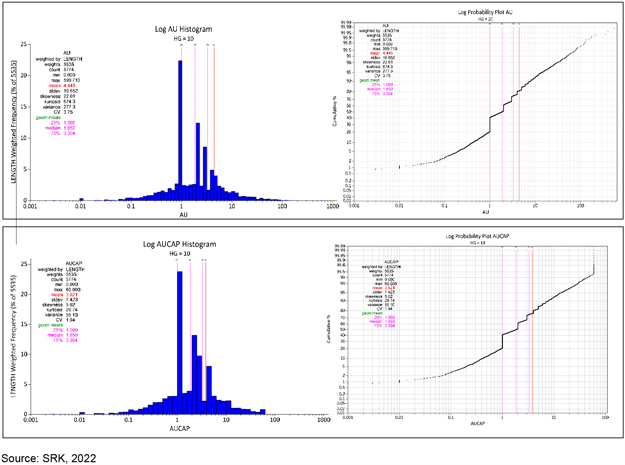
| Figure 14-9: | Example of Raw versus Capped Histogram and Log-Probability Plots for Sandra-K Veta Techo Low-Grade Domain (HG=10) |
|
BP/KD |
May 2022 |
| SRK Consulting (U.S.), Inc. NI 43-101 Technical Report – Segovia 2021 PFS Update |
Page 160 |
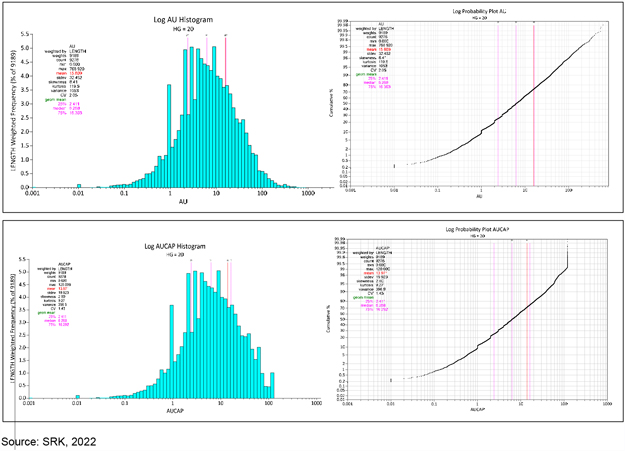
| Figure 14-10: | Example of Raw versus Capped Histogram and Log-Probability Plots for Sandra K Veta Techo High-Grade Domain (HG=20) |
|
BP/KD |
May 2022 |
| SRK Consulting (U.S.), Inc. NI 43-101 Technical Report – Segovia 2021 PFS Update |
Page 161 |
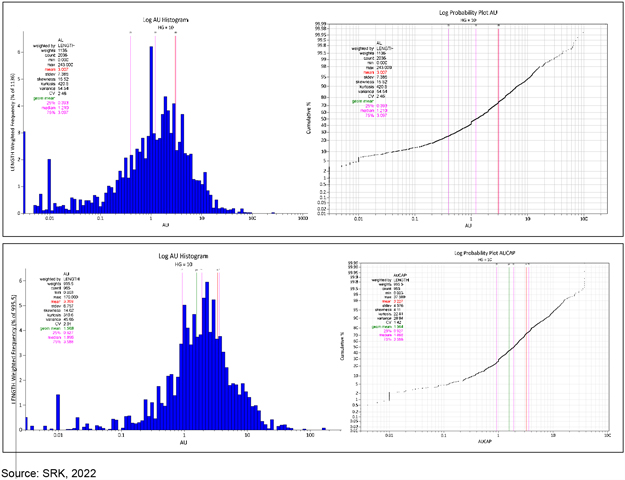
| Figure 14-11: | Example of Raw versus Capped Histogram and Log-Probability Plots for Carla Veta Domain (HG=10) |
|
BP/KD |
May 2022 |
| SRK Consulting (U.S.), Inc. NI 43-101 Technical Report – Segovia 2021 PFS Update |
Page 162 |
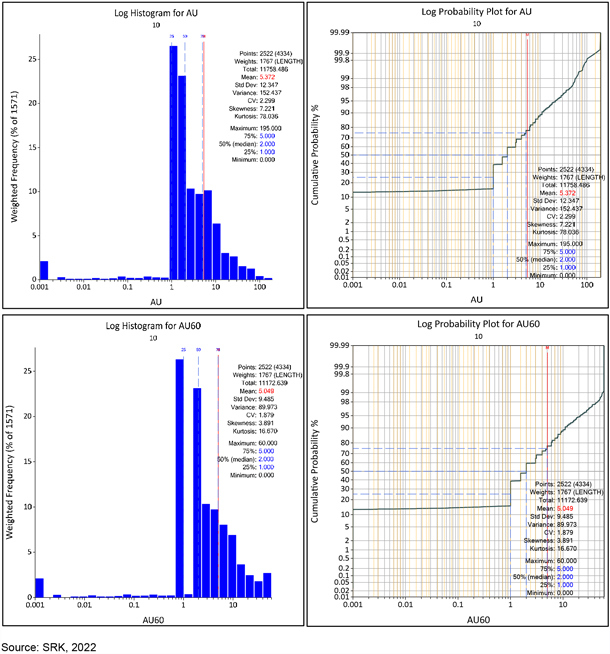
| Figure 14-12: | Example of Raw versus Capped Histogram and Log-Probability Plots for Veta Vera Domain (Vera LG, HG=10) |
| 14.3.2 | Compositing |
SRK analyzed the mean length of the underground channel and drillhole samples in order to determine appropriate composite lengths. At Providencia, Sandra K, Las Verticales and Carla the mean length of the sample data approximates to (or is less than) 0.8 to 1.0 m, suggesting that a composite length of greater than 1 m is appropriate. Figure 14-13 provides an example of the length analysis undertaken for drillhole samples at Providencia and El Silencio, which indicate that while the mean is low, a significant portion of the database has sample lengths in excess of 1 m (typically more than 40% of the database), and therefore composite lengths in the order of 2 or 3 m would be deemed more appropriate.
|
BP/KD |
May 2022 |
| SRK Consulting (U.S.), Inc. NI 43-101 Technical Report – Segovia 2021 PFS Update |
Page 163 |
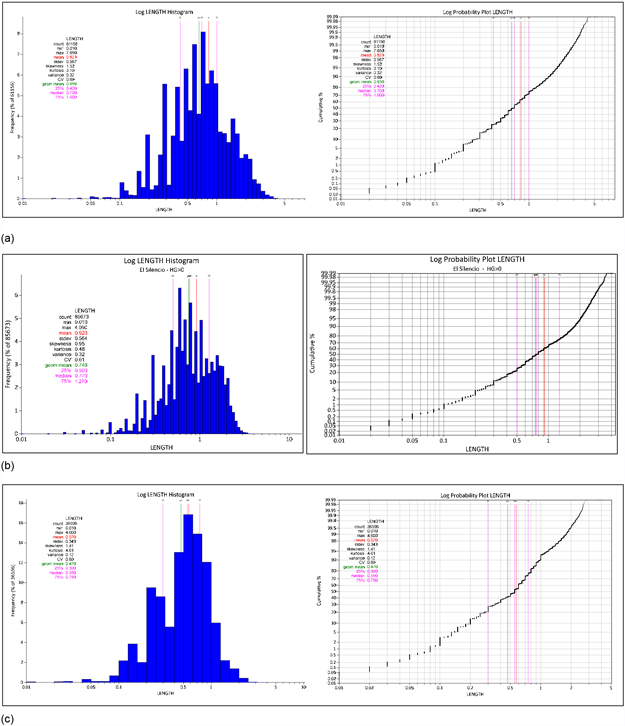
|
BP/KD |
May 2022 |
| SRK Consulting (U.S.), Inc. NI 43-101 Technical Report – Segovia 2021 PFS Update |
Page 164 |
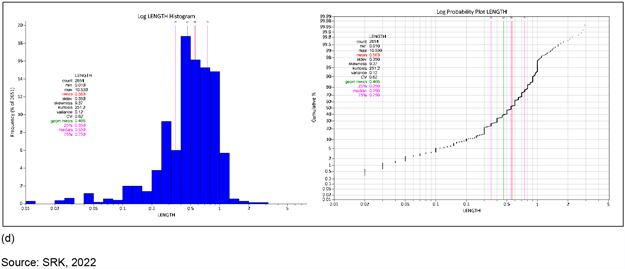
| Figure 14-13: | Log Probability Plots of Sample Lengths within (a) Providencia, (b) El Silencio (c) Sandra K Veins and (d) Carla Mine |
SRK tested the sensitivity in the mean grades to changes in composite length, plus the sensitivity of Datamine™ (MODE) that attempt to ensure all vein samples are incorporated into the composite file. The results indicate that using the Datamine™ (MODE = 1) utility enables more of the narrow vein samples to be incorporated into the composites while limiting any potential bias.
At El Silencio and Sandra K the results of the study for vein samples indicated that the selected 3 m composite length (or vein width), using a minimum sample length of 0.20 m, and Datamine’sTM MODE = 1 function provides a reasonable reconciliation to the raw data mean grade and total length. SRK therefore elected to use the option to utilize all sampling within the flagged veins (MODE=1). Review of the results for Providencia suggested the use of a 2 m composite with the same conditions was more appropriate and therefore the parameters were updated to reflect this appropriate change.
At Carla, Vera and Las Verticales, there was no updated Mineral Resource estimate, and the selected composite length used is 2 m composite, using a minimum of 0.20 m.
Table 14-3 to Table 14-7 show a comparison of the mean grades within each domain based on the grade capping applied. The percent difference for the less densely sampled zones between the raw and the capped mean is reasonably elevated, namely in the Carla and Las Verticales vein domains. SRK noted during the investigation that the difference in the mean grade (in the context of a relatively small sample population) is skewed by a limited number of high-grade samples which (prior to capping) were visually checked to see whether they form separate populations.
|
BP/KD |
May 2022 |
| SRK Consulting (U.S.), Inc. NI 43-101 Technical Report – Segovia 2021 PFS Update |
Page 165 |
Table 14-3: Summary of Raw versus Capped Samples
| Vein |
Domain | Field | Count | |
Minimum Au (g/t) |
|
|
Maximum Au (g/t) |
|
|
Mean Au (g/t) |
|
|
Standard Deviation |
|
|
Coefficient of Variation |
|
|
% Difference |
| |||||||||||
| PV |
10 – LG | Raw | 35,951 | 0 | 5,209.04 | 5.75 | 28.24 | 4.91 | ||||||||||||||||||||||||
| Capped | 35,955 | 0 | 60 | 4.72 | 9.26 | 1.96 | 17.9% | |||||||||||||||||||||||||
| Composite | 31,212 | 0 | 60 | 4.74 | 9.17 | 1.94 | 21.4% | |||||||||||||||||||||||||
| PV |
20 – HG | Raw | 23,130 | 0 | 6,773.24 | 45.52 | 117.15 | 2.57 | ||||||||||||||||||||||||
| Capped | 23,131 | 0 | 300 | 39.69 | 65.35 | 1.65 | 12.8% | |||||||||||||||||||||||||
| Composite | 18,483 | 0 | 300 | 40.51 | 62.97 | 1.55 | 12.6% | |||||||||||||||||||||||||
| PV |
30 – COR | Raw | 228 | 0 | 119 | 4.03 | 9.55 | 2.37 | ||||||||||||||||||||||||
| Capped | 228 | 0 | 30 | 3.50 | 5.27 | 1.50 | 13.2% | |||||||||||||||||||||||||
| Composite | 195 | 0 | 30 | 3.47 | 5.31 | 1.53 | 16.0% | |||||||||||||||||||||||||
| PV |
40 – VEN 2860 | Raw | 268 | 0 | 78 | 6.38 | 11.10 | 1.74 | ||||||||||||||||||||||||
| Capped | 268 | 0 | 60 | 6.26 | 10.39 | 1.66 | 1.9% | |||||||||||||||||||||||||
| Composite | 226 | 0 | 60 | 6.33 | 10.39 | 1.64 | 0.8% | |||||||||||||||||||||||||
| PV |
50 – VEN 3680 | Raw | 313 | 0.15 | 92 | 4.45 | 7.82 | 1.76 | ||||||||||||||||||||||||
| Capped | 313 | 0.15 | 30 | 4.09 | 5.45 | 1.33 | 8.1% | |||||||||||||||||||||||||
| Composite | 256 | 0.34 | 30 | 4.13 | 5.12 | 1.24 | 7.9% | |||||||||||||||||||||||||
| PV |
60 – VEN 4020 | Raw | 706 | 0 | 5,070.36 | 196.64 | 429.71 | 2.18 | ||||||||||||||||||||||||
| Capped | 706 | 0 | 300 | 104.55 | 120.02 | 1.15 | 46.8% | |||||||||||||||||||||||||
| Composite | 384 | 0 | 300 | 121.20 | 99.68 | 0.82 | 72.2% | |||||||||||||||||||||||||
| PV |
70 – VEN 4150 | Raw | 273 | 0.003 | 223.76 | 21.47 | 32.66 | 1.52 | ||||||||||||||||||||||||
| Capped | 273 | 0.003 | 60 | 17.28 | 19.49 | 1.13 | 19.5% | |||||||||||||||||||||||||
| Composite | 201 | 0.003 | 60 | 17.62 | 19.12 | 1.09 | 22.2% | |||||||||||||||||||||||||
| PV |
80 – VEN 4320 | Raw | 135 | 0 | 427 | 7.71 | 40.92 | 5.31 | ||||||||||||||||||||||||
| Capped | 135 | 0 | 30 | 3.58 | 5.07 | 1.42 | 53.5% | |||||||||||||||||||||||||
| Composite | 124 | 0 | 30 | 3.55 | 4.96 | 1.40 | 116.1% | |||||||||||||||||||||||||
| PV |
90 – VEN 5010 | Raw | 110 | 0.01 | 1169.36 | 124.81 | 170.79 | 1.37 | ||||||||||||||||||||||||
| Capped | 110 | 0.01 | 120 | 57.84 | 54.57 | 0.94 | 53.7% | |||||||||||||||||||||||||
| Composite | 67 | 0.01 | 120 | 62.95 | 51.41 | 0.82 | 107.0% | |||||||||||||||||||||||||
| PV |
90 – VEN 5010 | Raw | 37 | 0.01 | 242.8 | 22.29 | 48.42 | 2.17 | ||||||||||||||||||||||||
| Capped | 37 | 0.01 | 30 | 7.99 | 11.71 | 1.47 | 64.2% | |||||||||||||||||||||||||
| Composite | 22 | 0.01 | 30 | 7.83 | 10.79 | 1.38 | 181.1% |
Source: SRK, 2022
|
BP/KD |
May 2022 |
| SRK Consulting (U.S.), Inc. NI 43-101 Technical Report – Segovia 2021 PFS Update |
Page 166 |
Table 14-4: Summary of Raw versus Capped Samples at El Silencio
| Vein |
Domain | Field | Count | |
Minimum Au (g/t) |
|
|
Maximum Au (g/t) |
|
|
Mean Au (g/t) |
|
|
Standard Deviation |
|
|
Coefficient of Variation |
|
|
% Difference |
| |||||||||||
| ES |
10 – VEM LG | Raw | 38,002 | 0.000 | 621.80 | 3.43 | 8.86 | 2.58 | ||||||||||||||||||||||||
| ES |
10 – VEM LG | Capped | 38,002 | 0.000 | 30.00 | 3.03 | 4.64 | 1.53 | -12% | |||||||||||||||||||||||
| ES |
10 – VEM LG | Composite | 32,683 | 0.000 | 30.00 | 3.03 | 4.44 | 1.46 | -12% | |||||||||||||||||||||||
| ES |
11 – VEM HW1 | Raw | 26 | 0.003 | 105.20 | 9.82 | 26.08 | 2.65 | ||||||||||||||||||||||||
| ES |
11 – VEM HW1 | Capped | 26 | 0.003 | 60.00 | 6.91 | 14.94 | 2.16 | -30% | |||||||||||||||||||||||
| ES |
11 – VEM HW1 | Composite | 17 | 0.003 | 60.00 | 6.91 | 15.02 | 2.17 | -30% | |||||||||||||||||||||||
| ES |
20 – VEM HG | Raw | 24,987 | 0.000 | 1468.00 | 20.76 | 38.77 | 1.87 | ||||||||||||||||||||||||
| ES |
20 – VEM HG | Capped | 24,987 | 0.000 | 120.00 | 18.91 | 28.54 | 1.51 | -9% | |||||||||||||||||||||||
| ES |
20 – VEM HG | Composite | 22,275 | 0.000 | 120.00 | 18.90 | 28.11 | 1.49 | -9% | |||||||||||||||||||||||
| ES |
30 – NAL | Raw | 9,782 | 0.000 | 1934.00 | 18.99 | 67.60 | 3.56 | ||||||||||||||||||||||||
| ES |
30 – NAL | Capped | 9,782 | 0.000 | 120.00 | 13.17 | 28.57 | 2.17 | -31% | |||||||||||||||||||||||
| ES |
30 – NAL | Composite | 6,523 | 0.000 | 120.00 | 13.17 | 25.08 | 1.90 | -31% | |||||||||||||||||||||||
| ES |
40 – VEP | Raw | 925 | 0.000 | 1220.00 | 17.95 | 58.41 | 3.25 | ||||||||||||||||||||||||
| ES |
40 – VEP | Capped | 925 | 0.000 | 60.00 | 11.88 | 17.45 | 1.47 | -34% | |||||||||||||||||||||||
| ES |
40 – VEP | Composite | 812 | 0.000 | 60.00 | 11.89 | 17.06 | 1.44 | -34% | |||||||||||||||||||||||
| ES |
50 – VEP LG | Raw | 21 | 0.012 | 4.35 | 1.65 | 1.38 | 0.84 | ||||||||||||||||||||||||
| ES |
50 – VEP LG | Capped | 21 | 0.012 | 4.35 | 1.65 | 1.38 | 0.84 | 0% | |||||||||||||||||||||||
| ES |
50 – VEP LG | Composite | 16 | 0.017 | 4.35 | 1.65 | 1.19 | 0.73 | 0% | |||||||||||||||||||||||
| ES |
51 – VEP HG | Raw | 27 | 0.222 | 6.80 | 2.67 | 1.80 | 0.67 | ||||||||||||||||||||||||
| ES |
51 – VEP HG | Capped | 27 | 0.222 | 6.80 | 2.67 | 1.80 | 0.67 | 0% | |||||||||||||||||||||||
| ES |
51 – VEP HG | Composite | 14 | 0.222 | 6.80 | 2.67 | 1.75 | 0.66 | 0% | |||||||||||||||||||||||
| ES |
60 – LAN LG | Raw | 2,242 | 0.000 | 392.00 | 9.42 | 21.97 | 2.33 | ||||||||||||||||||||||||
| ES |
60 – LAN LG | Capped | 2,242 | 0.000 | 90.00 | 8.64 | 15.03 | 1.74 | -8% | |||||||||||||||||||||||
| ES |
60 – LAN LG | Composite | 1,972 | 0.000 | 90.00 | 8.53 | 14.95 | 1.75 | -9% | |||||||||||||||||||||||
| ES |
61 – LAN HG | Raw | 95 | 0.007 | 142.60 | 19.57 | 36.89 | 1.89 | ||||||||||||||||||||||||
| ES |
61 – LAN HG | Capped | 95 | 0.007 | 60.00 | 13.27 | 19.08 | 1.44 | -32% | |||||||||||||||||||||||
| ES |
61 – LAN HG | Composite | 56 | 0.103 | 60.00 | 13.95 | 19.82 | 1.42 | -29% | |||||||||||||||||||||||
| ES |
70 – VPN | Raw | 1,313 | 0.000 | 311.00 | 13.71 | 26.69 | 1.95 | ||||||||||||||||||||||||
| ES |
70 – VPN | Capped | 1,313 | 0.000 | 60.00 | 11.16 | 16.64 | 1.49 | -19% | |||||||||||||||||||||||
| ES |
70 – VPN | Composite | 1,129 | 0.000 | 60.00 | 11.16 | 16.58 | 1.49 | -19% | |||||||||||||||||||||||
| ES |
80 – 1320 | Raw | 344 | 0.015 | 280.90 | 11.44 | 24.20 | 2.12 | ||||||||||||||||||||||||
| ES |
80 – 1320 | Capped | 344 | 0.015 | 60.00 | 9.45 | 14.66 | 1.55 | -17% | |||||||||||||||||||||||
| ES |
80 – 1320 | Composite | 265 | 0.015 | 60.00 | 9.33 | 13.76 | 1.48 | -18% | |||||||||||||||||||||||
| ES |
90 – 1040 LG | Raw | 327 | 0.000 | 91.74 | 2.62 | 5.03 | 1.92 | ||||||||||||||||||||||||
| ES |
90 – 1040 LG | Capped | 327 | 0.000 | 30.00 | 2.49 | 3.23 | 1.30 | -5% | |||||||||||||||||||||||
| ES |
90 – 1040 LG | Composite | 232 | 0.000 | 30.00 | 2.44 | 2.91 | 1.19 | -7% | |||||||||||||||||||||||
| ES |
91 – 1040 HG | Raw | 816 | 0.000 | 455.90 | 23.93 | 48.66 | 2.03 |
|
BP/KD |
May 2022 |
| SRK Consulting (U.S.), Inc. NI 43-101 Technical Report – Segovia 2021 PFS Update |
Page 167 |
| Vein |
Domain | Field | Count | |
Minimum Au (g/t) |
|
|
Maximum Au (g/t) |
|
|
Mean Au (g/t) |
|
|
Standard Deviation |
|
|
Coefficient of Variation |
|
|
% Difference |
| |||||||||||
| ES |
91 – 1040 HG | Capped | 816 | 0.000 | 90.00 | 18.64 | 25.43 | 1.36 | -22% | |||||||||||||||||||||||
| ES |
91 – 1040 HG | Composite | 600 | 0.000 | 90.00 | 18.66 | 23.00 | 1.23 | -22% | |||||||||||||||||||||||
| ES |
100 – 1140 | Raw | 177 | 0.008 | 18.32 | 2.55 | 3.56 | 1.40 | ||||||||||||||||||||||||
| ES |
100 – 1140 | Capped | 177 | 0.008 | 15.00 | 2.52 | 3.42 | 1.36 | -1% | |||||||||||||||||||||||
| ES |
100 – 1140 | Composite | 119 | 0.018 | 15.00 | 2.54 | 3.21 | 1.27 | -1% | |||||||||||||||||||||||
| ES |
110 –1150 LG | Raw | 131 | 0.000 | 47.20 | 2.64 | 4.96 | 1.88 | ||||||||||||||||||||||||
| ES |
110 –1150 LG | Capped | 131 | 0.000 | 30.00 | 2.52 | 4.02 | 1.59 | -4% | |||||||||||||||||||||||
| ES |
110 –1150 LG | Composite | 84 | 0.000 | 30.00 | 2.53 | 4.06 | 1.60 | -4% | |||||||||||||||||||||||
| ES |
111 – 1150 HG | Raw | 176 | 0.000 | 155.50 | 17.63 | 24.97 | 1.42 | ||||||||||||||||||||||||
| ES |
111 – 1150 HG | Capped | 176 | 0.000 | 60.00 | 15.36 | 16.98 | 1.11 | -13% | |||||||||||||||||||||||
| ES |
111 – 1150 HG | Composite | 142 | 0.000 | 60.00 | 15.57 | 16.84 | 1.08 | -12% | |||||||||||||||||||||||
| ES |
120 – 1000 | Raw | 25 | 0.003 | 109.20 | 7.66 | 18.13 | 2.37 | ||||||||||||||||||||||||
| ES |
120 – 1000 | Capped | 25 | 0.003 | 15.00 | 3.90 | 4.37 | 1.12 | -49% | |||||||||||||||||||||||
| ES |
120 – 1000 | Composite | 17 | 0.003 | 15.00 | 4.23 | 3.90 | 0.92 | -45% | |||||||||||||||||||||||
| ES |
130 – 1180 LG | Raw | 1,130 | 0.000 | 155.50 | 2.56 | 9.56 | 3.74 | ||||||||||||||||||||||||
| ES |
130 – 1180 LG | Capped | 1,130 | 0.000 | 30.00 | 2.03 | 3.63 | 1.79 | -21% | |||||||||||||||||||||||
| ES |
130 – 1180 LG | Composite | 782 | 0.000 | 30.00 | 2.02 | 3.32 | 1.65 | -21% | |||||||||||||||||||||||
| ES |
131 – 1180 HG | Raw | 1,227 | 0.000 | 1240.00 | 28.11 | 69.03 | 2.46 | ||||||||||||||||||||||||
| ES |
131 – 1180 HG | Capped | 1,227 | 0.000 | 120.00 | 21.26 | 31.00 | 1.46 | -24% | |||||||||||||||||||||||
| ES |
131 – 1180 HG | Composite | 958 | 0.000 | 120.00 | 21.39 | 28.16 | 1.32 | -24% | |||||||||||||||||||||||
| ES |
160 – 450 LG | Raw | 7 | 0.747 | 2.21 | 1.83 | 0.65 | 0.36 | ||||||||||||||||||||||||
| ES |
160 – 450 LG | Capped | 7 | 0.747 | 2.21 | 1.83 | 0.65 | 0.36 | 0% | |||||||||||||||||||||||
| ES |
160 – 450 LG | Composite | 3 | 0.747 | 2.21 | 1.83 | 0.71 | 0.39 | 0% | |||||||||||||||||||||||
| ES |
161 – 450 HG | Raw | 172 | 0.003 | 162.70 | 8.03 | 20.69 | 2.58 | ||||||||||||||||||||||||
| ES |
161 – 450 HG | Capped | 172 | 0.003 | 30.00 | 5.37 | 8.94 | 1.67 | -33% | |||||||||||||||||||||||
| ES |
161 – 450 HG | Composite | 60 | 0.009 | 30.00 | 5.37 | 6.58 | 1.23 | -33% | |||||||||||||||||||||||
| ES |
170 – 980 LG | Raw | 563 | 0.000 | 155.50 | 3.68 | 11.80 | 3.21 | ||||||||||||||||||||||||
| ES |
170 – 980 LG | Capped | 563 | 0.000 | 30.00 | 2.92 | 4.47 | 1.53 | -21% | |||||||||||||||||||||||
| ES |
170 – 980 LG | Composite | 512 | 0.000 | 30.00 | 2.92 | 4.40 | 1.51 | -21% | |||||||||||||||||||||||
| ES |
171 – 980 HG | Raw | 1,066 | 0.000 | 155.50 | 27.73 | 40.83 | 1.47 | ||||||||||||||||||||||||
| ES |
171 – 980 HG | Capped | 1,066 | 0.000 | 90.00 | 23.46 | 29.49 | 1.26 | -15% | |||||||||||||||||||||||
| ES |
171 – 980 HG | Composite | 1,037 | 0.000 | 90.00 | 23.44 | 29.44 | 1.26 | -15% | |||||||||||||||||||||||
| ES |
190 – 80S | Raw | 475 | 0.000 | 155.50 | 10.94 | 22.58 | 2.06 | ||||||||||||||||||||||||
| ES |
190 – 80S | Capped | 475 | 0.000 | 60.00 | 9.09 | 13.60 | 1.50 | -17% | |||||||||||||||||||||||
| ES |
190 – 80S | Composite | 443 | 0.000 | 60.00 | 9.09 | 13.59 | 1.50 | -17% | |||||||||||||||||||||||
| ES |
210 – TEN | Raw | 39 | 0.003 | 34.85 | 2.81 | 5.95 | 2.11 | ||||||||||||||||||||||||
| ES |
210 – TEN | Capped | 39 | 0.003 | 15.00 | 2.25 | 3.05 | 1.35 | -20% | |||||||||||||||||||||||
| ES |
210 – TEN | Composite | 19 | 0.003 | 15.00 | 2.25 | 2.88 | 1.28 | -20% | |||||||||||||||||||||||
| ES |
220 – 920 | Raw | 633 | 0.000 | 55.00 | 3.06 | 5.52 | 1.80 |
|
BP/KD |
May 2022 |
| SRK Consulting (U.S.), Inc. NI 43-101 Technical Report – Segovia 2021 PFS Update |
Page 168 |
| Vein |
Domain | Field | Count | |
Minimum Au (g/t) |
|
|
Maximum Au (g/t) |
|
|
Mean Au (g/t) |
|
|
Standard Deviation |
|
|
Coefficient of Variation |
|
|
% Difference |
| |||||||||||
| ES |
220 – 920 | Capped | 633 | 0.000 | 30.00 | 2.89 | 4.14 | 1.43 | -6% | |||||||||||||||||||||||
| ES |
220 – 920 | Composite | 512 | 0.000 | 30.00 | 2.86 | 3.87 | 1.36 | -7% |
Source: SRK, 2022
Table 14-5: Summary of Raw versus Capped Samples at Sandra K
| Vein |
Domain | Filters | Samples | Minimum | Maximum | Mean | Standard deviation | CV | % Difference | |||||||||||||||||||||
| SK |
10 - Techo South LG | Raw | 7,803.00 | 0.00 | 1,198.88 | 4.45 | 19.66 | 4.42 | ||||||||||||||||||||||
| Capped | 7,805.00 | 0.00 | 60.00 | 3.82 | 8.05 | 2.11 | -14.1% | |||||||||||||||||||||||
| Composite | 5,774.00 | 0.00 | 60.00 | 3.82 | 7.42 | 1.94 | -14.0% | |||||||||||||||||||||||
| SK |
15 - Techo South LG | 15 AU | 1,752.00 | 0.00 | 214.28 | 3.23 | 9.38 | 2.91 | ||||||||||||||||||||||
| 15 AUCAP | 1,753.00 | 0.00 | 60.00 | 3.02 | 7.05 | 2.33 | -6.3% | |||||||||||||||||||||||
| 15 AUCAP | 1,300.00 | 0.00 | 60.00 | 3.04 | 6.49 | 2.14 | -5.9% | |||||||||||||||||||||||
| SK |
20 - Techo HG | 20 AU | 14,019.00 | 0.00 | 1,009.24 | 15.81 | 38.80 | 2.46 | ||||||||||||||||||||||
| 20 AUCAP | 14,022.00 | 0.00 | 120.00 | 13.97 | 23.57 | 1.69 | -11.6% | |||||||||||||||||||||||
| 20 AUCAP | 9,276.00 | 0.00 | 120.00 | 13.97 | 19.92 | 1.43 | -11.6% | |||||||||||||||||||||||
| SK |
30 - Piso | 30 AU | 2,650.00 | 0.00 | 1,840.00 | 10.79 | 40.00 | 3.71 | ||||||||||||||||||||||
| 30 AUCAP | 2,651.00 | 0.00 | 85.00 | 9.36 | 15.75 | 1.68 | -13.2% | |||||||||||||||||||||||
| 30 AUCAP | 2,399.00 | 0.00 | 85.00 | 9.36 | 15.38 | 1.64 | -13.2% | |||||||||||||||||||||||
| SK |
31 - Piso FW | 31 AU | 70.00 | 0.00 | 33.16 | 1.90 | 5.14 | 2.71 | ||||||||||||||||||||||
| 31 AUCAP | 71.00 | 0.00 | 10.00 | 1.35 | 2.28 | 1.69 | -28.9% | |||||||||||||||||||||||
| 31 AUCAP | 29.00 | 0.00 | 10.00 | 1.35 | 2.26 | 1.68 | -28.9% | |||||||||||||||||||||||
| SK |
40 - Chumeca | 40 AU | 1,987.00 | 0.00 | 386.00 | 8.52 | 29.46 | 3.46 | ||||||||||||||||||||||
| 40 AUCAP | 1,987.00 | 0.00 | 85.00 | 6.71 | 14.53 | 2.17 | -21.3% | |||||||||||||||||||||||
| 40 AUCAP | 1,641.00 | 0.00 | 85.00 | 6.71 | 13.81 | 2.06 | -21.3% | |||||||||||||||||||||||
| SK |
41 - Chumeca FW | 41 AU | 39.00 | 0.11 | 15.90 | 2.19 | 3.92 | 1.79 | ||||||||||||||||||||||
| 41 AUCAP | 39.00 | 0.11 | 15.90 | 2.19 | 3.92 | 1.79 | 0.0% | |||||||||||||||||||||||
| 41 AUCAP | 21.00 | 0.11 | 8.40 | 2.19 | 2.35 | 1.08 | 0.0% | |||||||||||||||||||||||
| SK |
42 - Chumeca HW | 42 AU | 8.00 | 0.01 | 6.74 | 2.58 | 2.30 | 0.89 | ||||||||||||||||||||||
| 42 AUCAP | 8.00 | 0.01 | 6.74 | 2.58 | 2.30 | 0.89 | 0.0% | |||||||||||||||||||||||
| 42 AUCAP | 4.00 | 0.01 | 6.74 | 2.58 | 2.30 | 0.89 | 0.0% | |||||||||||||||||||||||
| SK |
50 - 6640 | 50 AU | 818.00 | 0.00 | 3,302.60 | 16.77 | 97.25 | 5.80 | ||||||||||||||||||||||
| 50 AUCAP | 818.00 | 0.00 | 100.00 | 12.61 | 21.96 | 1.74 | -24.8% | |||||||||||||||||||||||
| 50 AUCAP | 580.00 | 0.00 | 100.00 | 12.61 | 20.17 | 1.60 | -24.8% | |||||||||||||||||||||||
| SK |
60 - PAT | 60 AU | 201.00 | 0.00 | 155.52 | 11.33 | 24.01 | 2.12 | ||||||||||||||||||||||
| 60 AUCAP | 201.00 | 0.00 | 60.00 | 9.15 | 13.99 | 1.53 | -19.2% | |||||||||||||||||||||||
| 60 AUCAP | 198.00 | 0.00 | 60.00 | 9.15 | 13.99 | 1.53 | -19.2% |
|
BP/KD |
May 2022 |
| SRK Consulting (U.S.), Inc. NI 43-101 Technical Report – Segovia 2021 PFS Update |
Page 169 |
| Vein |
Domain | Filters | Samples | Minimum | Maximum | Mean | Standard deviation | CV | % Difference | |||||||||||||||||||||||
| SK |
61 - PAT | 61 AU | 5,890.00 | 0.00 | 161.00 | 33.05 | 41.44 | 1.25 | ||||||||||||||||||||||||
| 61 AUCAP | 5,890.00 | 0.00 | 60.00 | 23.96 | 22.14 | 0.92 | -27.5% | |||||||||||||||||||||||||
| 61 AUCAP | 5,872.00 | 0.00 | 60.00 | 23.96 | 22.14 | 0.92 | -27.5% | |||||||||||||||||||||||||
| SK |
62 - JUL | 62 AU | 1,274.00 | 0.00 | 155.52 | 31.31 | 38.33 | 1.22 | ||||||||||||||||||||||||
| 62 AUCAP | 1,287.00 | 0.00 | 120.00 | 29.43 | 34.01 | 1.16 | -6.0% | |||||||||||||||||||||||||
| 62 AUCAP | 1,283.00 | 0.00 | 120.00 | 29.43 | 34.01 | 1.16 | -6.0% | |||||||||||||||||||||||||
| SK |
63 - JUL | 63 AU | 5,690.00 | 0.00 | 264.38 | 35.89 | 44.46 | 1.24 | ||||||||||||||||||||||||
| 63 AUCAP | 5,690.00 | 0.00 | 120.00 | 33.17 | 37.48 | 1.13 | -7.6% | |||||||||||||||||||||||||
| 63 AUCAP | 5,666.00 | 0.00 | 120.00 | 33.17 | 37.48 | 1.13 | -7.6% | |||||||||||||||||||||||||
| SK |
64 - JUL | 64 AU | 179.00 | 0.00 | 155.52 | 21.09 | 35.12 | 1.67 | ||||||||||||||||||||||||
| 64 AUCAP | 179.00 | 0.00 | 100.00 | 18.88 | 27.88 | 1.48 | -10.5% | |||||||||||||||||||||||||
| 64 AUCAP | 179.00 | 0.00 | 100.00 | 18.88 | 27.88 | 1.48 | -10.5% | |||||||||||||||||||||||||
| SK |
65 - JUL FW | 65 AU | 10.00 | 0.00 | 34.00 | 5.73 | 9.16 | 1.60 | ||||||||||||||||||||||||
| 65 AUCAP | 10.00 | 0.00 | 20.00 | 5.05 | 7.41 | 1.47 | -11.7% | |||||||||||||||||||||||||
| 65 AUCAP | 6.00 | 0.00 | 20.00 | 5.05 | 7.41 | 1.47 | -11.7% | |||||||||||||||||||||||||
| SK |
70 - COG | 70 AU | 99.00 | 0.01 | 147.64 | 14.57 | 30.11 | 2.07 | ||||||||||||||||||||||||
| 70 AUCAP | 99.00 | 0.01 | 60.00 | 10.76 | 17.30 | 1.61 | -26.1% | |||||||||||||||||||||||||
| 70 AUCAP | 73.00 | 0.01 | 60.00 | 10.76 | 16.79 | 1.56 | -26.1% |
Source: SRK, 2022
Table 14-6: Summary of Raw versus Capped Samples at Carla and Las Verticales
| Vein |
Domain | Field | Count | |
Minimum Au (g/t) |
|
|
Maximum Au (g/t) |
|
Mean Au | (g/t) | Standard Deviation | |
Coefficient of Variation |
|
% Difference | ||||||||||||||||
| CL |
10 – CL | Raw | 1773 | 0 | 243 | 3.375 | 7.804 | 2.312 | ||||||||||||||||||||||||
| Capped | 965 | 0.003 |
|
170 |
|
3.369 | 6.753 | 2.004 | -0.2% | |||||||||||||||||||||||
| Composite | 965 | 0.003 | 37.5 | 3.227 | 4.573 | 1.417 | -4.4% | |||||||||||||||||||||||||
| CL |
20 – CL HW | Raw | 513 | 0.003 | 912.16 | 16.089 | 42.515 | 2.643 | ||||||||||||||||||||||||
| Capped | 318 | 0.003 | 321.313 | 16.089 | 30.474 | 1.894 | 0.0% | |||||||||||||||||||||||||
| Composite | 318 | 0.003 | 70 | 13.374 | 17.695 | 1.323 | -16.9% | |||||||||||||||||||||||||
| CL |
30 – SNO | Raw | 21 | 0.003 | 12.6 | 1.259 | 2.464 | 1.957 | ||||||||||||||||||||||||
| Capped | 9 | 0.021 | 5.22 | 1.259 | 1.485 | 1.179 | 0.0% | |||||||||||||||||||||||||
| Composite | 9 | 0.021 | 5 | 1.236 | 1.423 | 1.152 | -1.8% | |||||||||||||||||||||||||
| CL |
40 – FW | Raw | 14 | 0.003 | 107.21 | 14.601 | 30.27 | 2.073 | ||||||||||||||||||||||||
| Capped | 7 | 0.003 | 59.287 | 14.601 | 20.282 | 1.389 | 0.0% | |||||||||||||||||||||||||
| Composite | 7 | 0.003 | 37.5 | 11.748 | 14.505 | 1.235 | -19.5% |
Source: SRK, 2022
|
BP/KD |
May 2022 |
| SRK Consulting (U.S.), Inc. NI 43-101 Technical Report – Segovia 2021 PFS Update |
Page 170 |
Table 14-7: Summary of Raw versus Capped Samples at Vera
| Vein |
Domain | Field | Count | Minimum Au | (g/t) | Maximum Au | (g/t) | Mean Au | (g/t) | |
Standard Deviation |
|
|
Coefficient of Variation |
|
% Difference | ||||||||||||||||
| VERA |
10 – Vera LG | Raw | 2,522 | 0.00 | 195.00 | 5.37 | 12.35 | 2.30 | ||||||||||||||||||||||||
| Capped | 2,522 | 0.00 | 60.00 | 5.05 | 9.48 | 1.88 | -6.0% | |||||||||||||||||||||||||
| Composite | 2,442 | 0.00 | 60.00 | 5.05 | 9.49 | 1.88 | -6.0% | |||||||||||||||||||||||||
| VERA |
20 – Vera HG | Raw | 1,263 | 0.00 | 750.00 | 41.86 | 67.42 | 1.61 | ||||||||||||||||||||||||
| Capped | 1,263 | 0.00 | 130.00 | 34.84 | 36.80 | 1.06 | -16.8% | |||||||||||||||||||||||||
| Composite | 1,254 | 0.00 | 130.00 | 34.84 | 36.79 | 1.06 | -16.8% | |||||||||||||||||||||||||
| VERA |
30 – Lluvia | Raw | 73 | 0.001 | 96.68 | 3.15 | 12.14 | 3.86 | ||||||||||||||||||||||||
| Capped | 73 | 0.001 | 30.00 | 2.09 | 5.28 | 2.52 | -33.7% | |||||||||||||||||||||||||
| Composite | 45 | 0.001 | 30.00 | 2.09 | 4.94 | 2.36 | -33.7% | |||||||||||||||||||||||||
| VERA |
40 – Sur | Raw | 476 | 0.00 | 77.00 | 2.61 | 7.14 | 2.73 | ||||||||||||||||||||||||
| Capped | 476 | 0.00 | 60.00 | 2.55 | 6.51 | 2.55 | -2.3% | |||||||||||||||||||||||||
| Composite | 427 | 0.00 | 60.00 | 2.55 | 5.66 | 2.54 | -2.3% |
Source: SRK, 2022
|
BP/KD |
May 2022 |
| SRK Consulting (U.S.), Inc. NI 43-101 Technical Report – Segovia 2021 PFS Update |
Page 171 |
| 14.4 | Density |
Density measurements are collected at Segovia from drill core and hand samples from the underground workings. In the case of both, density is assessed via the Archimedes immersion method, measuring the mass of the sample in air and then water, and taking the difference between the two. SRK notes that this method is considered reasonable. The method used to define the density for the geological model was discussed in Section 11.4, which indicated that a default block density of 2.7 g/cm3 is appropriate for the Project.
SRK notes that local fluctuations maybe expected due to varying amounts of sulfides. Overall SRK considers the density to be reasonable for this style of deposit and is supported to a degree by production data and weightometers at the plant.
| 14.5 | Variogram Analysis and Modeling |
SRK has completed a number of Variography studies between 2013 and 2020 during the MREs. Given the relative increase in the database, the parameters have been reviewed by SRK to validate or adjust the models using Snowden Supervisor during the 2021 estimate.
In completing the analysis, the following was considered:
| • | Azimuth and dip of each zone was determined |
| • | The down-hole variogram was calculated and modeled to characterize the nugget effect |
| • | Experimental semi-variograms, were calculated to determine both as omni-directional and directional variograms for the along strike, cross strike and down-dip directions |
| • | Omni directional variograms were modeled using the nugget defined in the down-hole variography, with single ranges for the along strike, cross strike and down-dip in all directions |
| • | All variances (where relevant) were re-scaled for each mineralized lens to match the total variance of composited data for that zone |
An example of the variograms modeled for the Providencia and El Silencio low-grade and high-grade domains (10 and 20) is shown in Figure 14-14 and Figure 14-16. Based on the review as part of the current statistical review SRK has made minor adjustments to the Providencia and El Silencio variograms.
In the review of the Sandra K variograms the experimental variograms displayed relatively poor structure, and therefore SRK opted to apply a correlogram to model the statistical parameters. The results are shown in Figure 14-16.
The final variogram parameters for the Project are displayed in Table 14-8.
|
BP/KD |
May 2022 |
| SRK Consulting (U.S.), Inc. NI 43-101 Technical Report – Segovia 2021 PFS Update |
Page 172 |
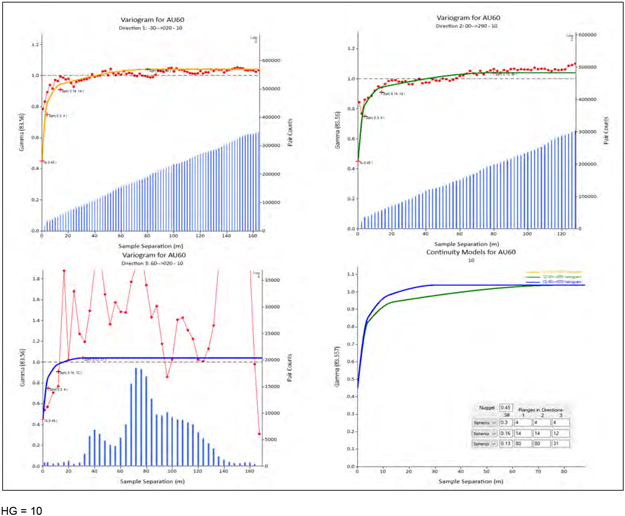
|
BP/KD |
May 2022 |
| SRK Consulting (U.S.), Inc. NI 43-101 Technical Report – Segovia 2021 PFS Update |
Page 173 |
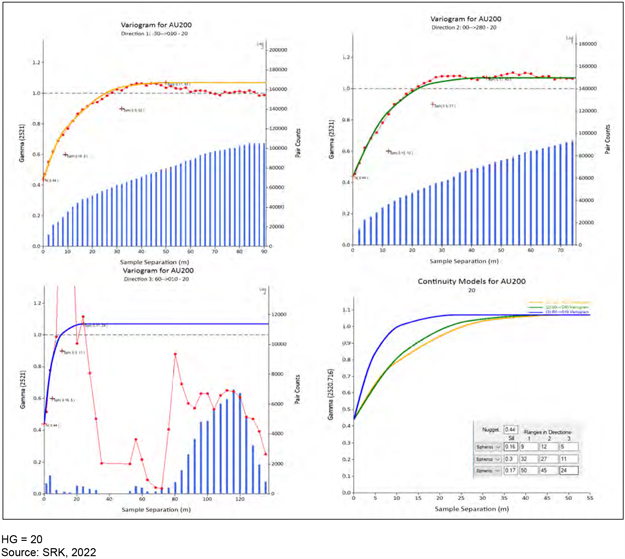
| Figure | 14-14: Summary of Modeled Directional Semi-Variogram Parameters for the Providencia for Gold – Domains 10 and 20 |
|
BP/KD |
May 2022 |
| SRK Consulting (U.S.), Inc. NI 43-101 Technical Report – Segovia 2021 PFS Update |
Page 174 |
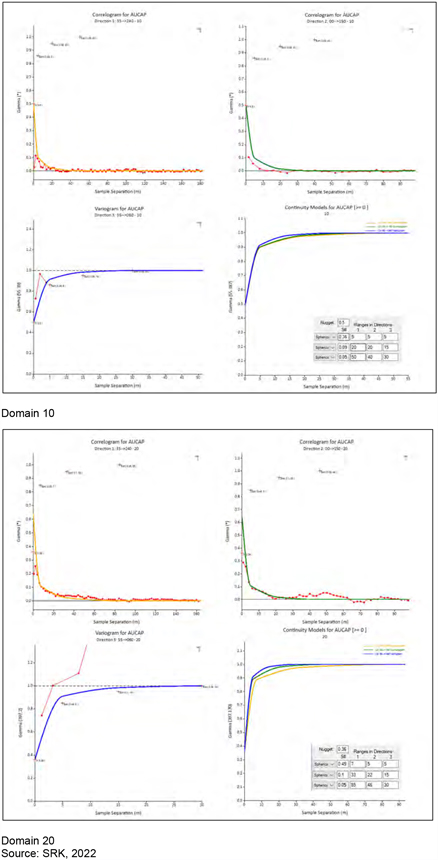
| Figure | 14-15: Summary of Modeled Semi-Variogram Parameters for the Sandra K for Gold – Domains 10 and 20 |
|
BP/KD |
May 2022 |
| SRK Consulting (U.S.), Inc. NI 43-101 Technical Report – Segovia 2021 PFS Update |
Page 175 |
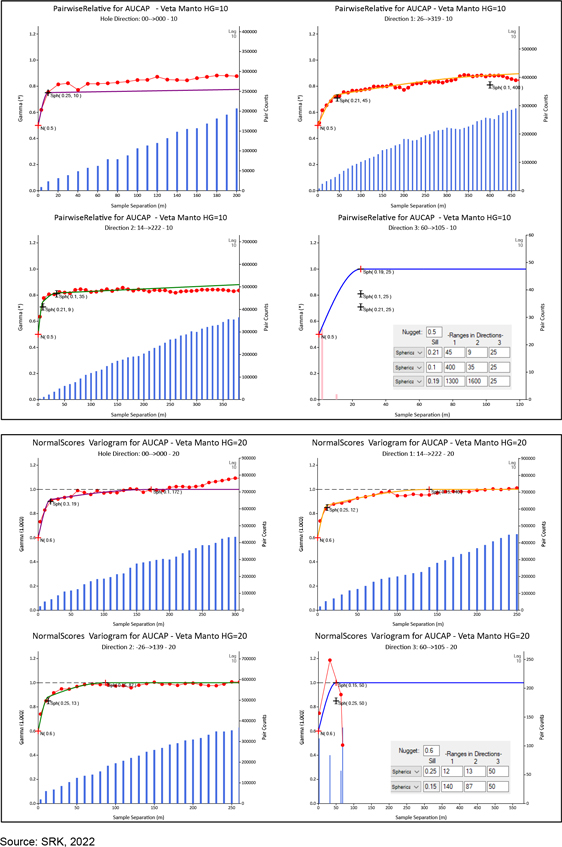
| Figure | 14-16: Summary of Modeled Semi-Variogram Parameters for the El Silencio for Gold – Domains 10 and 20 – Veta Manto |
|
BP/KD |
May 2022 |
| SRK Consulting (U.S.), Inc. NI 43-101 Technical Report – Segovia 2021 PFS Update |
Page 176 |
Table 14-8: Final Variogram Parameters
| Variogram Parameter |
Domains |
Rotation Z |
Rotation Y |
Rotation X |
Co | C1 |
A1 Along Strike (m) |
A1 Down Dip (m) |
A1 Across Strike (m) |
C2 |
A2 Along Strike (m) |
A2 Down Dip (m) |
A2 Across Strike (m) |
C3 |
A3 Along Strike (m) |
A3 Down Dip (m) |
A3 Across Strike (m) |
|||||||||||||||||||
| Providencia |
LG | -70 | -30 | 0 | 45.0% | 30.0% | 4 | 4 | 4 | 16.0% | 14 | 14 | 12 | 13.0% | 80 | 80 | 31 | |||||||||||||||||||
| Providencia |
HG | -80 | -30 | 0 | 44.0% | 30.0% | 9 | 12 | 5 | 30.0% | 32 | 27 | 11 | 17.0% | 50 | 45 | 24 | |||||||||||||||||||
| El Silencio |
VEM –LG | 105 | 30 | 120 | 50.0% | 21.0% | 45 | 9 | 25 | 10.0% | 400 | 35 | 25 | 19.0% | 1300 | 1600 | 25 | |||||||||||||||||||
| El Silencio |
VEM – HG | 105 | 30 | 120 | 60.0% | 25.0% | 12 | 13 | 50 | 15.0% | 140 | 87 | 50 | |||||||||||||||||||||||
| El Silencio |
NAL – LG/HG | 0 | 0 | 0 | 38.0% | 25.0% | 21 | 21 | 21 | 23.0% | 21 | 21 | 21 | 14.0% | 56 | 56 | 56 | |||||||||||||||||||
| Sandra K |
SKT –LG | -23 | -25 | 163 | 29.0% | 38.0% | 7 | 5 | 5 | 25.0% | 16 | 14 | 10 | 8.0% | 52 | 32 | 30 | |||||||||||||||||||
| Sandra K |
SKT –HG | -23 | -25 | 163 | 29.0% | 38.0% | 7 | 5 | 5 | 25.0% | 16 | 14 | 10 | 8.0% | 52 | 32 | 30 | |||||||||||||||||||
| Sandra K |
SKP | 0 | 0 | 0 | 31.2% | 42.8% | 3 | 3 | 3 | 12.3% | 10 | 10 | 10 | 13.8% | 40 | 40 | 40 | |||||||||||||||||||
| Sandra K |
CHU | 0 | 0 | 0 | 20.0% | 30.9% | 5 | 5 | 5 | 20.0% | 12 | 12 | 12 | 29.1% | 28 | 28 | 28 | |||||||||||||||||||
| Sandra K |
JUL | 0 | 0 | 0 | 34.0% | 26.0% | 4 | 4 | 4 | 29.0% | 18 | 18 | 18 | 11.0% | 65 | 65 | 65 | |||||||||||||||||||
| Sandra K |
PAT | 0 | 0 | 0 | 30.0% | 37.0% | 2 | 2 | 2 | 25.0% | 9 | 9 | 9 | 19.0% | 40 | 40 | 40 | |||||||||||||||||||
| Carla |
all | -5 | -40 | 180 | 40.0% | 17.0% | 3 | 7 | 5 | 43.0% | 67 | 98 | 10 | |||||||||||||||||||||||
| Vera |
HG | 36.7 | -25.6 | 16.1 | 12% | 58% | 4 | 2 | 3 | 21% | 25 | 20 | 15 | 9% | 133 | 200 | 15 | |||||||||||||||||||
| Las Verticales |
all | 0 | 0 | 0 | 23.1% | 36.8% | 30 | 30 | 30 | 40.1% | 120 | 120 | 120 |
Source: SRK, 2022
|
BP/KD |
May 2022 |
| SRK Consulting (U.S.), Inc. NI 43-101 Technical Report – Segovia 2021 PFS Update |
Page 177 |
| 14.6 | Block Model |
SRK produced block models using Datamine™. Grade estimation was based on block dimensions of 5 m by 5 m by 5 m, for the updated models. The block size reflects that the majority of the estimates are supported via underground channel sampling and spacing ranging from 2 to 5 m. These details are summarized in Table 14-9.
Vein thickness in the block model was based on defining an initial single block across the width of the vein during the block coding routines. Using this methodology, sub-blocks of 1 m by 1 m by 1 m are filled within each vein, with accurate boundaries selected.
Table 14-9: Details of Block Model Dimensions for the Project Geological Model
| Model |
Dimension | Origin (UTM) | Block Size | Number of Blocks | Min Sub-Blocking (m) | |||||||||
| Providencia |
X | 930000 | 5 | 560 | 1.00 | |||||||||
| Y | 1272000 | 5 | 440 | 1.00 | ||||||||||
| Z | -200 | full width vein | 1 | full width vein | ||||||||||
| Sandra K |
X | 931650 | 5 | 360 | 1.00 | |||||||||
| Y | 1273900 | 5 | 500 | 1.00 | ||||||||||
| Z | -100 | full width vein | 1 | full width vein | ||||||||||
| El Silencio |
X | 929500 | 5 | 560 | 1.00 | |||||||||
| Y | 1273500 | 5 | 660 | 1.00 | ||||||||||
| Z | -550 | full width vein | 1 | full width vein | ||||||||||
| Carla |
X | 930650 | 20 | 98 | 1.00 | |||||||||
| Y | 1267400 | 20 | 80 | 1.00 | ||||||||||
| Z | 50 | full width vein | 1 | full width vein | ||||||||||
| Las Verticales 2013 |
X | 928500 | 10 | 275 | 0.50 | |||||||||
| Y | 1271700 | 20 | 175 | 1.00 | ||||||||||
| Z | 0 | 20 | 45 | 1.00 | ||||||||||
| Vera |
X | 932700 | 5 | 220 | 1.00 | |||||||||
| Y | 1273000 | 5 | 440 | 1.00 | ||||||||||
| Z | 0 | full width vein | 1 | full width vein |
Source: SRK, 2022
Using the wireframes created and described in Section 14.2, several codes were written in the block model to describe each of the major geological properties of the rock types. Table 14-10 summarizes geological fields created within the block model and the codes used.
Table 14-10: Summary of Block Model Fields (Used for Flagging Various Geological Properties)
| Field Name |
Description | |
| SVOL |
Search Volume reference (range from 1 to 3) | |
| NSUM |
Number of samples used to estimate the block | |
| AUCAP |
Kriged gold value | |
| RESCAT |
Classification | |
| GROUP |
Mineralized structures grouped by domain | |
| KZONE |
Vein domain coding, individual to each mineralized structure | |
| HG |
Kriging zone for estimation | |
| DENSITY |
Density of the rock | |
| DEPL |
Flag to denote depleted areas of model | |
| PILLAR |
Remaining vein material inside the current limits of depletion | |
| MINE |
Flag to denote depleted areas of the model, excluding the pillars | |
| LICENCE |
Flag to denote areas of the model outside of the License Boundary | |
| THK |
Vertical thickness estimate using wireframe data | |
| COG |
Flag to highlight blocks above the cut-off grade | |
| AUM1 |
Accumulated gold grade over a 1 m mining width |
|
BP/KD |
May 2022 |
| SRK Consulting (U.S.), Inc. NI 43-101 Technical Report – Segovia 2021 PFS Update |
Page 178 |
Source: SRK, 2022
| 14.7 | Estimation Methodology |
SRK used the capped and composited data within the individual mineralized domains to interpolate grades for Au into the block models. The individual mineralization domains listed above in Section 14.2 were used as hard boundaries, with the samples within each domain being used to only estimate blocks within the same.
A three-pass nested search was utilized for each area, with dimensions of the search ellipsoid increasing in each pass. The initial shorter-range estimation pass is designed to estimate blocks that may be considered as higher confidence resources, and to focus estimates influenced by the channel sampling. To achieve this, SRK used relatively short ranges and higher minimum number of composites to ensure only blocks where channel sampling occur are used within the short range. The search ellipsoid was oriented parallel to the strike and dip of the mineralization and had a flattened shape to approximate the tabular nature of mineralization.
The search ellipses follow the typical orientation of the mineralized structures, and where appropriate, were aligned along higher-grade plunging features within the mineralized veins, namely within the visually evident high grade-shoots. Search ranges for the ellipsoids are generally based on the variogram ranges but adjusted to reflect the visual anisotropy noted in the geology seen. Geostatistical characteristics such as search volume used, kriging variance, and number of samples used in an estimate, were computed and stored in each individual block for descriptive evaluations.
| 14.7.1 | Sensitivity Analysis |
The estimations were refined over an iterative process completed of evaluating the results, validating them, and modifying parameters to obtain a model that accurately represents the mineralization and is statistically valid when compared to the input data supporting the estimation.
Grade estimation was performed in Datamine™ using Ordinary Kriging (OK), based on optimum parameters determined through a quantitative kriging neighborhood analysis (QKNA) exercise, and inverse distance weighting to the second power (IDW2). The QKNA exercise was based on varying estimation parameters during a number of different scenarios. To complete the sensitivity analysis at Providencia, SRK completed the following scenarios:
| • | Scenario 1: Search range 25 m x 35 m x 12.5 m, minimum six maximum 15 composites, estimation methodology (ID2), estimation at sub-block level |
| • | Scenario 2: Search range 25 m x 35 m x 12.5 m, minimum six maximum 15 composites, estimation methodology (ID2) estimation at parent block level |
| • | Scenario 3: Search range 75 m x 100 m x 50 m, minimum 15 maximum 20 composites, estimation methodology (ID2) estimation at parent block level |
| • | Scenario 4: Search range 40 m x 50 m x 25 m, minimum three maximum 10 composites, estimation methodology (ID2) estimation at parent block level |
| • | Scenario 5: Search range 25 m x 50 m x 25 m, minimum three maximum 10 composites, estimation methodology (ID2) estimation at parent block level |
| • | Scenario 6: Search range 25 m x 50 m x 25 m, minimum three maximum 10 composites, estimation methodology (OK) estimation at parent block level |
|
BP/KD |
May 2022 |
| SRK Consulting (U.S.), Inc. NI 43-101 Technical Report – Segovia 2021 PFS Update |
Page 179 |
| • | Scenario 7: Search range 25 m x 35 m x 12.5 m, minimum six maximum 15 composites, estimation methodology (OK) estimation at parent block level |
SRK completed visual and basic statistical tests and elected to use the kriged estimates using the shorter range (Scenario 7) as being most representative of the underlying data.
14.7.2 Final Parameters
OK was selected for the grade interpolation for the Project and all major domain boundaries were treated as hard boundaries during the estimation process. A summary of the final parameters is shown in Table 14-11. A discretization grid of 5 by 5 by 5 points has been used in all scenarios.
Restrictive searches via use of variable capping at Providencia and a short first pass at Carla were utilized to prevent very high gold grade samples in areas of lower drilling density from over influencing the surrounding block estimates, and thus honoring the geological interpretation (for highly variable gold grade distribution) favored by SRK and the Company.
|
BP/KD |
May 2022 |
| SRK Consulting (U.S.), Inc. NI 43-101 Technical Report – Segovia 2021 PFS Update |
Page 180 |
Table 14-11: Summary of Final Kriging Parameters for the Segovia Project
| Vein |
Domain | |
Search X |
|
|
Searc h Y |
|
|
Search Z |
|
|
Rotation Angle 1 |
|
|
Rotation Angle 2 |
|
|
Rotation Angle 3 |
|
|
Axis Rotation (z) |
|
|
Axis Rotation (x) |
|
|
Axis Rotation (z) |
|
|
Minimum No. Samples |
|
|
Maximum No. Samples |
| ||||||||||||
| PV |
10 - LG | 25 | 35 | 20 | 60 | 25 | -15 | 3 | 1 | 2 | 6 | 15 | ||||||||||||||||||||||||||||||||||
| PV |
20 - HG | 25 | 35 | 20 | 65 | 25 | -15 | 3 | 1 | 2 | 3 | 15 | ||||||||||||||||||||||||||||||||||
| PV |
30 | 40 | 50 | 25 | 60 | 25 | -15 | 3 | 1 | 2 | 3 | 10 | ||||||||||||||||||||||||||||||||||
| PV |
40 | 35 | 50 | 25 | 60 | 25 | -15 | 3 | 1 | 2 | 6 | 12 | ||||||||||||||||||||||||||||||||||
| PV |
50,70,80,110 | 25 | 35 | 12.5 | 0 | 35 | 0 | 3 | 1 | 3 | 6 | 15 | ||||||||||||||||||||||||||||||||||
| PV |
60, 120 | 75 | 100 | 50 | 0 | 35 | 0 | 3 | 1 | 3 | 15 | 20 | ||||||||||||||||||||||||||||||||||
| PV |
90 | 40 | 50 | 25 | 0 | 35 | 0 | 3 | 1 | 3 | 10 | 20 | ||||||||||||||||||||||||||||||||||
| PV |
100 | 25 | 50 | 25 | 0 | 35 | 0 | 3 | 1 | 3 | 6 | 15 | ||||||||||||||||||||||||||||||||||
| ES |
10 VEM – LG | 25 | 50 | 25 | 105 | 27 | -43 | 3 | 1 | 3 | 6 | 20 | ||||||||||||||||||||||||||||||||||
| ES |
11 - VEM HW1 | 25 | 50 | 25 | 105 | 27 | -43 | 3 | 1 | 3 | 6 | 20 | ||||||||||||||||||||||||||||||||||
| ES |
20 - VEM HG | 25 | 50 | 25 | 105 | 27 | -43 | 3 | 1 | 3 | 6 | 20 | ||||||||||||||||||||||||||||||||||
| ES |
30 – NAL LG | 25 | 50 | 25 | 105 | 27 | -43 | 3 | 1 | 3 | 6 | 20 | ||||||||||||||||||||||||||||||||||
| ES |
40 - VEP | 35 | 50 | 25 | 105 | 27 | -43 | 3 | 1 | 3 | 6 | 15 | ||||||||||||||||||||||||||||||||||
| ES |
50 - ESI | 35 | 50 | 25 | 105 | 27 | -43 | 3 | 1 | 3 | 6 | 15 | ||||||||||||||||||||||||||||||||||
| ES |
60 - LAN | 35 | 50 | 25 | 105 | 27 | -43 | 3 | 1 | 3 | 6 | 15 | ||||||||||||||||||||||||||||||||||
| ES |
61 – LAN - FW | 35 | 50 | 25 | 105 | 27 | -43 | 3 | 1 | 3 | 6 | 15 | ||||||||||||||||||||||||||||||||||
| ES |
70 - VPN | 35 | 50 | 25 | 105 | 27 | -43 | 3 | 1 | 3 | 6 | 15 | ||||||||||||||||||||||||||||||||||
| ES |
80 - 1320 | 35 | 50 | 25 | 105 | 27 | -43 | 3 | 1 | 3 | 6 | 15 | ||||||||||||||||||||||||||||||||||
| ES |
90 - 1040 | 35 | 50 | 25 | 105 | 27 | -43 | 3 | 1 | 3 | 6 | 15 | ||||||||||||||||||||||||||||||||||
| ES |
100 - 1140 | 35 | 50 | 25 | 105 | 27 | -43 | 3 | 1 | 3 | 6 | 15 | ||||||||||||||||||||||||||||||||||
| ES |
110 - 1150 | 35 | 50 | 25 | 105 | 27 | -43 | 3 | 1 | 3 | 6 | 15 | ||||||||||||||||||||||||||||||||||
| ES |
120 - 1000 | 35 | 50 | 25 | 105 | 27 | -43 | 3 | 1 | 3 | 6 | 15 | ||||||||||||||||||||||||||||||||||
| ES |
130 - 1180 | 35 | 50 | ` | 105 | 27 | -43 | 3 | 1 | 3 | 6 | 15 | ||||||||||||||||||||||||||||||||||
| ES |
160 – 450 | 35 | 50 | 25 | 105 | 27 | -43 | 3 | 1 | 3 | 6 | 15 | ||||||||||||||||||||||||||||||||||
| ES |
170 – 980 | 35 | 50 | 25 | 105 | 27 | -43 | 3 | 1 | 3 | 6 | 15 | ||||||||||||||||||||||||||||||||||
| ES |
190 – 80S | 35 | 50 | 25 | 105 | 27 | -43 | 3 | 1 | 3 | 6 | 15 | ||||||||||||||||||||||||||||||||||
| ES |
210 – TEN | 35 | 50 | 25 | 105 | 27 | -43 | 3 | 1 | 3 | 6 | 15 | ||||||||||||||||||||||||||||||||||
| ES |
220 – 920 | 35 | 50 | 25 | 105 | 27 | -43 | 3 | 1 | 3 | 6 | 15 | ||||||||||||||||||||||||||||||||||
| SK |
10 TECHO - LG1 | 25 | 55 | 25 | 60 | 25 | -15 | 3 | 1 | 2 | 3 | 15 | ||||||||||||||||||||||||||||||||||
| SK |
15 TECHO - LG2 | 25 | 55 | 25 | 60 | 25 | -15 | 3 | 1 | 2 | 3 | 15 |
|
BP/KD |
May 2022 |
| SRK Consulting (U.S.), Inc. NI 43-101 Technical Report – Segovia 2021 PFS Update |
Page 181 |
| SK |
20 -TECHO HG |
25 |
55 |
25 |
60 |
25 |
-15 |
3 |
1 |
2 |
3 |
15 | ||||||||||||
| SK |
30 - PISO |
25 |
50 |
25 |
60 |
25 |
-15 |
3 |
1 |
2 |
3 |
10 | ||||||||||||
| SK |
31 – PISO FW |
40 |
50 |
25 |
60 |
25 |
-15 |
3 |
1 |
2 |
2 |
10 | ||||||||||||
| SK |
40 – CHUMECA |
25 |
50 |
25 |
0 |
35 |
0 |
3 |
1 |
3 |
6 |
15 | ||||||||||||
| SK |
50 – 6640 |
25 |
50 |
25 |
0 |
35 |
0 |
3 |
1 |
3 |
6 |
15 | ||||||||||||
| SK |
60 - 61 – PAT |
30 |
55 |
25 |
60 |
25 |
-15 |
3 |
1 |
2 |
3 |
15 | ||||||||||||
| SK |
62 - 64 – JUL |
40 |
50 |
20 |
35 |
25 |
-15 |
3 |
1 |
3 |
3 |
8 | ||||||||||||
| SK |
65 – JUL FW |
40 |
50 |
20 |
35 |
35 |
-20 |
3 |
1 |
3 |
3 |
8 | ||||||||||||
| CA |
Carla (1) |
100 |
35 |
60 |
80 |
45 |
0 |
3 |
1 |
3 |
4 |
12 | ||||||||||||
| CA |
Carla (2) |
100 |
100 |
100 |
80 |
45 |
0 |
3 |
1 |
3 |
1 |
4 | ||||||||||||
| LV |
Las Verticales |
400 |
400 |
400 |
0 |
0 |
0 |
3 |
1 |
3 |
4 |
8 | ||||||||||||
| VE |
VERA LG |
25 |
25 |
12.5 |
3 |
-30 |
0 |
3 |
2 |
3 |
5 |
15 | ||||||||||||
| VE |
VERA HG |
25 |
25 |
12.5 |
3 |
-30 |
0 |
3 |
2 |
3 |
5 |
15 | ||||||||||||
| LL |
LLUVIA |
25 |
25 |
12.5 |
3 |
-30 |
0 |
3 |
2 |
3 |
5 |
15 | ||||||||||||
| SUR |
SUR |
25 |
25 |
12.5 |
3 |
-30 |
0 |
3 |
2 |
3 |
5 |
15 |
| Vein |
Domain | Second Search Range Factor | Minimum No. Samples | Maximum No. Samples | Third Search Range Factor | Minimum No. Samples | Maximum No. Samples | Estimation Method | Capped Field Used for Final Grade | |||||||||
| PV |
10 - LG |
2 | 2 | 12 | 3 | 1 | 8 |
OK |
AU60 | |||||||||
| PV |
20 - HG |
1.5 | 4 | 30 | 3 | 2 | 25 |
OK |
AU300, AU200 | |||||||||
| PV |
30 | 2 | 2 | 10 | 3 | 1 | 10 |
OK |
AU60 | |||||||||
| PV |
40 | 2 | 2 | 12 | 3 | 1 | 8 |
OK |
AU120,AU60 | |||||||||
| PV |
50,70,80,110 | 2 | 2 | 12 | 3 | 1 | 8 |
OK |
AU15 | |||||||||
| PV |
60, 120 | 1.5 | 4 | 30 | 3 | 2 | 25 |
OK |
AU60,AU30 | |||||||||
| PV |
90 | 2 | 2 | 10 | 3 | 1 | 10 |
OK |
AU300, AU120 | |||||||||
| PV |
100 | 2 | 2 | 12 | 3 | 1 | 8 |
OK |
AU90, AU60 | |||||||||
| ES |
VEM10 -LG |
2 | 4 | 16 | 3 | 1 | 8 |
OK |
AU30 | |||||||||
| ES |
VEM20 - HG |
2 | 4 | 16 | 3 | 1 | 8 |
OK |
AU120 | |||||||||
| ES |
VEM HW1 |
2 | 4 | 16 | 3 | 1 | 8 |
OK |
AU60 | |||||||||
| ES |
30 — NAL |
2 | 4 | 16 | 3 | 1 | 8 |
OK/IDW |
AU120/AU60/AU30 | |||||||||
| ES |
40 - VEP |
2 | 2 | 12 | 3 | 1 | 8 |
OK |
AU60 | |||||||||
| ES |
50 - ESI |
2 | 2 | 12 | 3 | 1 | 8 |
OK |
AU15 | |||||||||
| ES |
60 - LAN |
2 | 2 | 12 | 3 | 1 | 8 |
OK |
AU90 |
|
BP/KD |
May 2022 |
| SRK Consulting (U.S.), Inc. NI 43-101 Technical Report – Segovia 2021 PFS Update |
Page 182 |
| Vein | Domain | Second Search Range Factor |
Minimum No. Samples |
Maximum No. Samples |
Third Search Range Factor |
Minimum No. Samples |
Maximum No. Samples |
Estimation Method |
Capped Field Used for Final Grade | |||||||||
| ES |
61 – LAN - FW |
2 | 2 | 12 | 3 | 1 | 8 | OK | AU60 | |||||||||
| ES |
70 - VPN |
2 | 2 | 12 | 3 | 1 | 8 |
OK |
AU60 | |||||||||
| ES |
80 - 1320 | 2 | 2 | 12 | 3 | 1 | 8 |
IDW |
AU60 | |||||||||
| ES |
90 - 1040 | 2 | 2 | 12 | 3 | 1 | 8 |
IDW |
AU90/AU30 | |||||||||
| ES |
100 - 1140 | 2 | 2 | 12 | 3 | 1 | 8 |
IDW |
AU15 | |||||||||
| ES |
110 - 1150 | 2 | 2 | 12 | 3 | 1 | 8 |
IDW |
AU60/AU30 | |||||||||
| ES |
120 – 1000 | 2 | 2 | 12 | 3 | 1 | 8 |
IDW |
AU15 | |||||||||
| ES |
130 - 1180 | 2 | 2 | 12 | 3 | 1 | 8 |
IDW |
AU120/AU30 | |||||||||
| ES |
160 - 450 | 2 | 2 | 12 | 3 | 1 | 8 |
IDW |
AU30/AU15 | |||||||||
| ES |
170 – 980 | 2 | 2 | 12 | 3 | 1 | 8 |
IDW |
AU90/AU30 | |||||||||
| ES |
190 – 80S | 2 | 2 | 12 | 3 | 1 | 8 |
IDW |
AU60 | |||||||||
| ES |
210 – TEN |
2 | 2 | 12 | 3 | 1 | 8 |
IDW |
AU15 | |||||||||
| ES |
220 – 920 | 2 | 2 | 12 | 3 | 1 | 8 |
IDW |
AU90/AU/30 | |||||||||
| SK |
10 TECHO - LG1 |
1.5 | 4 | 30 | 3 | 2 | 25 | OK | AU60 | |||||||||
| SK |
15 TECHO - LG2 |
1.5 | 4 | 30 | 3 | 2 | 25 | OK | AU30 | |||||||||
| SK | 20 - TECHO HG |
1.5 | 4 | 30 | 3 | 2 | 25 | OK | AU120 | |||||||||
| SK |
30 - PISO |
2 | 2 | 10 | 3 | 1 | 8 |
OK |
AU85 | |||||||||
| SK | 31 – PISO FW |
2 | 2 | 10 | 3 | 1 | 8 | OK | AU85 | |||||||||
| SK |
40 – CHUMECA | 2 | 6 | 15 | 3 | 1 | 8 | OK | AU60 | |||||||||
| SK |
50 – 6640 | 1.5 | 3 | 12 | 3 | 1 | 8 |
ID2 |
AU60 | |||||||||
| SK |
60 - 61 – PAT |
1.5 | 2 | 8 | 3 | 1 | 8 |
ID2 |
AU30 | |||||||||
| SK |
62 - 64 – JUL |
1.5 | 2 | 8 | 3 | 1 | 8 |
ID2 |
AU30 | |||||||||
| SK |
65 – JUL FW |
1.5 | 2 | 8 | 3 | 1 | 8 |
ID3 |
AU31 | |||||||||
| CA |
Carla 1 |
2 | 4 | 10 | 2.6 | 2 | 20 |
OK |
AUCAP | |||||||||
| CA |
Carla 2 |
2 | 1 | 4 | 2.6 | 1 | 4 |
OK |
AUCAP | |||||||||
| LV | Las Verticales |
1 | 3 | 12 | 1.5 | 2 | 10 | OK | AUCAP | |||||||||
| VE |
VERA LG |
AUCAP |
|
BP/KD |
May 2022 |
| SRK Consulting (U.S.), Inc. NI 43-101 Technical Report – Segovia 2021 PFS Update |
Page 183 |
| Vein | Domain | Second Search Range Factor | Minimum No. Samples | Maximum No. Samples | Third Search Range Factor | Minimum No. Samples | Maximum No. Samples | Estimation Method | Capped Field Used for Final Grade | |||||||||
| VE | VERA HG | AUCAP | ||||||||||||||||
| LL | LLUVIA | AUCAP | ||||||||||||||||
| SUR | SUR | AUCAP |
Source: SRK, 2022
|
BP/KD |
May 2022 |
| SRK Consulting (U.S.), Inc. NI 43-101 Technical Report – Segovia 2021 PFS Update |
Page 184 |
| 14.8 | Model Validation |
SRK undertook a validation of the resultant interpolated model in order to: confirm the estimation parameters, check that the model represents the input data on both local and global scales, and check that the estimate is not biased. SRK undertook this using a number of validation techniques:
| • | Visual inspection of block grades in plan and section and comparison with drillhole grades |
| • | Comparative statistical study versus composite data and alternative estimation methods |
| • | Sectional interpretation of the mean block and composite grades (swath plots) |
14.8.1 Visual Comparison
Visual validation provides a comparison of the interpolated block model on a local scale. A thorough visual inspection was undertaken in 3D, comparing the sample grades with the block grades, which demonstrates acceptable grade comparison between local block estimates and nearby samples, without excessive smoothing in the block model. Figure 14-17 through Figure 14-22 show examples of the visual validation checks and highlights the overall block grades corresponding with composite sample grades of each mine. SRK notes in a limited number of cases, within areas of low sample density and highly variable gold grade, local grade discrepancies occur between composite and block grades. In these areas, SRK verified the resulting grade distributions with the Company geological staff and made amendments where appropriate. In areas of greatest variability, SRK considered grade continuity as a factor during the classification process.
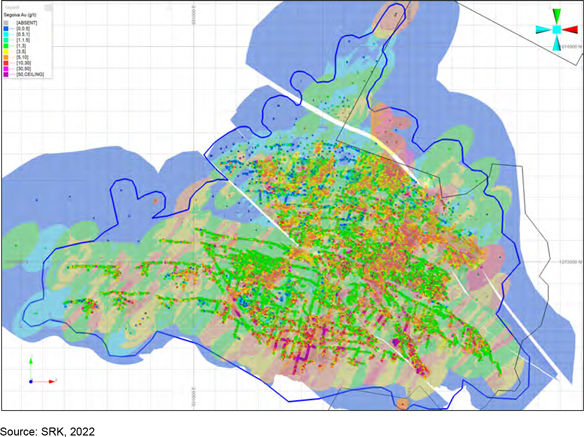
Figure 14-17: Examples of Visual Validation of Grade Distribution Composites Versus Block Model – Providencia
|
BP/KD |
May 2022 |
| SRK Consulting (U.S.), Inc. NI 43-101 Technical Report – Segovia 2021 PFS Update |
Page 185 |
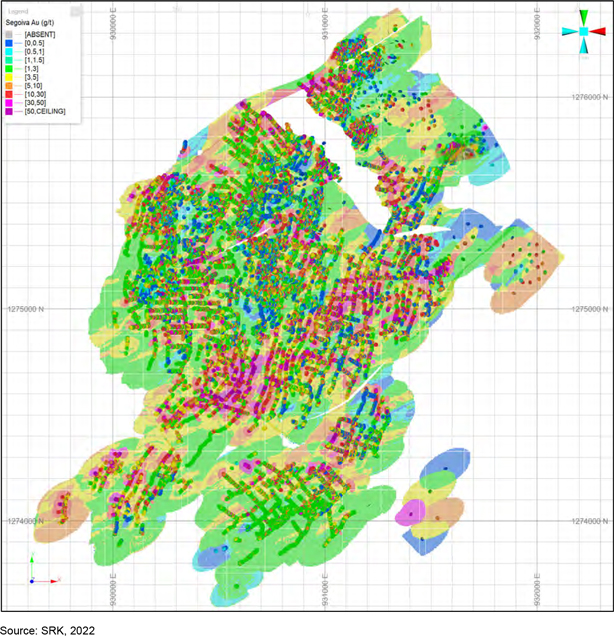
Figure 14-18: Examples of Visual Validation of Grade Distribution Composites Versus Block Model - El Silencio
|
BP/KD |
May 2022 |
| SRK Consulting (U.S.), Inc. NI 43-101 Technical Report – Segovia 2021 PFS Update |
Page 186 |
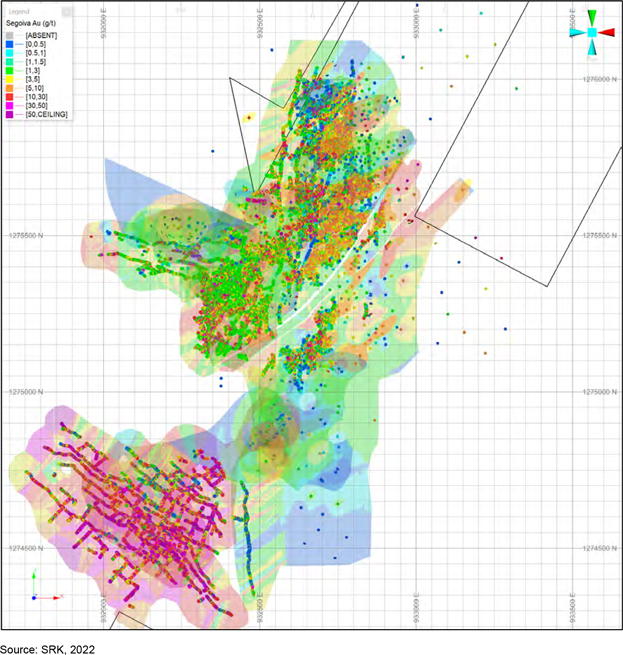
Figure 14-19: Examples of Visual Validation of Grade Distribution Composites Versus Block Model - Sandra K
|
BP/KD |
May 2022 |
| SRK Consulting (U.S.), Inc. NI 43-101 Technical Report – Segovia 2021 PFS Update |
Page 187 |
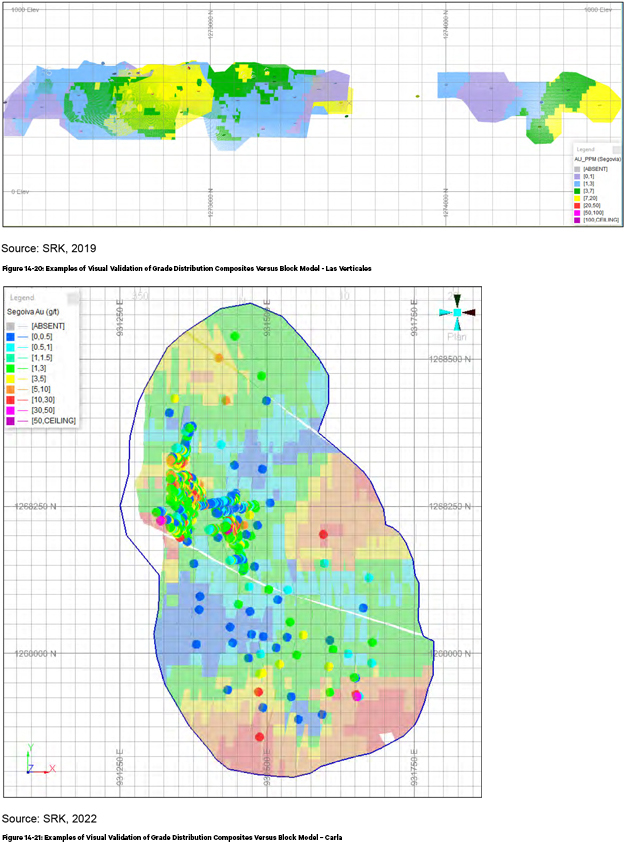
|
BP/KD |
May 2022 |
| SRK Consulting (U.S.), Inc. NI 43-101 Technical Report – Segovia 2021 PFS Update |
Page 188 |
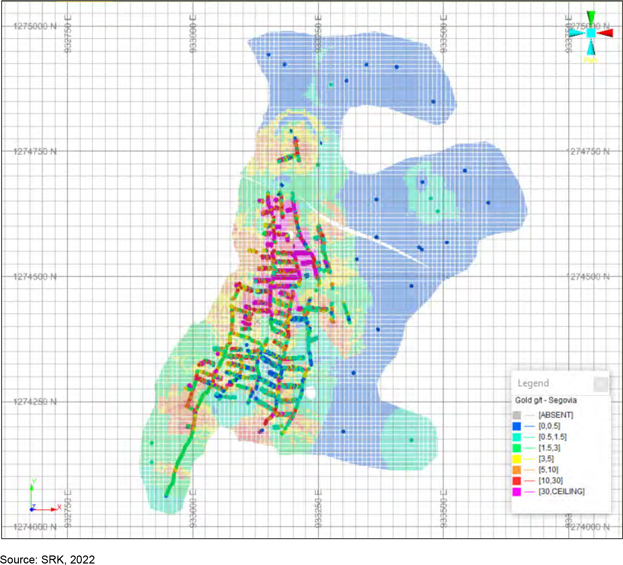
Figure 14-22: Examples of Visual Validation of Grade Distribution Composites Versus Block Model – Vera Vein
14.8.2 Comparative Statistics
SRK reviewed a comparison of the statistics of the composite grades to the block estimation grades to assess the potential for any bias in the estimation. A series of statistical comparisons were conducted including reviews of the histograms for each metal, mean analysis between the blocks and composites, and the relationship between the estimation passes and the amount of data used for each. This was done for all four models estimated with the focus on the main structures. Where differences were noted, SRK completed further detailed analysis in combination with the swath analysis discussed later in Section 14.8.3.
Summary tables of the main veins is shown in Table 14-12. The results indicate that the SRK estimates report slightly lower grades in the veins than the composites and slightly higher grades within the high-grade shoots. For reference, SRK has also completed a de-clustering exercise to note if there are any improvements (using approximate drill spacing grids). In the lower grade domains, the correlation is
|
BP/KD |
May 2022 |
| SRK Consulting (U.S.), Inc. NI 43-101 Technical Report – Segovia 2021 PFS Update |
Page 189 |
improved between the composites and the estimates, but in the higher-grade domains the differences typically increase with de-clustering.
At Providencia, the difference between the composite and estimates for the veins overall is reasonable with the block models typically reporting lower grades than the composites in the order of ± 10% when compared to the de-clustered means. The greatest variability in the comparison is noted in the low-grade Providencia vein estimates, which reported +33% and +25% to the raw and declustered means. SRK compared the visual comparison and results to the nearest neighbor checks which we deemed reasonable.
SRK completed visual validation to identify the key differences between the estimates using swath plots. On investigation, SRK has attributed a portion of this to the influence of higher grades at depth where the data density is lower, or in areas of previously high-grade material which has already been mined. SRK considers the visual validation in these areas is reasonable and reflects the underlying data, but SRK recommend follow-up sampling in these areas, but has classified these areas as low confidence in the current estimates, and additional drilling is required to confirm the Mineral Resources prior to mining.
The comparison at El Silencio shows a strong correlation between the declustered and block estimate means for Veta Manto [VEM]. The low-grade domain (HG10) estimated -1% lower in terms of the average grades, and the higher-grade areas have reported higher grades compared to the composites in the order of +7%.
At El Silencio within Veta National [NAL] (HG=30), SRK notes that the comparison of the capped composites shows the block estimates underestimating the raw gold values by approximately 29% or a difference of but this assumed to be related to clustering of higher grade channel sampling, as the comparison to the declustered mean is -6%. Infill drilling at the edge of the high-grade domain modelled in 2019 resulted in the definition of two distinct high-grade shoots with lower grades than estimated in between. Veta National (HG=30) is currently open at depth along a high-grade shoot and SRK implements a number of restrictions on the capped values in the second and third searches to limit potential over-estimation at depth. SRK decided initially during the 2020 estimate to limit the potential impact of high-grade sampling from the channels to close proximity to the current mining, so applied a cap of 90 g/t in the first pass, 60 g/t in the second pass and 30 g/t Au in the final pass, this has been maintained in the 2021 estimates. Infill drilling both in the high-grade shoot and around the edges of the shoot are required to improve the model, and therefore SRK has limited its extents during the classification process to reflect this uncertainty.
At Sandra K, the validation between the de-clustered composite mean and the block estimates are reasonable within HG10 and HG20 (Veta Techo), which form the majority of the main mining areas. The results in HG15 show lower grades in the block model than the composites (33.5%), which is a result of lower drilling density in low grade areas in the southern portion of the mine. The difference can be explained as a result of the clustering of the data and larger areas of low-grade material which have been sampled at a relatively wide drill spacing.
During 2021, GCM undertook further validation on the database via data captured from the Cogote Mine channel sampling programs. There is considered This results in a clear split in the block model between the shallow (Z>450 m) channel sampling and the wider-spaced deeper (Z<450 m) drilling. To further validate the Mineral Resources, SRK compared the channel sampling and block estimates
|
BP/KD |
May 2022 |
| SRK Consulting (U.S.), Inc. NI 43-101 Technical Report – Segovia 2021 PFS Update |
Page 190 |
above the elevation of 450 m, which reduced the bias per fault block between -0.5% to -22.3% when compared to the declustered mean.
The largest variations typically occur in fault blocks with low sample populations (i.e. HG=64), which only contains <10.0 % of the resources for the Julio Cogote veins. A comparison of the larger fault blocks indicated the differences are in the order of -11%. In all cases the block grades report lower than the composite grades and therefore in the QP’s opinion are more conservative. Further sampling is needed to support higher grades, and these domains have been limited to the Inferred category in the current estimates.
|
BP/KD |
May 2022 |
| SRK Consulting (U.S.), Inc. NI 43-101 Technical Report – Segovia 2021 PFS Update |
Page 191 |
Table 14-12: Summary of Validation Statistics Composites Versus OK Estimates
|
Domain |
Statistic | Mean Sample Data Au (g/t) | |
Declustered Sample Data Au (g/t) |
|
BlockData1 (Tonnage Weighted) Au (g/t) |
|
BlockData1 vs. Sample % Diff |
|
BlockData vs Declustered % Diff |
||||||||||||||||||
| PV |
10 |
Mean | 4.83 | 4.34 | 3.24 | -33.0% | -25.4% | |||||||||||||||||||||
| Std Dev | 9.20 | 8.66 | 3.49 | |||||||||||||||||||||||||
| Variance | 84.63 | 74.95 | 12.16 | |||||||||||||||||||||||||
| CV | 1.90 | 2.00 | 1.08 | |||||||||||||||||||||||||
|
20 |
Mean | 36.06 | 34.12 | 41.63 | 15.4% | 22.0% | ||||||||||||||||||||||
| Std Dev | 58.03 | 56.58 | 37.32 | |||||||||||||||||||||||||
| Variance | 3,368.04 | 3,201.46 | 1,392.43 | |||||||||||||||||||||||||
| CV | 1.61 | 1.66 | 0.90 | |||||||||||||||||||||||||
|
30 |
Mean | 4.23 | 3.78 | 3.15 | -25.5% | -16.6% | ||||||||||||||||||||||
| Std Dev | 6.20 | 6.12 | 2.70 | |||||||||||||||||||||||||
| Variance | 38.46 | 37.41 | 7.28 | |||||||||||||||||||||||||
| CV | 1.47 | 1.62 | 0.86 | |||||||||||||||||||||||||
|
40 |
Mean | 4.83 | 5.28 | 4.89 | 1.3% | -7.4% | ||||||||||||||||||||||
| Std Dev | 5.78 | 6.44 | 2.24 | |||||||||||||||||||||||||
| Variance | 33.42 | 41.48 | 5.00 | |||||||||||||||||||||||||
| CV | 1.20 | 1.22 | 0.46 | |||||||||||||||||||||||||
|
50 |
Mean | 127.41 | 94.12 | 98.04 | -23.0% | 4.2% | ||||||||||||||||||||||
| Std Dev | 108.81 | 105.64 | 49.35 | |||||||||||||||||||||||||
| Variance | 11,838.88 | 11,158.87 | 2,435.59 | |||||||||||||||||||||||||
| CV | 0.85 | 1.12 | 0.50 | |||||||||||||||||||||||||
|
60 |
Mean | 127.41 | 94.12 | 98.04 | -23.0% | 4.2% | ||||||||||||||||||||||
| Std Dev | 108.81 | 105.64 | 49.35 | |||||||||||||||||||||||||
| Variance | 11,838.88 | 11,158.87 | 2,435.59 | |||||||||||||||||||||||||
| CV | 0.85 | 1.12 | 0.50 | |||||||||||||||||||||||||
|
70 |
Mean | 16.01 | 12.59 | 13.52 | -15.5% | 7.4% | ||||||||||||||||||||||
| Std Dev | 18.36 | 17.31 | 7.80 | |||||||||||||||||||||||||
| Variance | 337.02 | 299.80 | 60.79 | |||||||||||||||||||||||||
| CV | 1.15 | 1.37 | 0.58 | |||||||||||||||||||||||||
|
80 |
Mean | 3.51 | 3.59 | 3.62 | 3.1% | 0.8% | ||||||||||||||||||||||
| Std Dev | 4.95 | 4.77 | 1.56 | |||||||||||||||||||||||||
| Variance | 24.46 | 22.78 | 2.43 | |||||||||||||||||||||||||
| CV | 1.41 | 1.33 | 0.43 | |||||||||||||||||||||||||
|
90 |
Mean | 58.83 | 48.23 | 58.72 | -0.2% | 21.7% | ||||||||||||||||||||||
| Std Dev | 53.19 | 51.11 | 29.21 | |||||||||||||||||||||||||
| Variance | 2,829.39 | 2,611.75 | 853.35 | |||||||||||||||||||||||||
| CV | 0.90 | 1.06 | 0.50 | |||||||||||||||||||||||||
|
100 |
Mean | 6.89 | 8.49 | 6.36 | -7.7% | -25.1% | ||||||||||||||||||||||
| Std Dev | 10.19 | 10.61 | 2.68 | |||||||||||||||||||||||||
| Variance | 103.89 | 112.62 | 7.19 | |||||||||||||||||||||||||
| CV | 1.48 | 1.25 | 0.42 | |||||||||||||||||||||||||
|
BP/KD |
May 2022 |
| SRK Consulting (U.S.), Inc. NI 43-101 Technical Report – Segovia 2021 PFS Update |
Page 192 |
|
Domain |
Statistic | Mean Sample Data Au (g/t) |
Declustered Sample Data Au (g/t) |
BlockData1 Au (g/t) |
BlockData1 vs. Sample % Diff |
BlockData1 vs. Declustered% Diff |
||||||||||
| ES |
10 | Mean | 3.06 | 3.10 | 3.06 | 0% | -1% | |||||||||
| Std Dev | 4.57 | 4.42 | 1.93 | |||||||||||||
| Variance | 20.88 | 19.50 | 3.72 | |||||||||||||
| CV | 1.50 | 1.42 | 0.63 | |||||||||||||
| 11 | Mean | 4.98 | 4.51 | 4.02 | -19% | -11% | ||||||||||
| Std Dev | 7.78 | 11.64 | 4.54 | |||||||||||||
| Variance | 60.58 | 135.39 | 20.57 | |||||||||||||
| CV | 1.56 | 2.58 | 1.13 | |||||||||||||
| 20 | Mean | 18.86 | 19.25 | 20.61 | 9% | 7% | ||||||||||
| Std Dev | 28.21 | 28.96 | 14.70 | |||||||||||||
| Variance | 795.77 | 838.94 | 216.02 | |||||||||||||
| CV | 1.50 | 1.50 | 0.71 | |||||||||||||
| 30 | Mean | 9.77 | 7.38 | 6.93 | -29% | -6% | ||||||||||
| Std Dev | 15.43 | 13.63 | 9.55 | |||||||||||||
| Variance | 238.11 | 185.83 | 91.20 | |||||||||||||
| CV | 1.58 | 1.85 | 1.38 | |||||||||||||
|
40 |
Mean | 11.89 | 8.43 | 9.12 | -23% | 8% | ||||||||||
| Std Dev | 17.05 | 17.30 | 6.96 | |||||||||||||
| Variance | 290.58 | 299.26 | 48.45 | |||||||||||||
| CV | 1.44 | 1.79 | 0.76 | |||||||||||||
| 50 | Mean | 1.64 | 1.64 | 1.48 | -10% | -10% | ||||||||||
| Std Dev | 1.15 | 1.15 | 0.48 | |||||||||||||
| Variance | 1.32 | 1.32 | 0.23 | |||||||||||||
| CV | 0.70 | 0.70 | 0.32 | |||||||||||||
| 51 | Mean | 2.67 | 2.80 | 2.87 | 7% | 2% | ||||||||||
| Std Dev | 1.67 | 1.86 | 1.15 | |||||||||||||
| Variance | 2.79 | 3.46 | 1.33 | |||||||||||||
| CV | 0.63 | 0.66 | 0.40 | |||||||||||||
| 60 | Mean | 8.53 | 7.05 | 6.75 | -21% | -4% | ||||||||||
| Std Dev | 14.95 | 8.69 | 6.74 | |||||||||||||
| Variance | 223.43 | 75.59 | 45.41 | |||||||||||||
| CV | 1.75 | 1.23 | 1.00 | |||||||||||||
| 61 | Mean | 13.95 | 10.01 | 10.55 | -24% | 5% | ||||||||||
| Std Dev | 19.56 | 24.23 | 12.02 | |||||||||||||
| Variance | 382.58 | 587.15 | 144.58 | |||||||||||||
| CV | 1.40 | 2.42 | 1.14 | |||||||||||||
| 70 | Mean | 11.16 | 7.70 | 8.20 | -27% | 7% | ||||||||||
| Std Dev | 16.57 | 13.53 | 8.48 | |||||||||||||
|
BP/KD |
May 2022 |
| SRK Consulting (U.S.), Inc. NI 43-101 Technical Report – Segovia 2021 PFS Update |
Page 193 |
|
Domain |
Statistic | Mean Sample Data Au (g/t) |
Declustered Sample Data Au (g/t) |
BlockData1 Au (g/t) |
BlockData1 vs. Sample % Diff |
BlockData1 vs. Declustered% Diff |
||||||||||
|
|
Variance | 274.44 | 182.95 | 71.89 | ||||||||||||
| CV | 1.49 | 1.76 | 1.03 | |||||||||||||
| 80 | Mean | 9.33 | 8.95 | 8.82 | -5% | -2% | ||||||||||
| Std Dev | 13.72 | 13.66 | 5.24 | |||||||||||||
| Variance | 188.28 | 186.46 | 27.50 | |||||||||||||
| CV | 1.47 | 1.52 | 0.59 | |||||||||||||
| 90 | Mean | 2.44 | 1.90 | 1.92 | -21% | 1% | ||||||||||
| Std Dev | 2.90 | 2.15 | 1.27 | |||||||||||||
| Variance | 8.39 | 4.64 | 1.62 | |||||||||||||
| CV | 1.19 | 1.14 | 0.66 | |||||||||||||
| 91 | Mean | 23.98 | 34.55 | 35.40 | 48% | 2% | ||||||||||
| Std Dev | 44.16 | 29.77 | 18.49 | |||||||||||||
| Variance | 1,950.36 | 886.48 | 341.82 | |||||||||||||
| CV | 1.84 | 0.86 | 0.52 | |||||||||||||
| 100 | Mean | 2.54 | 1.92 | 1.88 | -26% | -2% | ||||||||||
| Std Dev | 3.19 | 2.96 | 2.41 | |||||||||||||
| Variance | 10.18 | 8.74 | 5.81 | |||||||||||||
| CV | 1.26 | 1.54 | 1.29 | |||||||||||||
| 110 | Mean | 2.53 | 1.79 | 1.99 | -21% | 12% | ||||||||||
| Std Dev | 4.02 | 3.01 | 1.29 | |||||||||||||
| Variance | 16.17 | 9.04 | 1.67 | |||||||||||||
| CV | 1.59 | 1.68 | 0.65 | |||||||||||||
| 111 | Mean | 2.53 | 1.79 | 1.97 | -22% | 10% | ||||||||||
| Std Dev | 4.02 | 3.01 | 1.52 | |||||||||||||
| Variance | 16.17 | 9.04 | 2.31 | |||||||||||||
| CV | 1.59 | 1.68 | 0.77 | |||||||||||||
| 120 | Mean | 15.56 | 15.75 | 17.29 | 11% | 10% | ||||||||||
| Std Dev | 16.75 | 10.83 | 10.14 | |||||||||||||
| Variance | 280.48 | 117.23 | 102.81 | |||||||||||||
| CV | 1.08 | 0.69 | 0.59 | |||||||||||||
| 130 | Mean | 2.01 | 1.36 | 1.37 | -32% | 0% | ||||||||||
| Std Dev | 3.31 | 2.11 | 0.98 | |||||||||||||
| Variance | 10.97 | 4.47 | 0.97 | |||||||||||||
| CV | 1.64 | 1.55 | 0.72 | |||||||||||||
| 131 | Mean | 21.39 | 21.52 | 20.47 | -4% | -5% | ||||||||||
| Std Dev | 28.15 | 26.92 | 12.77 | |||||||||||||
| Variance | 792.15 | 724.86 | 163.14 | |||||||||||||
| CV | 1.32 | 1.25 | 0.62 | |||||||||||||
|
BP/KD |
May 2022 |
| SRK Consulting (U.S.), Inc. NI 43-101 Technical Report – Segovia 2021 PFS Update |
Page 194 |
|
Domain |
Statistic | Mean Sample Data Au (g/t) |
Declustered Sample Data Au (g/t) |
BlockData1 Au (g/t) |
BlockData1 vs. Sample % Diff |
BlockData1 vs. Declustered% Diff |
||||||||||
|
|
160 | Mean | 1.83 | 1.59 | 1.73 | -5% | 9% | |||||||||
| Std Dev | 0.57 | 0.68 | 0.60 | |||||||||||||
| Variance | 0.33 | 0.46 | 0.36 | |||||||||||||
| CV | 0.31 | 0.43 | 0.34 | |||||||||||||
| 161 | Mean | 5.37 | 7.54 | 7.94 | 48% | 5% | ||||||||||
| Std Dev | 6.51 | 8.67 | 5.68 | |||||||||||||
| Variance | 42.45 | 75.25 | 32.21 | |||||||||||||
| CV | 1.21 | 1.15 | 0.71 | |||||||||||||
| 170 | Mean | 2.92 | 2.97 | 2.64 | -10% | -11% | ||||||||||
| Std Dev | 4.39 | 4.23 | 1.30 | |||||||||||||
| Variance | 19.31 | 17.86 | 1.69 | |||||||||||||
| CV | 1.50 | 1.42 | 0.49 | |||||||||||||
| 171 | Mean | 23.44 | 23.63 | 25.32 | 8% | 7% | ||||||||||
| Std Dev | 29.42 | 29.93 | 15.84 | |||||||||||||
| Variance | 865.74 | 895.52 | 250.81 | |||||||||||||
| CV | 1.26 | 1.27 | 0.63 | |||||||||||||
| 190 | Mean | 9.09 | 9.92 | 10.14 | 12% | 2% | ||||||||||
| Std Dev | 13.57 | 14.72 | 8.13 | |||||||||||||
| Variance | 184.17 | 216.82 | 66.11 | |||||||||||||
| CV | 1.49 | 1.48 | 0.80 | |||||||||||||
| 210 | Mean | 2.25 | 2.86 | 2.75 | 22% | -4% | ||||||||||
| Std Dev | 2.70 | 3.43 | 1.35 | |||||||||||||
| Variance | 7.30 | 11.77 | 1.81 | |||||||||||||
| CV | 1.20 | 1.20 | 0.49 | |||||||||||||
| 220 | Mean | 2.67 | 2.45 | 2.65 | -1% | 8% | ||||||||||
| Std Dev | 2.92 | 2.81 | 1.36 | |||||||||||||
| Variance | 8.51 | 7.89 | 1.84 | |||||||||||||
| CV | 1.09 | 1.15 | 0.51 | |||||||||||||
| 221 | Mean | 25.99 | 31.50 | 30.54 | 18% | -3% | ||||||||||
| Std Dev | 29.81 | 33.18 | 19.22 | |||||||||||||
| Variance | 888.91 | 1,100.72 | 369.55 | |||||||||||||
| CV | 1.15 | 1.05 | 0.63 | |||||||||||||
|
BP/KD |
May 2022 |
| SRK Consulting (U.S.), Inc. NI 43-101 Technical Report – Segovia 2021 PFS Update |
Page 195 |
| Domain | Statistic |
Mean Sample Data Au (g/t) |
Declustered Sample Data Au (g/t) |
BlockData1 (Tonnage Weighted) Au (g/t) |
BlockData1 vs. Sample % Diff |
BlockData1 vs. Declustered % Diff |
||||||||||
|
S K |
1 0 |
Mean | 3.87 | 3.54 | 3.52 | -9.0% | -0.6% | |||||||||
| Std Dev | 7.53 | 6.90 | 3.31 | |||||||||||||
| Variance | 56.76 | 47.55 | 10.98 | |||||||||||||
| CV | 1.95 | 1.95 | 0.94 | |||||||||||||
| 1 5 |
Mean | 3.24 | 3.24 | 2.15 | -33.6% | -33.5% | ||||||||||
| Std Dev | 6.71 | 6.95 | 2.28 | |||||||||||||
| Variance | 45.03 | 48.29 | 5.19 | |||||||||||||
| CV | 2.07 | 2.15 | 1.06 | |||||||||||||
| 2 0 |
Mean | 14.26 | 12.93 | 14.84 | 4.1% | 14.8% | ||||||||||
| Std Dev | 20.94 | 19.54 | 9.91 | |||||||||||||
| Variance | 438.61 | 381.62 | 98.26 | |||||||||||||
| CV | 1.47 | 1.51 | 0.67 | |||||||||||||
| 3 0 |
Mean | 10.77 | 9.46 | 8.41 | -21.9% | -11.1% | ||||||||||
| Std Dev | 17.58 | 16.12 | 6.66 | |||||||||||||
| Variance | 308.91 | 260.01 | 44.40 | |||||||||||||
| CV | 1.63 | 1.70 | 0.79 | |||||||||||||
| 3 1 |
Mean | 1.57 | 1.52 | 2.68 | 70.3% | 76.7% | ||||||||||
| Std Dev | 2.59 | 2.55 | 1.99 | |||||||||||||
| Variance | 6.73 | 6.50 | 3.97 | |||||||||||||
| CV | 1.65 | 1.68 | 0.74 | |||||||||||||
| 4 0 |
Mean | 6.94 | 6.02 | 5.47 | -21.1% | -9.1% | ||||||||||
| Std Dev | 14.18 | 13.34 | 5.65 | |||||||||||||
| Variance | 201.17 | 178.00 | 31.92 | |||||||||||||
| CV | 2.04 | 2.22 | 1.03 | |||||||||||||
| 5 0 |
Mean | 13.55 | 7.28 | 5.90 | -56.4% | -19.0% | ||||||||||
| Std Dev | 21.53 | 16.34 | 7.30 | |||||||||||||
|
BP/KD |
May 2022 |
| SRK Consulting (U.S.), Inc. NI 43-101 Technical Report – Segovia 2021 PFS Update |
Page 196 |
|
|
Variance | 463.45 | 267.10 | 53.27 | ||||||||||||
| CV | 1.59 | 2.24 | 1.24 | |||||||||||||
|
6 0 |
Mean | 10.16 | 10.30 | 9.55 | -6.0% | -7.3% | ||||||||||
| Std Dev | 14.71 | 14.64 | 8.78 | |||||||||||||
| Variance | 216.49 | 214.40 | 77.01 | |||||||||||||
| CV | 1.45 | 1.42 | 0.92 | |||||||||||||
|
6 1 |
Mean | 24.09 | 22.18 | 20.67 | -14.2% | -6.8% | ||||||||||
| Std Dev | 22.24 | 21.54 | 13.94 | |||||||||||||
| Variance | 494.51 | 463.80 | 194.46 | |||||||||||||
| CV | 0.92 | 0.97 | 0.67 | |||||||||||||
|
6 2 |
Mean | 27.12 | 23.26 | 17.57 | -35.2% | -24.5% | ||||||||||
| Std Dev | 32.62 | 30.58 | 12.87 | |||||||||||||
| Variance | 1,064.38 | 935.12 | 165.62 | |||||||||||||
| CV | 1.20 | 1.31 | 0.73 | |||||||||||||
|
6 3 |
Mean | 32.48 | 27.09 | 12.90 | -60.3% | -52.4% | ||||||||||
| Std Dev | 37.06 | 35.02 | 15.16 | |||||||||||||
| Variance | 1,373.54 | 1,226.27 | 229.81 | |||||||||||||
| CV | 1.14 | 1.29 | 1.18 |
|
BP/KD |
May 2022 |
| SRK Consulting (U.S.), Inc. NI 43-101 Technical Report – Segovia 2021 PFS Update |
Page 197 |
| Domain | Statistic | Mean Sample Data Au(g/t) |
Declustered Sample Data Au (g/t) |
BlockData1 (Tonnage Weighted) Au (g/t) |
BlockData1 vs. Sample % Diff |
BlockData1 vs. Declustered % Diff |
||||||||||||||||||||||
|
VERA |
10 | Mean | 4.44 | 2.05 | 1.93 | -57% | -6% | |||||||||||||||||||||
| Std Dev | 6.68 | 4.85 | 2.87 | |||||||||||||||||||||||||
| Variance | 44.61 | 23.56 | 8.23 | |||||||||||||||||||||||||
| CV | 1.50 | 2.36 | 1.49 | |||||||||||||||||||||||||
| 20 | Mean | 36.30 | 35.50 | 37.74 | 4% | 6% | ||||||||||||||||||||||
| Std Dev | 40.88 | 41.16 | 23.71 | |||||||||||||||||||||||||
| Variance | 1,671.60 | 1,694.38 | 562.14 | |||||||||||||||||||||||||
| CV | 1.13 | 1.16 | 0.63 | |||||||||||||||||||||||||
| 30 | Mean | 2.66 | 1.15 | 1.10 | -59% | -4% | ||||||||||||||||||||||
| Std Dev | 8.36 | 5.64 | 1.75 | |||||||||||||||||||||||||
| Variance | 69.77 | 31.78 | 3.06 | |||||||||||||||||||||||||
| CV | 3.14 | 4.90 | 1.59 | |||||||||||||||||||||||||
| 40 | Mean | 2.55 | 2.67 | 2.69 | 5% | 1% | ||||||||||||||||||||||
| Std Dev | 6.49 | 6.75 | 2.50 | |||||||||||||||||||||||||
| Variance | 42.12 | 45.53 | 6.26 | |||||||||||||||||||||||||
| CV | 2.55 | 2.53 | 0.93 | |||||||||||||||||||||||||
| Domain | Statistic | Mean Sample Data Au (g/t) |
Declustered Sample Data Au (g/t) |
BlockData1 (Tonnage Weighted) Au (g/t) |
Block Data1 vs. Sample % Diff |
Block Data vs Declustered % Diff |
||||||||||||||||||
| CL |
10 | Mean | 3.50 | 2.70 | 3.02 | -13.6% | 11.9% | |||||||||||||||||
| Std Dev | 5.14 | 4.90 | 3.21 | |||||||||||||||||||||
| Variance | 26.41 | 24.04 | 10.31 | |||||||||||||||||||||
| CV | 1.47 | 1.82 | 1.06 | |||||||||||||||||||||
| 20 | Mean | 3.50 | 2.70 | 3.02 | -13.6% | 11.9% | ||||||||||||||||||
| Std Dev | 5.14 | 4.90 | 3.21 | |||||||||||||||||||||
| Variance | 26.41 | 24.04 | 10.31 | |||||||||||||||||||||
| CV | 1.47 | 1.82 | 1.06 | |||||||||||||||||||||
| 30 | Mean | 13.68 | 6.19 | 6.74 | -50.7% | 8.8% | ||||||||||||||||||
| Std Dev | 18.13 | 14.33 | 10.74 | |||||||||||||||||||||
| Variance | 328.55 | 205.34 | 115.41 | |||||||||||||||||||||
| CV | 1.32 | 2.31 | 1.59 | |||||||||||||||||||||
| 40 | Mean | 1.10 | 1.17 | 0.62 | -43.2% | -46.8% | ||||||||||||||||||
| Std Dev | 1.48 | 1.52 | 0.40 | |||||||||||||||||||||
| Variance | 2.21 | 2.30 | 0.16 | |||||||||||||||||||||
| CV | 1.35 | 1.29 | 0.64 | |||||||||||||||||||||
Source: SRK, 2022
|
BP/KD |
May 2022 |
| SRK Consulting (U.S.), Inc. NI 43-101 Technical Report – Segovia 2021 PFS Update |
Page 198 |
| 14.8.3 | Swath Plots |
A more local comparison between the blocks and the composites is made using swath plots. The comparisons show both the varying means of the block and composites (declustered) along swaths or slices through the model, as well as the amount of data supporting the estimate in each swath. The swath plots show that there are no significant local biases in the estimation.
The areas of highest variability between the composites and estimates can be summarized as:
| • | At Providencia (Figure 14-23), occur between 931300 E and 931800 E within the low-grade domain (HG=10), which relates to the areas surrounding the high-grade shoots. The average grade of the block grades is approximately 1 g/t higher than the composite. While the average grades of the composite and block models in the high-grade show higher variance than the low grade (approx. 10 to 15%), the swath plot shows a strong correlation between grades. |
| • | At El Silencio the low-grade Veta Manto [VEM] domain displays a strong correlation on the swath plots. The biggest differences are noted between slices 50 and 70 and after slices 80 in the cross strike validation plot in the high-grade which can be due to the use of sliding capping and the not continuous distribution of the high grade domain (Figure 14-26). SRK recommends further drilling around the areas away from the channel sampling to confirm the composite grades and help improve the definition of the geological domains. Further review of the highest bias areas within VEM, confirmed these areas to have been depleted so there is limited impact from any bias on the current Mineral Resource. |
| • | The Sandra K swath analysis show satisfactory correlation between the composite and block estimates. Where larger differences were noted, comparison to the declustered means have been more acceptable. |
| • | The swath analysis at Carla is limited in comparison to the other mines due to the lower sample volumes. Review of the charts indicate no major bias. |
| • | The swath plots at Vera show good correlation between data and blocks for the high-grade population in the Vera vein (HG=20), Figure 14-30. The blocks in the low-grade population of Vera show lower grades that the data, which is a result of the use of sliding capping used to avoid overestimation of high-grade (Figure 14-29). |
SRK also highlights that the current model assumed hard contacts, but it is possible that there is a degree of soft boundaries between the higher and lower grade mineralization which is not truly reflected in the current estimate. SRK recommends that GCM monitor this during mining and generate local scale mining block models to determine if there is a requirement for changes in the next MRE methodology. To achieve this, SRK recommends that the mine has systems in place to generate routine updated grade control models using the latest sampling information.
SRK has presented the key swath plots of the main mineralized domains in Figure 14-23 to Figure 14-30.
|
BP/KD |
April 2022 |
| SRK Consulting (U.S.), Inc. NI 43-101 Technical Report – Segovia 2021 PFS Update |
Page 199 |
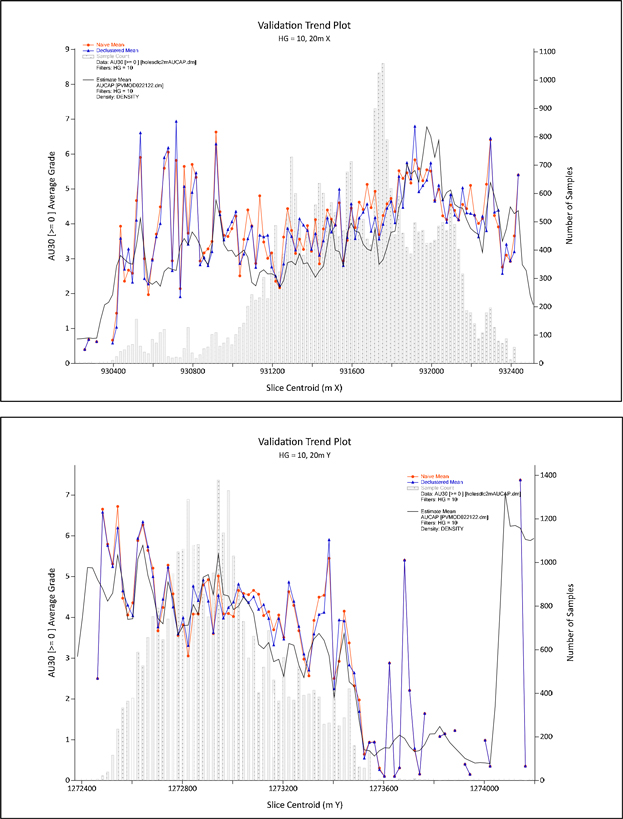
|
BP/KD |
April 2022 |
| SRK Consulting (U.S.), Inc. NI 43-101 Technical Report – Segovia 2021 PFS Update |
Page 200 |
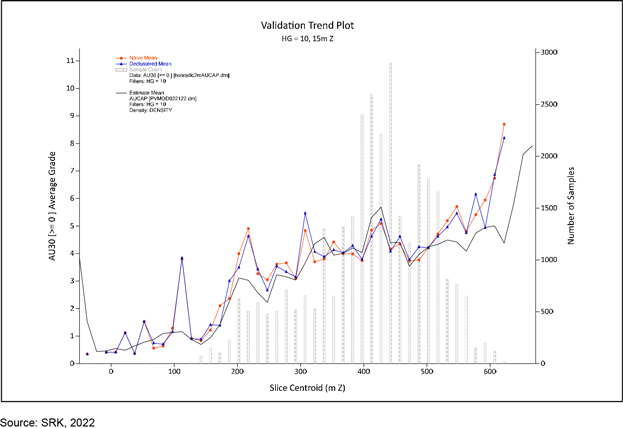
Figure 14-23: Swath Analysis at Providencia HG=10
|
BP/KD |
April 2022 |
| SRK Consulting (U.S.), Inc. NI 43-101 Technical Report – Segovia 2021 PFS Update |
Page 201 |
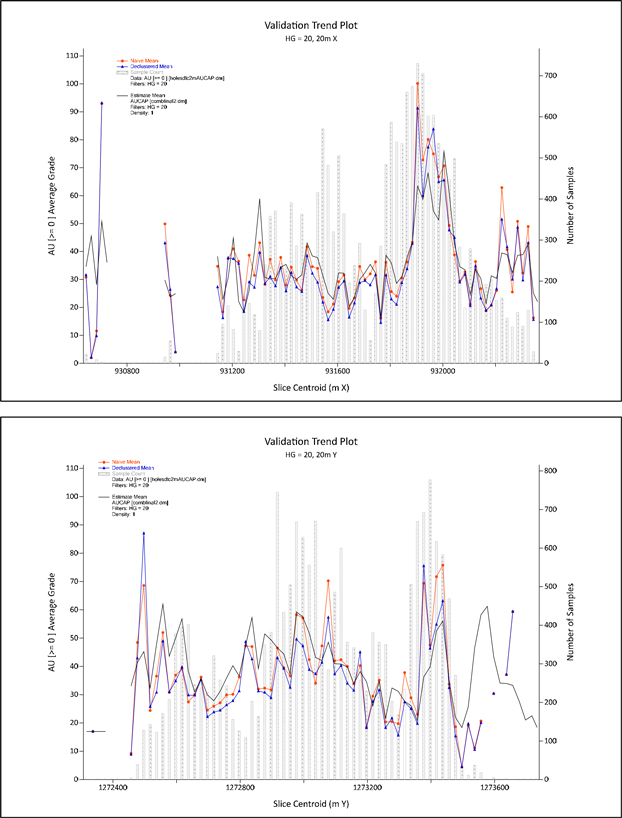
|
BP/KD |
April 2022 |
| SRK Consulting (U.S.), Inc. NI 43-101 Technical Report – Segovia 2021 PFS Update |
Page 202 |
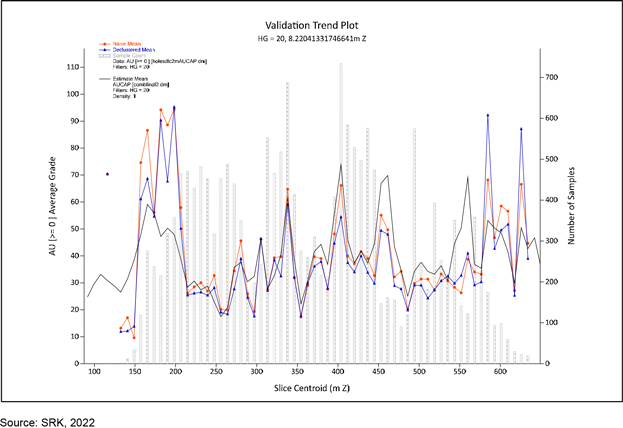
Figure 14-24: Swath Analysis at Providencia HG=20
|
BP/KD |
April 2022 |
| SRK Consulting (U.S.), Inc. NI 43-101 Technical Report – Segovia 2021 PFS Update |
Page 203 |
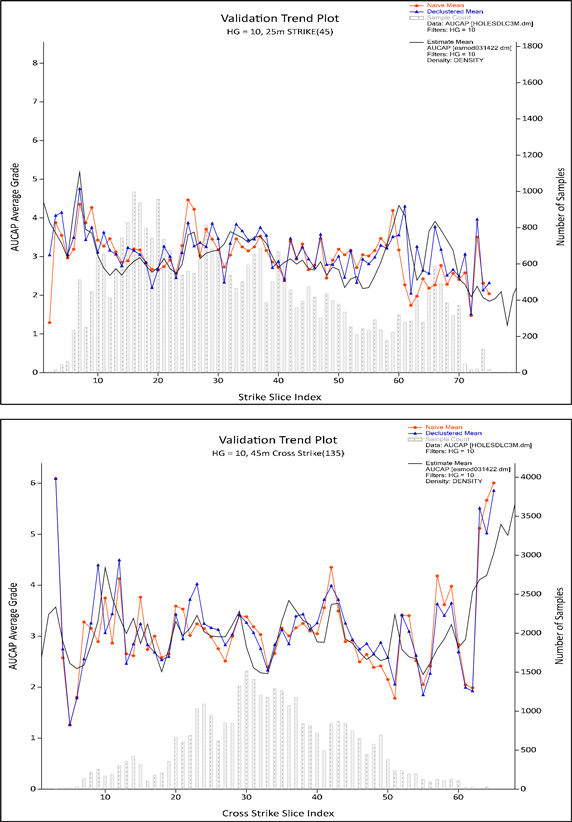
|
BP/KD |
April 2022 |
| SRK Consulting (U.S.), Inc. NI 43-101 Technical Report – Segovia 2021 PFS Update |
Page 204 |
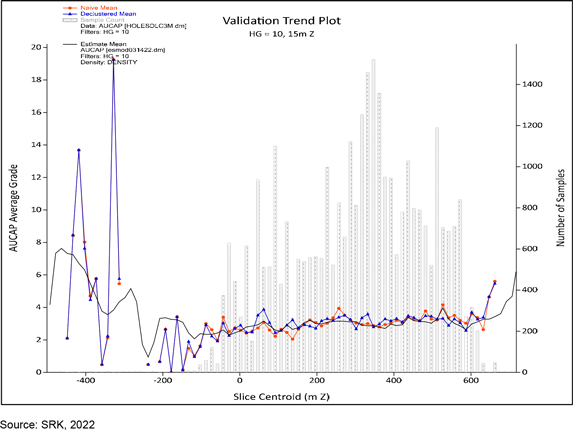
Figure 14-25: Example of Swath Analysis at El Silencio HG=10
|
BP/KD |
April 2022 |
| SRK Consulting (U.S.), Inc. NI 43-101 Technical Report – Segovia 2021 PFS Update |
Page 205 |
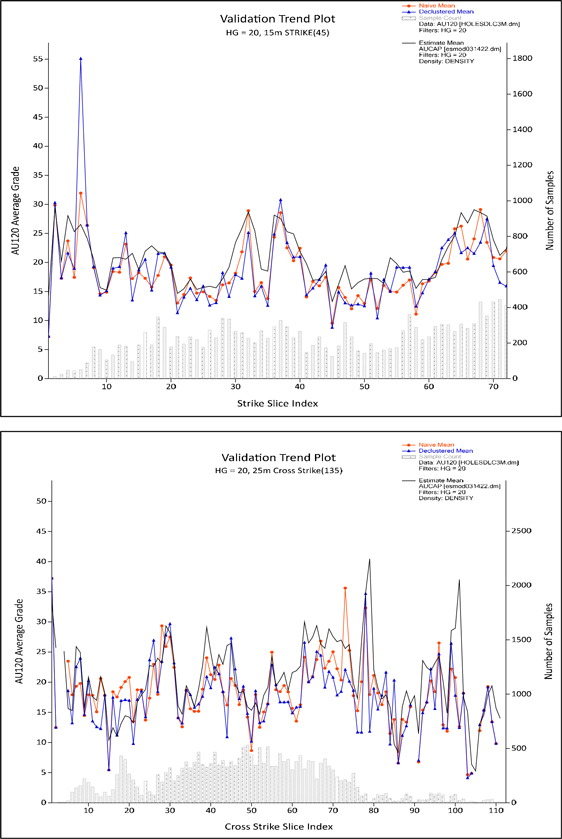
|
BP/KD |
April 2022 |
| SRK Consulting (U.S.), Inc. NI 43-101 Technical Report – Segovia 2021 PFS Update |
Page 206 |
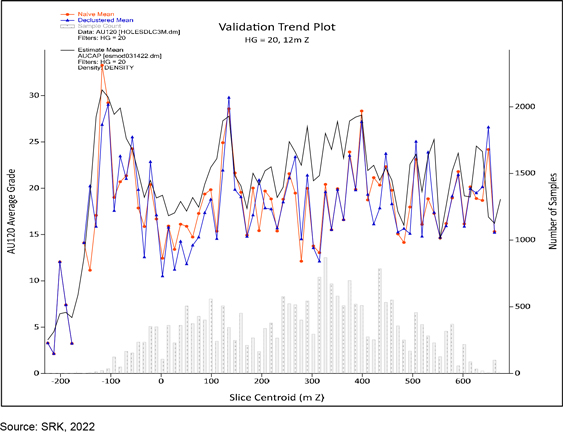
Figure 14-26: Example of Swath Analysis at El Silencio HG=20
|
BP/KD |
April 2022 |
| SRK Consulting (U.S.), Inc. NI 43-101 Technical Report – Segovia 2021 PFS Update |
Page 207 |
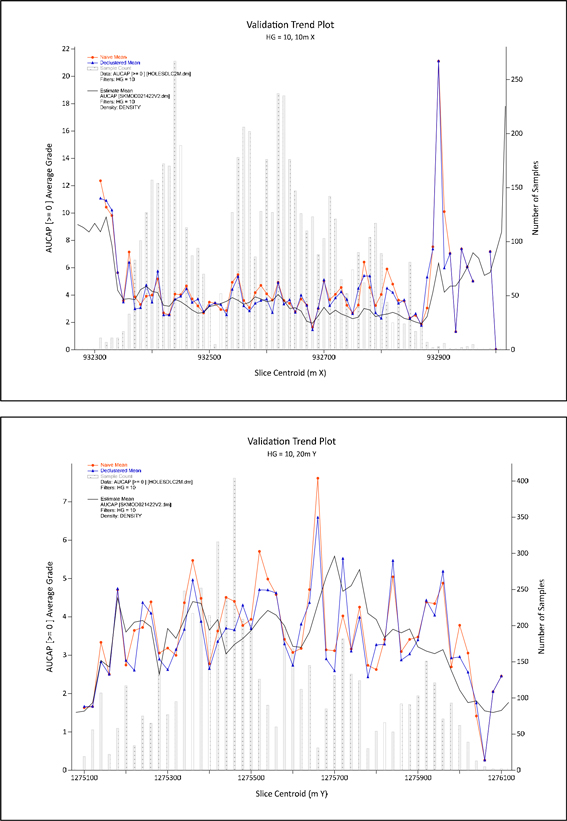
|
BP/KD |
April 2022 |
| SRK Consulting (U.S.), Inc. NI 43-101 Technical Report – Segovia 2021 PFS Update |
Page 208 |
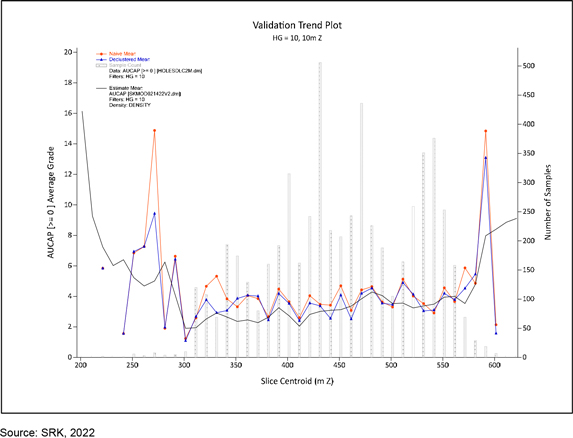
Figure 14-27: Example of SWATH Analysis Completed at Sandra K (HG=10)
|
BP/KD |
April 2022 |
| SRK Consulting (U.S.), Inc. NI 43-101 Technical Report – Segovia 2021 PFS Update |
Page 209 |
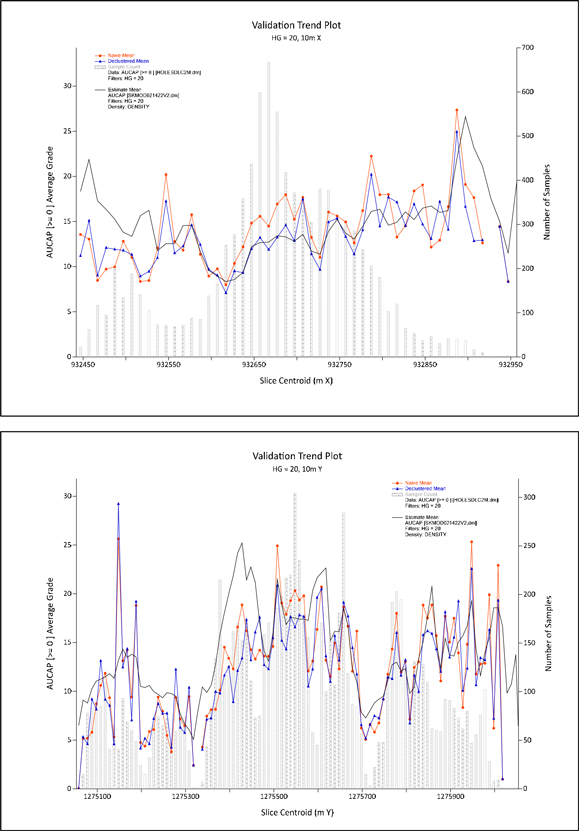
|
BP/KD |
April 2022 |
| SRK Consulting (U.S.), Inc. NI 43-101 Technical Report – Segovia 2021 PFS Update |
Page 210 |
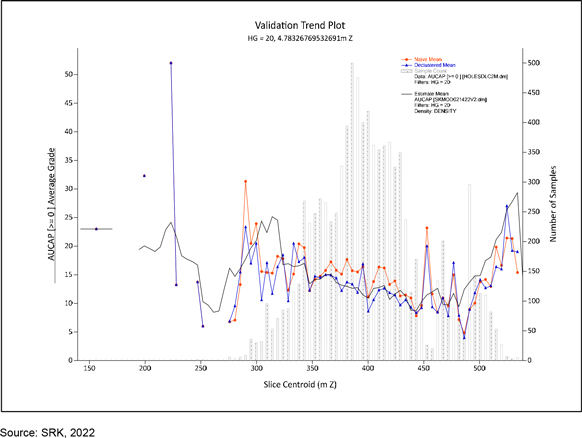
Figure 14-28: Example of SWATH Analysis Completed at Sandra K (HG=20)
|
BP/KD |
April 2022 |
| SRK Consulting (U.S.), Inc. NI 43-101 Technical Report – Segovia 2021 PFS Update |
Page 211 |
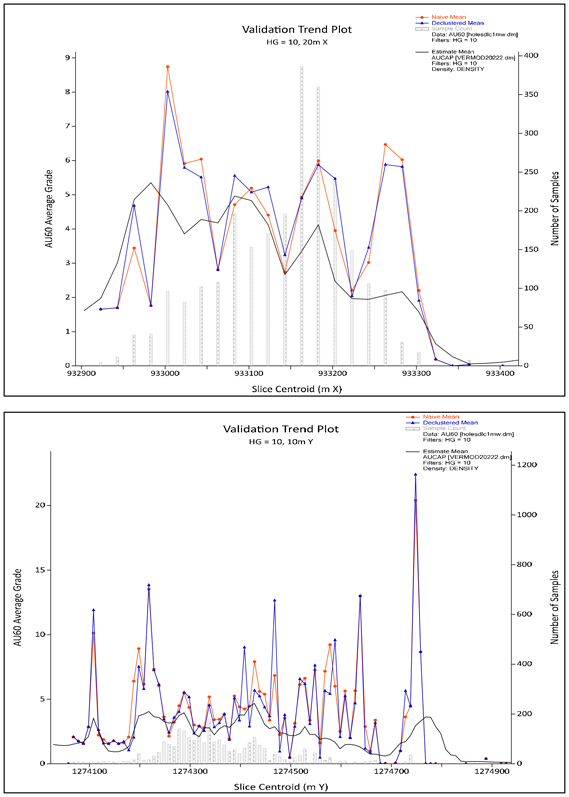
|
BP/KD |
April 2022 |
| SRK Consulting (U.S.), Inc. NI 43-101 Technical Report – Segovia 2021 PFS Update |
Page 212 |
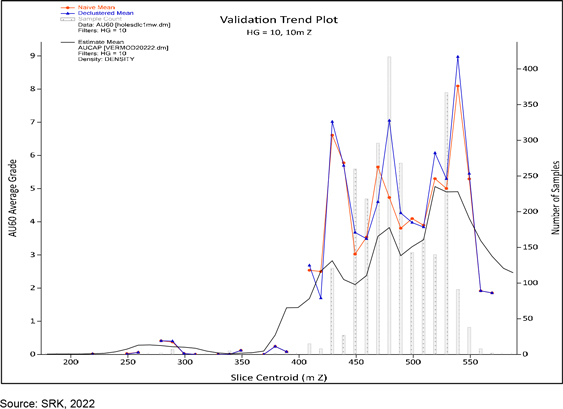
Figure 14-29: Example of SWATH Analysis Completed at Vera (HG=10)
|
BP/KD |
April 2022 |
| SRK Consulting (U.S.), Inc. NI 43-101 Technical Report – Segovia 2021 PFS Update |
Page 213 |
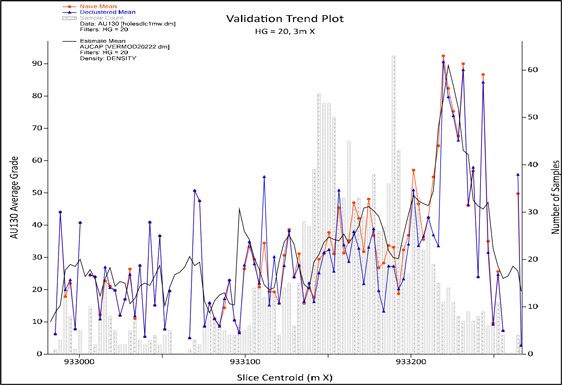
|
BP/KD |
April 2022 |
| SRK Consulting (U.S.), Inc. NI 43-101 Technical Report – Segovia 2021 PFS Update |
Page 214 |
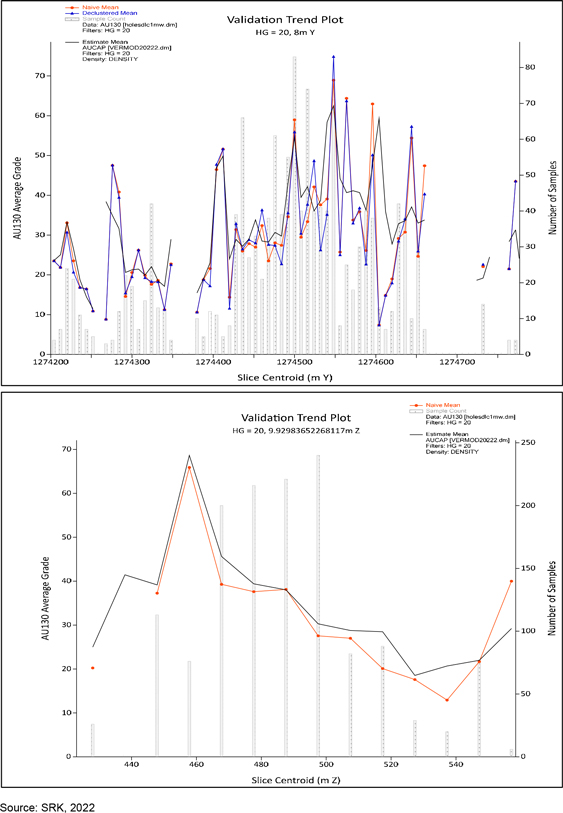
Figure 14-30: Example of SWATH Analysis Completed at Vera (HG=20)
|
BP/KD |
April 2022 |
| SRK Consulting (U.S.), Inc. NI 43-101 Technical Report – Segovia 2021 PFS Update |
Page 215 |
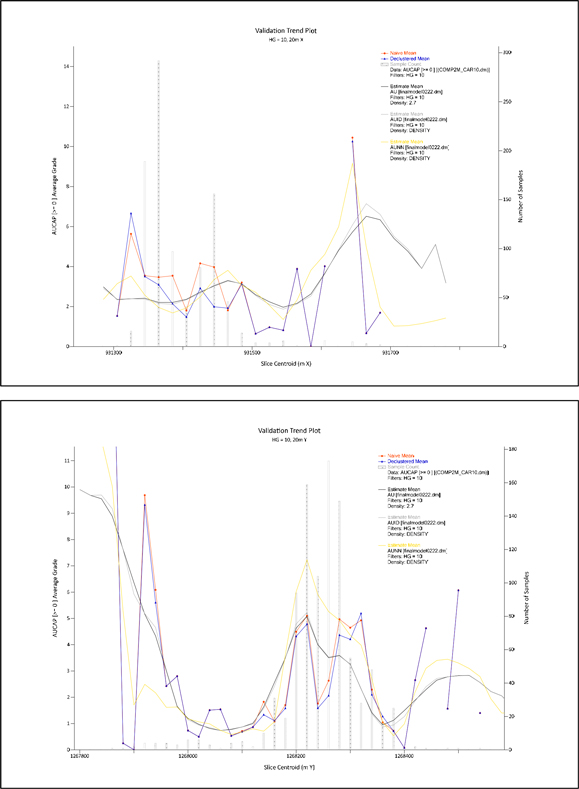
|
BP/KD |
April 2022 |
| SRK Consulting (U.S.), Inc. NI 43-101 Technical Report – Segovia 2021 PFS Update |
Page 216 |
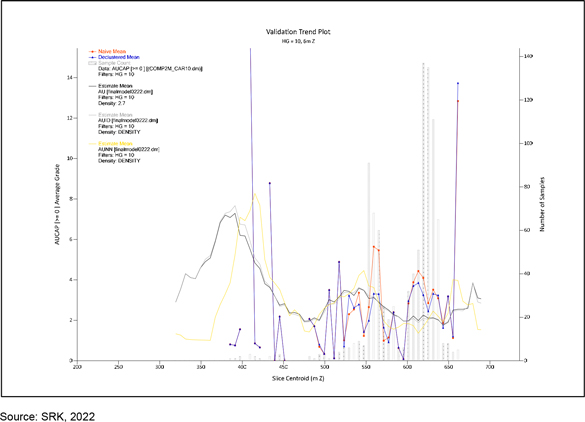
Figure 14-31: Example of SWATH Analysis Completed at Carla (HG=10)
| 14.9 | Resource Classification |
Block model quantities and grade estimates for the Project were classified according to the CIM Definition Standards for Mineral Resources and Mineral Reserves (May 2014).
Mineral Resource classification is typically a subjective concept. Industry best practices suggest that classification should consider the confidence in the geological continuity of the mineralized structures, the quality and quantity of exploration data supporting the estimates, and the geostatistical confidence in the tonnage and grade estimates. Appropriate classification criteria should aim to integrate both concepts to delineate regular areas at similar resource classification.
Data quality, drillhole spacing and the interpreted continuity of grades controlled by the veins and high grade shoots allowed SRK to classify portions of the veins in the Measured, Indicated and Inferred Mineral Resources categories.
SRK’s classification system remains similar to that used in the December 31, 2019 Mineral Resource model with some adjustments based on increased knowledge of the deposit from on-going mine planning support.
Measured: Measured Resources are limited to the Providencia and limited areas of Sandra K veins on the basis of insufficient confidence in the geological and grade continuity and 3D geometry of the mineralized structures
|
BP/KD |
April 2022 |
| SRK Consulting (U.S.), Inc. NI 43-101 Technical Report – Segovia 2021 PFS Update |
Page 217 |
at the other deposits. The Measured Mineral Resources have only been defined within areas of dense sampling, within a 15 to 30 m halo (related to the second variogram structure) of close spaced underground channel sampling. At Sandra K the measured exists in areas where GCM has undertaken mining and completed sufficient drilling ahead of mining to confirm the structure of Veta Techo.
In the 2013 Mineral Resource Statement, the halo was continued around all of the channel sampling, but given potential for differences within the depletion, SRK downgraded the Mineral Resources in the upper portions of the mine on the eastern edges back to Indicated. There, SRK only applied Measured within the areas of mining developed by the GCM, or the last level of mining in the west, where confidence in the accuracy of the depletion remains high.
Indicated: SRK delineated Indicated Mineral Resources at Providencia, Sandra K and Carla using the same process as the previous Mineral Resource estimate. Indicated Mineral Resources were reported at the following approximate data spacing, as function of the confidence in the grade estimates and modeled variogram ranges:
| • | At Providencia, range from 25 to 55 m (XY) from the nearest drillhole |
| • | At El Silencio, range from 25 to 55 m (XY) from the nearest drillhole |
| • | At Sandra K, 25 x 25 m (XY) from the nearest drillhole |
| • | At Carla, within a 25 to 50 m (XY) halo from the nearest drillhole, dependent on assumed grade continuity |
The main change in the classification occurs at El Silencio; where previously all material was classified as Inferred due to a lack of verification sampling or confidence in the depletion/pillar outlines. SRK limited the Indicated Mineral Resources to the lower portion of the mine (previously flooded), where the depletion limits are considered more accurate due to a lack of mining activity over prolonged periods of time by Contractor mining.
Inferred: In general, Inferred Mineral Resources were limited to within areas of reasonable grade estimate quality and sufficient geological confidence, and are extended no further than 100 m from peripheral drilling on the basis of modeled variogram ranges.
The areas of historical channel sampling in Vera have been classified as inferred due to the lack of verification sampling and confidence in the mined areas definition (Figure 14-32 through Figure 14-36).
|
BP/KD |
April 2022 |
| SRK Consulting (U.S.), Inc. NI 43-101 Technical Report – Segovia 2021 PFS Update |
Page 218 |
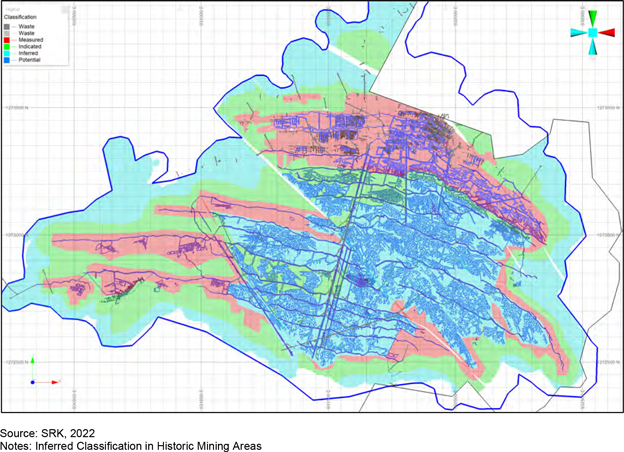
Figure 14-32: Plan View Showing Classification at Providencia Example
|
BP/KD |
April 2022 |
| SRK Consulting (U.S.), Inc. NI 43-101 Technical Report – Segovia 2021 PFS Update |
Page 219 |
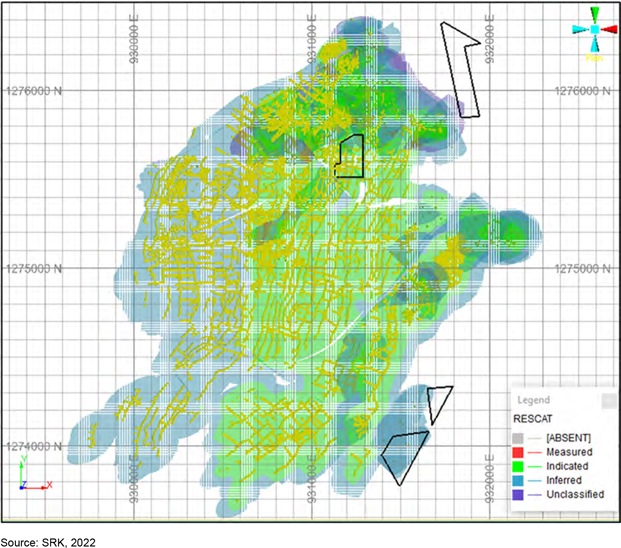
Figure 14-33: Plan View Showing Classification at El Silencio Showing Main Veins
|
BP/KD |
April 2022 |
| SRK Consulting (U.S.), Inc. NI 43-101 Technical Report – Segovia 2021 PFS Update |
Page 220 |
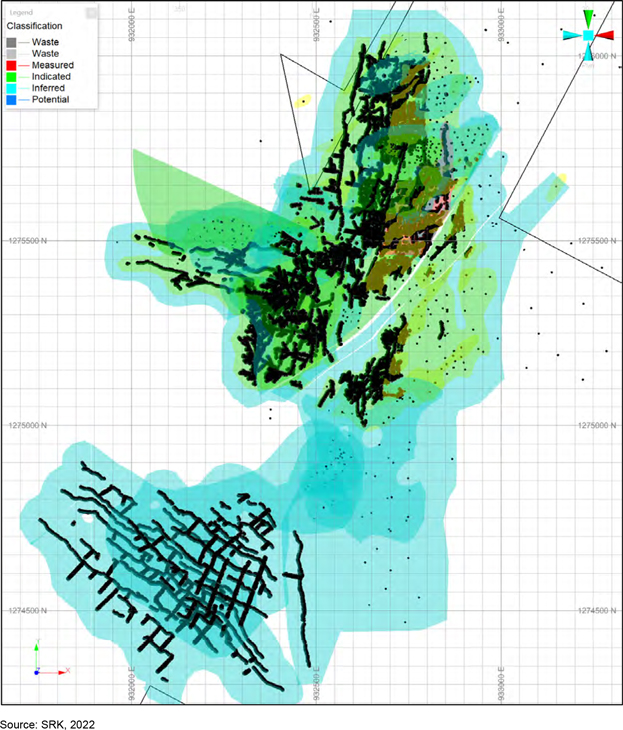
Figure 14-34: Plan View Showing Classification at Sandra K Showing Veta Techo and Chumeca
|
BP/KD |
April 2022 |
| SRK Consulting (U.S.), Inc. NI 43-101 Technical Report – Segovia 2021 PFS Update |
Page 221 |
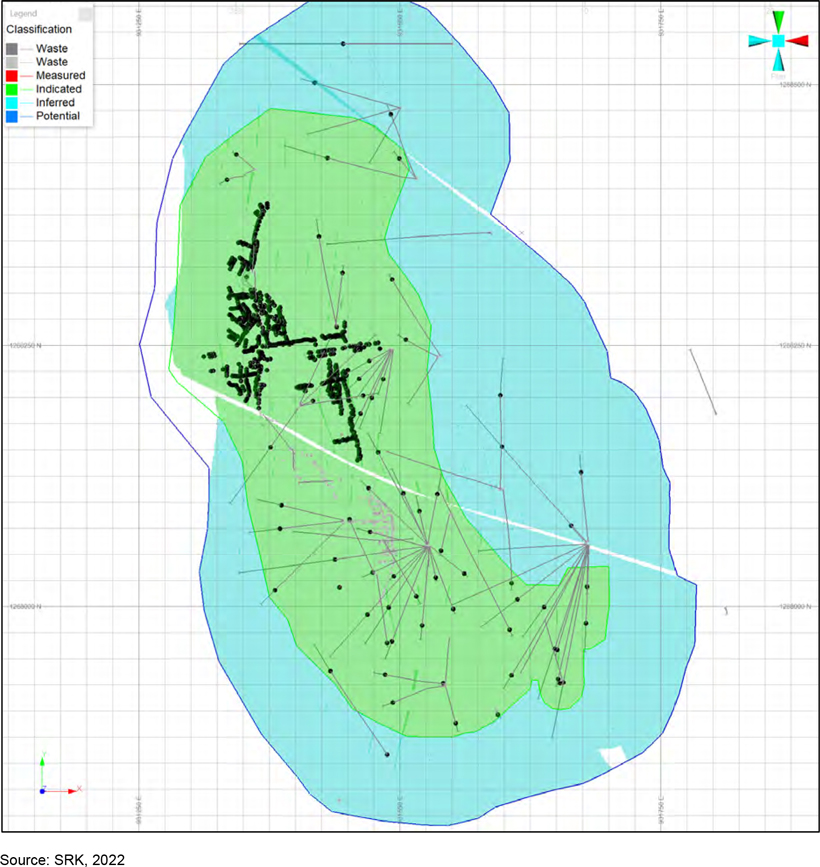
Figure 14-35: Plan View Showing Classification at Carla
|
BP/KD |
April 2022 |
| SRK Consulting (U.S.), Inc. NI 43-101 Technical Report – Segovia 2021 PFS Update |
Page 222 |
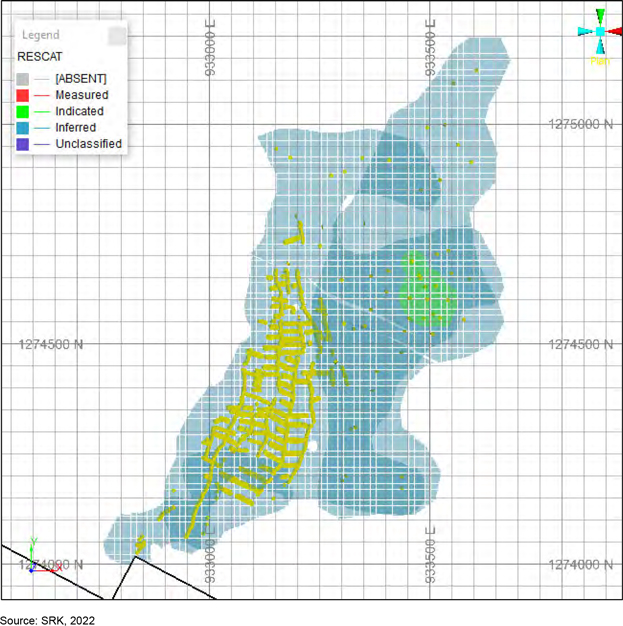
Figure 14-36: Plan View Showing Classification at Vera
| 14.10 | Mining Depletion |
To define the Mineral Resource, SRK has created a series of 3D wireframes to represent the depletion for all four mines. In order to complete this task, SRK has used a combination of AutoCAD™ polylines (.dwg, .dxf format) and Vulcan™ (.00t) files supplied by the Company to generate polylines of the outlines of the known mining. The current status for the quality of the underground depletion surveys is variable across the different mines, with Providencia providing a relatively complete 3D volume of the depletion, compared to El Silencio which is a combination of 3D volumes and 2D polyline. The current SRK process to define the final depletion is
|
BP/KD |
April 2022 |
| SRK Consulting (U.S.), Inc. NI 43-101 Technical Report – Segovia 2021 PFS Update |
Page 223 |
manual and labor intensive and requires to initially generate an outline of the end of stoping and development by creating a trace around the edge of the current mining in two-dimension (2D). To support the existing depletions (active mining areas) at El Silencio, SRK has imported the outlines into Leapfrog® and created a buffer around the known depletion to generate a 2D limit (5 m was selected), which was then converted to a single polyline for the outer edge of the shape to form the barrier.
Once the outline has been established the next phase of the process was to generate a separate set of polylines to represent the pillars at each of the mines. The AutoCAD™ file formed the basis for this process but required SRK to convert all the polylines into valid closed polygons and therefore manual digitization was required to trace the remaining pillars in places (namely the lower levels of the mine).
Additional to this process, SRK notes that at El Silencio the geological model has advanced during 2021 to account for splays and localized parallel structures, but limitations exist for depletion as in some areas the only information present exists in a mixture of 2D and 3D polylines. Therefore, SRK has interpretated which veins have been mined in many cases. This process may result in over depletion at the edges which have later been reviewed once compared to the initial mine plans provided by GCM. SRK considers this process to be sub - optimal and does not all for the highest levels of confidence to be assigned due to depletion uncertainty.
SRK recommends GCM places a high-priority in generating a complete 3D volume of the depletions for the complete El Silencio mine during 2022. The depletion model (which should be based of underground survey points), will further aid the geological modelling, and provide alternative methods (more accurate) for depletion than used within the current model. An example of the resultant wireframes used is shown in Figure 14-37. An example of the resultant wireframes used is shown in Figure 14-38.
|
BP/KD |
April 2022 |
| SRK Consulting (U.S.), Inc. NI 43-101 Technical Report – Segovia 2021 PFS Update |
Page 224 |
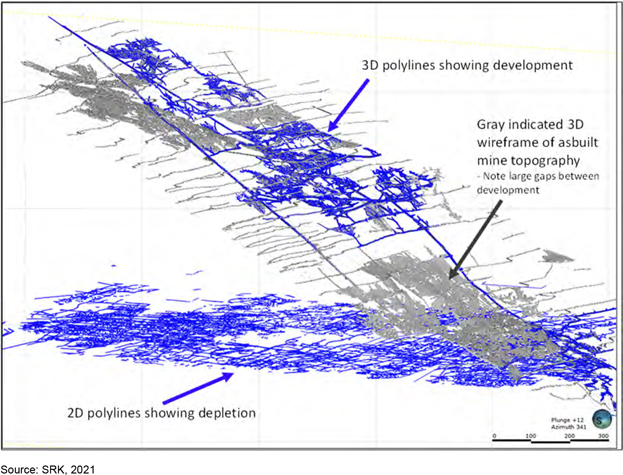
Figure 14-37: 3D Schematic View Showing 2D Polylines and 3D Wireframes of Mine Depletions at El Silencio
|
BP/KD |
April 2022 |
| SRK Consulting (U.S.), Inc. NI 43-101 Technical Report – Segovia 2021 PFS Update |
Page 225 |
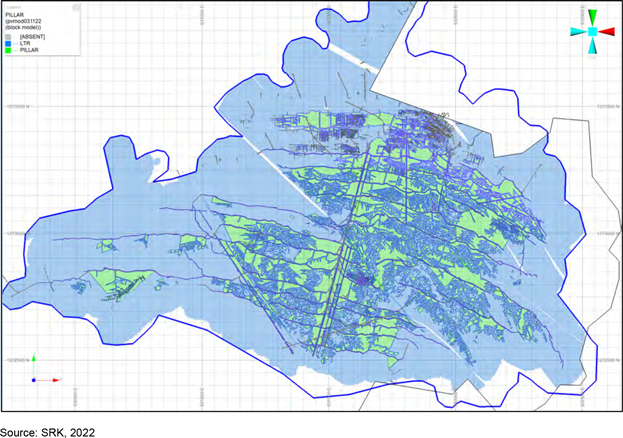
Figure 14-38: Example of Depletion Limits (Providencia), with Depletion Shown in Purple and Remaining Pillars in Green
Once SRK completed the two sets of polylines for each vein, the depletion was assigned via projecting the polylines through the block models and coding blocks directly as follows:
DEPL: Blocks lying with the edge of development wireframe limits
PILLAR: Blocks lying within the defined pillars
The final depletion code was therefore assigned by a logical expression for blocks where DEPL=1 and PILLAR=0. Each model was then visually validated to ensure accuracy of the assignment of codes. SRK cautions that in areas of the historical mines the accuracy of the Pillars survey in the AutoCAD™ files may be questioned due to on-going mining by the various contractors, and therefore SRK has assigned the classification accordingly.
14.11 Mineral Resource Statement
CIM defines a Mineral Resource as:
“(A) concentration or occurrence of diamonds, natural solid inorganic material, or natural solid fossilized organic material including base and precious metals, coal, and industrial minerals in or on the Earth’s crust in such form and quantity and of such a grade or quality that it has reasonable prospects for economic extraction. The location,
|
BP/KD |
April 2022 |
| SRK Consulting (U.S.), Inc. NI 43-101 Technical Report – Segovia 2021 PFS Update |
Page 226 |
quantity, grade, geological characteristics and continuity of a Mineral Resource are known, estimated or interpreted from specific geological evidence and knowledge”.
The “reasonable prospects for eventual economic extraction” requirement generally imply that the quantity and grade estimates meet certain economic thresholds and that the Mineral Resources are reported at an appropriate cut-off grade taking into account extraction scenarios and processing recoveries. In order to meet this requirement, SRK considers that portions of the Providencia, Sandra K, El Silencio and Carla veins to be amenable for underground mining.
To determine the potential for economic extraction SRK has used the following key assumptions for the costing, and a metallurgical recovery of 90.5% Au, has been assumed based on the current performance of the operating plant.
SRK has defined the proportions of Mineral Resource to have potential for economic extraction for the Mineral Resource based on a single cut-off grade for all four mines.
SRK has defined the proportions of Mineral Resource to have potential for economic extraction for the Mineral Resource based on a single cut-off grade. To determine the potential for economic extraction SRK has used the following key assumptions for the costing, and a metallurgical recovery of 90.5% Au, has been assumed based on the current performance of the operating plant, and using a US$1,800/oz gold price and an average mining cost. There has been an increase in the gold price from US$1,700/oz to US$1,800/oz which represents an increase of approximately 5.8%, however SRK highlights that this has been offset to some extent by the assumptions used in the costs between 2019 and 2020 which had an increase of 6.2% (Table 14-13). SRK has taken the decision to use 2.9 g/t for the 2022 estimate to remain consistent with previous estimates.
Table 14-13: Comparison of the Mineral Resource Cut-Off Grade Assumptions 2020 Versus 2021
|
|
Cost |
2020 Cost | 2021 Cost | Unit | Variance | |||||||||||||
|
Mine |
85 | 99.0 | US$/ton | 16.47% | ||||||||||||||
|
Plant |
24 | 26.0 | US$/ton | 8.33% | ||||||||||||||
|
G&A |
24 | 22.0 | US$/ton | -8.33% | ||||||||||||||
|
Royalties |
11.1 | 6.1 | US$/ton | -45.13% | ||||||||||||||
|
Total Cost |
144.1 | 153.1 | US$/ton | 6.24% | ||||||||||||||
| Au Price |
1,700.00 | 1,800.00 | US$/oz | 5.88% | ||||||||||||||
| 54.7 | 57.9 | US$/g | ||||||||||||||||
|
Au recovery |
90.5 | 90.5 | % | |||||||||||||||
|
COG |
2.9 | 2.9 | * | gpt | 1.18% |
Source: SRK, 2021
Notes: *SRK rounded 2.9 g/t for December 2022 Mineral Resource Reporting
SRK has limited the Resource based on a cut-off grade of 2.9 g/t Au over a (minimum mining) width of 1.0 m. Based on on-going assistance with mine planning SRK considers this cut-off to remain appropriate.
The classified Mineral Resource is sub-divided into material within the remaining pillars (pillars), and the long-term resource material (LTR) outside of the previously mined areas, with the classification for the pillars considered separately given the uncertainty of the extent of remnant pillar mining currently being undertaken by Company-organized co-operative miners.
|
BP/KD |
April 2022 |
| SRK Consulting (U.S.), Inc. NI 43-101 Technical Report – Segovia 2021 PFS Update |
Page 227 |
Table 14-14: SRK Mineral Resource Statement for the Segovia and Carla Projects, Dated December 31, 2021
|
Project |
Deposit | Type | Measured | Indicated | Measured and Indicated | Inferred | ||||||||||||||||||||||||||||||||||||||||||||||||
| Tonnes | Grade | Au Metal | Tonnes | Grade | Au Metal | Tonnes | Grade | Au Metal | Tonnes | Grade | Au Metal | |||||||||||||||||||||||||||||||||||||||||||
| (kt) | (g/t) | (koz) | (kt) | (g/t) | (koz) | (kt) | (g/t) | (koz) | (kt) | (g/t) | (koz) | |||||||||||||||||||||||||||||||||||||||||||
|
Segovia |
Providencia | LTR | 263 | 12.0 | 101 | 385 | 8.8 | 109 | 648 | 10.1 | 210 | 367 | 7.0 | 83 | ||||||||||||||||||||||||||||||||||||||||
| Pillars | 156 | 17.5 | 88 | 88 | 9.3 | 26 | 232 | 14.6 | 114 | 458 | 17.6 | 259 | ||||||||||||||||||||||||||||||||||||||||||
| Sandra K | LTR | 17 | 12.2 | 7 | 498 | 9.5 | 153 | 515 | 9.6 | 159 | 704 | 12.3 | 279 | |||||||||||||||||||||||||||||||||||||||||
| Pillars | 27 | 14.7 | 13 | 188 | 10.4 | 63 | 214 | 10.9 | 75 | 67 | 26.8 | 58 | ||||||||||||||||||||||||||||||||||||||||||
| El Silencio | LTR | 1,601 | 11.2 | 577 | 1,601 | 11.2 | 577 | 2,159 | 8.8 | 609 | ||||||||||||||||||||||||||||||||||||||||||||
| Pillars | 1,228 | 11.4 | 449 | 1,228 | 11.4 | 449 | 341 | 12.1 | 133 | |||||||||||||||||||||||||||||||||||||||||||||
| Verticales | LTR | 771 | 7.1 | 176 | ||||||||||||||||||||||||||||||||||||||||||||||||||
| Subtotal Segovia Project |
LTR | 280 | 12.0 | 108 | 2,484 | 10.5 | 839 | 2,764 | 107 | 947 | 4,001 | 8.9 | 1,146 | |||||||||||||||||||||||||||||||||||||||||
| Pillars | 182 | 17.1 | 100 | 1,504 | 11.1 | 538 | 1,686 | 11.8 | 638 | 867 | 16.2 | 450 | ||||||||||||||||||||||||||||||||||||||||||
|
Carla |
Subtotal Carla Project | LTR | 129 | 7.9 | 33 | 129 | 7.9 | 33 | 224 | 9.6 | 69 | |||||||||||||||||||||||||||||||||||||||||||
|
Vera |
Subtotal Vera Project | LTR | 6 | 10.9 | 2 | 6 | 10.9 | 2 | 257 | 4.6 | 38 | |||||||||||||||||||||||||||||||||||||||||||
Source: SRK, 2022
Notes: The Mineral Resources are reported at an in-situ cut-off grade of 2.9 g/t Au over a 1.0 m mining width, which has been derived using a gold price of US$1,800/oz, and suitable benchmarked technical and economic parameters for underground mining (mining = US$99.0, processing = US$26.0, G&A = US$22.0, Royalties = US$6.1), and conventional gold mineralized material processing (90.5%). Each of the mining areas have been sub-divided into Pillar areas (“Pillars”), which represent the areas within the current mining development, and LTR, which lies along strike or down dip of the current mining development. Mineral Resources are not Mineral Reserves and do not have demonstrated economic viability. All figures are rounded to reflect the relative accuracy of the estimate. All composites have been capped where appropriate.
|
BP/KD |
May 2022 |
| SRK Consulting (U.S.), Inc. NI 43-101 Technical Report – Segovia 2021 PFS Update |
Page 228 |
14.12 Mineral Resource Sensitivity
| 14.12.1 | Grade Tonnage Sensitivity |
The results of grade sensitivity analysis completed per vein are tabulated in Table 14-15 through Table 14-18.
This is to show the continuity of the grade estimates at various cut-off increments in each of the vein sub areas and the sensitivity of the Mineral Resource to changes in CoG. Note SRK has highlighted in yellow the defined Mineral Resources and all other tonnages and grades stated in these figures and tables should not however be interpreted as Mineral Resources.
The reader is cautioned that the figures in Table 14-15 to Figure 14-20 should not be misconstrued with the Mineral Resource Statement. The figures are only presented to show the sensitivity of the block model estimates to the selection of CoG. All figures are rounded to reflect the relative accuracy of the estimates. Mineral Resources that are not Mineral Reserves do not have demonstrated economic viability. The sensitivity study is preliminary in nature in that it includes Inferred Mineral Resources that are considered too speculative geologically to have the economic considerations applied to them that would enable them to be categorized as Mineral Reserves, and there is no certainty that the Mineral Reserves from the Inferred will be realized, and therefore SRK has tabulated the numbers separately.
|
BP/KD |
May 2022 |
| SRK Consulting (U.S.), Inc. NI 43-101 Technical Report – Segovia 2021 PFS Update |
Page 229 |
Table 14-15: Block Model Quantities and Grade Estimates, Providencia Deposit at Various Cut-off Grades
|
Grade - Tonnage Table, Providencia LTR |
|
Grade - Tonnage Table, Providencia Pillar | ||||||||||||||||||||||||||||||||||||||||||||||
| Cut-off Grade |
Measured and Indicated | Inferred | Measured and Indicated | Inferred | ||||||||||||||||||||||||||||||||||||||||||||
| Quantity | Gold | Quantity | Gold | Quantity | Gold | Quantity | Gold | |||||||||||||||||||||||||||||||||||||||||
|
Au (g/t) |
|
Tonnes (kt) |
|
|
Au (g/t) |
|
|
Metal (koz) |
|
|
Tonnes (kt) |
|
|
Au (g/t) |
|
|
Metal (koz) |
|
|
Tonnes (kt) |
|
|
Au (g/t) |
|
|
Metal (koz) |
|
|
Tonnes (kt) |
|
|
Au (g/t) |
|
|
Metal (koz) |
| ||||||||||||
| 1.00 |
1,137 | 6.6 | 241 | 687 | 4.6 | 101 | 397 | 9.7 | 123 | 630 | 13.3 | 269 | ||||||||||||||||||||||||||||||||||||
| 2.00 |
869 | 8.1 | 228 | 482 | 5.9 | 92 | 311 | 11.9 | 119 | 527 | 15.6 | 265 | ||||||||||||||||||||||||||||||||||||
| 2.50 |
737 | 9.2 | 218 | 419 | 6.5 | 87 | 271 | 13.4 | 117 | 487 | 16.7 | 262 | ||||||||||||||||||||||||||||||||||||
|
2.90 |
648 | 10.1 | 210 | 367 | 7.0 | 83 | 243 | 14.6 | 114 | 458 | 17.6 | 259 | ||||||||||||||||||||||||||||||||||||
| 3.00 |
626 | 10.3 | 208 | 357 | 7.1 | 82 | 236 | 14.9 | 113 | 451 | 17.8 | 259 | ||||||||||||||||||||||||||||||||||||
| 3.50 |
507 | 12.0 | 196 | 310 | 7.7 | 77 | 209 | 16.4 | 111 | 415 | 19.1 | 255 | ||||||||||||||||||||||||||||||||||||
| 4.00 |
429 | 13.5 | 187 | 281 | 8.1 | 73 | 186 | 18.1 | 108 | 381 | 20.5 | 251 | ||||||||||||||||||||||||||||||||||||
| 4.50 |
363 | 15.2 | 178 | 249 | 8.6 | 69 | 169 | 19.4 | 106 | 350 | 21.9 | 246 | ||||||||||||||||||||||||||||||||||||
| 5.00 |
319 | 16.7 | 171 | 206 | 9.4 | 62 | 155 | 20.7 | 103 | 324 | 23.3 | 243 | ||||||||||||||||||||||||||||||||||||
| 5.50 |
281 | 18.2 | 165 | 187 | 9.9 | 59 | 144 | 21.9 | 102 | 303 | 24.5 | 239 | ||||||||||||||||||||||||||||||||||||
| 6.00 |
244 | 20.1 | 158 | 143 | 11.1 | 51 | 134 | 23.2 | 100 | 284 | 25.8 | 235 | ||||||||||||||||||||||||||||||||||||
| 7.00 |
201 | 23.0 | 149 | 68 | 16.4 | 36 | 118 | 25.4 | 96 | 248 | 28.5 | 228 | ||||||||||||||||||||||||||||||||||||
| 8.00 |
167 | 26.2 | 141 | 52 | 19.1 | 32 | 104 | 27.8 | 93 | 223 | 31.0 | 222 | ||||||||||||||||||||||||||||||||||||
| 9.00 |
141 | 29.5 | 133 | 45 | 20.8 | 30 | 93 | 30.0 | 90 | 202 | 33.3 | 216 | ||||||||||||||||||||||||||||||||||||
| 10.00 |
119 | 33.1 | 127 | 40 | 22.1 | 29 | 86 | 31.7 | 88 | 184 | 35.6 | 211 | ||||||||||||||||||||||||||||||||||||
Source: SRK, 2022
Note: Yellow highlights current Mineral Resource cut-off grade
|
BP/KD |
May 2022 |
| SRK Consulting (U.S.), Inc. NI 43-101 Technical Report – Segovia 2021 PFS Update |
Page 230 |
Table 14-16: Block Model Quantities and Grade Estimates, El Silencio Deposit at Various Cut-off Grades
| Grade - Tonnage Table, El Silencio LTR | Grade - Tonnage Table, El Silencio Pillar | |||||||||||||||||||||||||||||||||||||||||||||||
| Cut- off |
Measured and Indicated | Inferred | Measured and Indicated | Inferred | ||||||||||||||||||||||||||||||||||||||||||||
| Quantity | Gold | Quantity | Gold | Quantity | Gold | Quantity | Gold | |||||||||||||||||||||||||||||||||||||||||
| Au (g/t) |
Tonnes (kt) |
Au (g/t) |
Metal (koz) |
Tonnes (kt) |
Au (g/t) |
Metal (koz) |
Tonnes (kt) |
Au (g/t) |
Metal (koz) |
Tonnes (kt) |
Au (g/t) |
Metal (koz) |
||||||||||||||||||||||||||||||||||||
| 1.0 |
2,143 | 8.9 | 611 | 2,918 | 7.0 | 661 | 1,535 | 9.6 | 472 | 406 | 10.6 | 138 | ||||||||||||||||||||||||||||||||||||
| 2.0 |
1,845 | 10.0 | 596 | 2,677 | 7.5 | 649 | 1,460 | 10.0 | 467 | 400 | 10.7 | 138 | ||||||||||||||||||||||||||||||||||||
| 2.5 |
1,686 | 10.8 | 585 | 2,366 | 8.2 | 627 | 1,348 | 10.6 | 459 | 369 | 11.4 | 136 | ||||||||||||||||||||||||||||||||||||
|
2.9 |
1,601 | 11.2 | 577 | 2,159 | 8.8 | 609 | 1,228 | 11.4 | 449 | 341 | 12.1 | 133 | ||||||||||||||||||||||||||||||||||||
| 3.0 |
1,580 | 11.3 | 575 | 2,102 | 8.9 | 603 | 1,199 | 11.6 | 446 | 334 | 12.3 | 132 | ||||||||||||||||||||||||||||||||||||
| 3.5 |
1,460 | 12.0 | 563 | 1,714 | 10.2 | 563 | 1,050 | 12.7 | 430 | 297 | 13.5 | 129 | ||||||||||||||||||||||||||||||||||||
| 4.0 |
1,340 | 12.7 | 548 | 1,531 | 11.0 | 541 | 912 | 14.1 | 414 | 262 | 14.8 | 124 | ||||||||||||||||||||||||||||||||||||
| 4.5 |
1,236 | 13.4 | 534 | 1,380 | 11.7 | 520 | 807 | 15.4 | 400 | 235 | 16.0 | 121 | ||||||||||||||||||||||||||||||||||||
| 5.0 |
1,132 | 14.2 | 518 | 1,269 | 12.3 | 503 | 732 | 16.5 | 388 | 214 | 17.1 | 117 | ||||||||||||||||||||||||||||||||||||
| 5.5 |
1,022 | 15.2 | 500 | 1,120 | 13.3 | 478 | 677 | 17.4 | 379 | 195 | 18.2 | 114 | ||||||||||||||||||||||||||||||||||||
| 6.0 |
921 | 16.2 | 481 | 976 | 14.4 | 452 | 631 | 18.3 | 370 | 178 | 19.4 | 111 | ||||||||||||||||||||||||||||||||||||
| 7.0 |
734 | 18.7 | 442 | 799 | 16.2 | 415 | 571 | 19.5 | 358 | 163 | 20.6 | 108 | ||||||||||||||||||||||||||||||||||||
| 8.0 |
618 | 20.9 | 414 | 684 | 17.6 | 388 | 521 | 20.6 | 346 | 151 | 21.7 | 105 | ||||||||||||||||||||||||||||||||||||
| 9.0 |
534 | 22.8 | 391 | 560 | 19.7 | 354 | 479 | 21.7 | 334 | 140 | 22.7 | 102 | ||||||||||||||||||||||||||||||||||||
| 10.0 |
476 | 24.4 | 374 | 506 | 20.8 | 338 | 441 | 22.8 | 323 | 131 | 23.6 | 99 | ||||||||||||||||||||||||||||||||||||
Source: SRK, 2022
Note: Yellow highlights current Mineral Resource cut-off grade
|
BP/KD |
May 2022 |
| SRK Consulting (U.S.), Inc. NI 43-101 Technical Report – Segovia 2021 PFS Update |
Page 231 |
Table 14-17: Block Model Quantities and Grade Estimates, Sandra K Deposit at Various Cut-off Grades
| Grade - Tonnage Table, Sandra K LTR | Grade - Tonnage Table, Sandra K Pillar | |||||||||||||||||||||||||||||||||||||||||||||||
|
Cut- off Grade |
Measured and Indicated | Inferred |
Measured and Indicated | Inferred | ||||||||||||||||||||||||||||||||||||||||||||
| Quantity | Gold | Quantity | Gold | Quantity | Gold | Quantity | Gold | |||||||||||||||||||||||||||||||||||||||||
| Au (g/t) | Tonnes (kt) |
Au (g/t) |
Metal (koz) |
Tonnes (kt) |
Au (g/t) |
Metal (koz) |
Tonnes (kt) |
Au (g/t) |
Metal (koz) |
Tonnes (kt) |
Au (g/t) |
Metal (koz) |
||||||||||||||||||||||||||||||||||||
| 1.0 |
595 | 8.6 | 165 | 1,045 | 9.0 | 301 | 255 | 9.5 | 78 | 67 | 26.8 | 58 | ||||||||||||||||||||||||||||||||||||
| 2.0 |
577 | 8.9 | 164 | 894 | 10.2 | 294 | 243 | 9.9 | 78 | 67 | 26.8 | 58 | ||||||||||||||||||||||||||||||||||||
| 2.5 |
545 | 9.2 | 162 | 772 | 11.5 | 285 | 228 | 10.4 | 76 | 67 | 26.8 | 58 | ||||||||||||||||||||||||||||||||||||
| 2.9 |
515 | 9.6 | 159 | 704 | 12.3 | 279 | 214 | 10.9 | 75 | 67 | 26.8 | 58 | ||||||||||||||||||||||||||||||||||||
| 3.0 |
504 | 9.8 | 158 | 683 | 12.6 | 277 | 210 | 11.1 | 75 | 67 | 26.8 | 58 | ||||||||||||||||||||||||||||||||||||
| 3.5 |
464 | 10.3 | 154 | 613 | 13.7 | 270 | 194 | 11.7 | 73 | 67 | 26.8 | 58 | ||||||||||||||||||||||||||||||||||||
| 4.0 |
422 | 11.0 | 149 | 580 | 14.2 | 266 | 181 | 12.3 | 72 | 67 | 26.8 | 58 | ||||||||||||||||||||||||||||||||||||
| 4.5 |
422 | 11.0 | 149 | 580 | 14.2 | 266 | 181 | 12.3 | 72 | 67 | 26.8 | 58 | ||||||||||||||||||||||||||||||||||||
| 5.0 |
358 | 12.2 | 140 | 494 | 15.9 | 253 | 155 | 13.7 | 68 | 67 | 27.0 | 58 | ||||||||||||||||||||||||||||||||||||
| 5.5 |
300 | 13.5 | 130 | 468 | 16.5 | 249 | 144 | 14.3 | 66 | 67 | 27.0 | 58 | ||||||||||||||||||||||||||||||||||||
| 6.0 |
284 | 14.0 | 127 | 447 | 17.0 | 245 | 134 | 14.9 | 64 | 66 | 27.1 | 58 | ||||||||||||||||||||||||||||||||||||
| 7.0 |
243 | 15.2 | 119 | 415 | 17.9 | 238 | 118 | 16.1 | 61 | 66 | 27.2 | 58 | ||||||||||||||||||||||||||||||||||||
| 8.0 |
220 | 16.0 | 113 | 377 | 18.9 | 229 | 104 | 17.2 | 58 | 65 | 27.4 | 58 | ||||||||||||||||||||||||||||||||||||
| 9.0 |
199 | 16.8 | 108 | 336 | 20.2 | 218 | 92 | 18.3 | 54 | 64 | 27.8 | 57 | ||||||||||||||||||||||||||||||||||||
| 10.0 |
180 | 17.6 | 102 | 305 | 21.2 | 209 | 83 | 19.4 | 51 | 63 | 28.1 | 57 | ||||||||||||||||||||||||||||||||||||
Source: SRK, 2022
Note: Yellow highlights current Mineral Resource cut-off grade
|
BP/KD |
May 2022 |
| SRK Consulting (U.S.), Inc. NI 43-101 Technical Report – Segovia 2021 PFS Update |
Page 232 |
Table 14-18: Block Model Quantities and Grade Estimates, Las Verticales Deposit at Various Cut-off Grades
| Grade - Tonnage Table, Las Verticales 31 July 2013 |
| |||||||||||||||||||||||
| Measured and Indicated | Inferred | |||||||||||||||||||||||
| Cut-off Grade | Quantity | Gold | Quantity | Gold | ||||||||||||||||||||
| AUM1 (g/t Au over 1 m) | (kt) | Grade (g/t) | Metal (koz) | (kt) | Grade (g/t) | Metal (koz) | ||||||||||||||||||
| 1.0 | - | - | - | 1,700 | 5 | 275 | ||||||||||||||||||
| 1.5 | - | - | - | 1,344 | 5.7 | 248 | ||||||||||||||||||
| 2.0 | - | - | - | 1,137 | 6.2 | 226 | ||||||||||||||||||
| 2.5 | - | - | - | 962 | 6.6 | 203 | ||||||||||||||||||
| 3.0 | - | - | - | 771 | 7.1 | 176 | ||||||||||||||||||
| 3.5 | - | - | - | 656 | 7.4 | 156 | ||||||||||||||||||
| 4.0 | - | - | - | 554 | 7.6 | 135 | ||||||||||||||||||
| 4.5 | - | - | - | 473 | 7.8 | 119 | ||||||||||||||||||
| 5.0 | - | - | - | 406 | 8 | 105 | ||||||||||||||||||
Source: SRK, 2022
Table 14-19: Block Model Quantities and Grade Estimates, Carla Deposit at Various Cut-off Grades
| Grade - Tonnage Table, Carla 31 December 2021 |
| |||||||||||||||||||||||
| Cut-off Grade | Measured and Indicated | Inferred | ||||||||||||||||||||||
| Quantity | Gold | Quantity | Gold | |||||||||||||||||||||
| AUM1 (g/t Au over 1 m) | (kt) | Grade (g/t) | Metal (koz) | (kt) | Grade (g/t) | Metal (koz) | ||||||||||||||||||
| 1.00 | 344 | 4.1 | 46 | 344 | 4.1 | 46 | ||||||||||||||||||
| 1.50 | 276 | 4.8 | 43 | 328 | 7.2 | 76 | ||||||||||||||||||
| 2.00 | 206 | 5.9 | 39 | 292 | 7.9 | 74 | ||||||||||||||||||
| 2.50 | 161 | 6.9 | 36 | 244 | 9.0 | 71 | ||||||||||||||||||
| 2.90 | 129 | 7.9 | 33 | 224 | 9.6 | 69 | ||||||||||||||||||
| 3.00 | 123 | 8.2 | 32 | 221 | 9.6 | 69 | ||||||||||||||||||
| 3.50 | 95 | 9.6 | 29 | 198 | 10.4 | 66 | ||||||||||||||||||
| 4.00 | 81 | 10.7 | 28 | 178 | 11.2 | 64 | ||||||||||||||||||
| 4.50 | 70 | 11.7 | 26 | 160 | 11.9 | 61 | ||||||||||||||||||
| 5.00 | 61 | 12.7 | 25 | 149 | 12.5 | 60 | ||||||||||||||||||
Source: SRK, 2022
Note: Yellow highlights current Mineral Resource cut-off grade
Table 14-20: Block Model Quantities and Grade Estimates, Vera Deposit at Various Cut-off Grades
| Grade - Tonnage Table, Vera 31 December 2021 |
| |||||||||||||||||||||||
| Cut-off Grade | Measured and Indicated | Inferred | ||||||||||||||||||||||
| Quantity | Gold | Quantity | Gold | |||||||||||||||||||||
| AUM1 (g/t Au over 1 m) |
(kt) | Grade (g/t) |
Metal (koz) |
(kt) | Grade (g/t) | Metal (koz) | ||||||||||||||||||
| 1.0 | 6 | 10.9 | 2.1 | 360 | 4.0 | 46 | ||||||||||||||||||
| 1.5 | 6 | 10.9 | 2.1 | 351 | 4.0 | 45 | ||||||||||||||||||
| 2.0 | 6 | 10.9 | 2.1 | 332 | 4.2 | 44 | ||||||||||||||||||
| 2.5 | 6 | 10.9 | 2.1 | 301 | 4.3 | 42 | ||||||||||||||||||
| 2.9 | 6 | 10.9 | 2.1 | 257 | 4.6 | 38 | ||||||||||||||||||
| 3.0 | 6 | 10.9 | 2.1 | 230 | 4.8 | 36 | ||||||||||||||||||
| 3.5 | 6 | 10.9 | 2.1 | 130 | 6.2 | 26 | ||||||||||||||||||
| 4.0 | 6 | 10.9 | 2.1 | 117 | 6.5 | 24 | ||||||||||||||||||
| 4.5 | 6 | 11.0 | 2.0 | 112 | 6.6 | 24 | ||||||||||||||||||
| 5.0 | 6 | 11.1 | 2.0 | 104 | 6.7 | 22 | ||||||||||||||||||
Source: SRK, 2022
|
BP/KD |
May 2022 |
| SRK Consulting (U.S.), Inc. NI 43-101 Technical Report – Segovia 2021 PFS Update |
Page 233 |
| 14.12.2 | Comparisons to Previous Estimate |
SRK completed a comparison to the previous (December 31, 2020) MRE for the Segovia Project at a cut-off grade of 2.9 g/t Au over a width of 1.0 m, a summary of the key changes is shown in Table 14-21.The most notable changes include:
Measured and Indicated Comparison
| • | Reconciliation shows an increase in M&I at all mines +172 thousand ounces (koz) |
| • | The most significant changes are noted within the El Silencio, Providencia and Sandra K in order of change: |
| ○ | At El Silencio there has been an increase of +173 koz in the LTR Resources, which is primarily due to the exploration drilling and geological work of the mine team improving the confidence in a number of high-grade smaller splays of Veta Manto. |
| ○ | This includes the v1040 which contributes +134 koz, and Veta Nacional which added a further +60 koz as a result of drilling at depth. Other notable increases included gains in v450, v980, v1180, and v80s, which had gains of +19 koz, +14 koz, +12 koz and +11 koz respectively. |
| ○ | At El Silencio two veins have shown a reduction in the Indicated portion of the Mineral Resources, with Veta Principal [VPN], showing a reduction of -43 koz, and v1140 which reduced -18 koz. |
| ○ | The remainder of the veins at El Silencio have all changes in the order of ± 10 koz. |
| • | At Sandra K the total increase in the Measured and Indicated portion of the Mineral Resource is +47 koz, which is split between +27 koz in the LTR, and +19 koz in the Pillars. This is a result of the continual exploration within the mine which has identified new high-grade areas. |
| • | There is a -52 koz reduction in the Measured and Indicated portion of the Providencia vein. A more detailed review of the changes, show the main basis is a reduction in the tonnage and grades within the high-grade domains (HG=20), which can be attributed to a combination of depletion and lower grades in underground exploration. |
| • | At Carla there was a slight increase in the Indicated portion of the Mineral Resources of +8 koz. |
Inferred Comparison
| • | Overall increase in the Inferred Mineral Resources of +494 koz across all mines |
| • | The most significant changes are noted within the El Silencio, Providencia and Sandra K in order of change: |
| ○ | At El Silencio there has been an increase of +157 koz in the LTR, which is primarily attributed to the following domains |
- Veta Manto reported increases of +48 koz (low-grade), and +56 koz (high-grade)
- Veta Nacional reported an increase of +35 koz which is a result of increases around the edge of the vein
- Veta v450 reported an increase of +86 koz
- Other marginal gains were reported at LAN-FW and v80s of +10 koz and +15 koz
- The remainder of the veins at El Silencio have all changes in the order of ± 10 koz.
| ○ | At Sandra K the total increase in the Inferred Mineral Resources is +200 koz, which is a combination of: |
|
BP/KD |
May 2022 |
| SRK Consulting (U.S.), Inc. NI 43-101 Technical Report – Segovia 2021 PFS Update |
Page 234 |
- An increase in the main Veta Techo resources in the order of +41 koz as a result of down-dip exploration, and
- Veta Chumeca increased by +13 koz, as a result of a slight increase in the average grade from 8.0 g/t to 9.0 g/t.
- The biggest changes though are related to the PAT and JUL veins within the Cogote area, which have undergone more detailed validation by GCM, which included converting the historical database to the correct grid system and to metric values (previously short tons, penny weights, and inches). This resulted in an increase of +24 koz with the PAT vein, and +64 koz in the JUL vein. SRK recommends further exploration and review of the geological models within these areas.
| ○ | At Providencia exploration has increased the overall portion of the Inferred Mineral Resources of + 42 koz. This is split into: |
| - | +28 koz within the LTR portion of the deposit, which are mainly within gains of lower-grade material within the main veta Providencia vein at depth (HG=10 domain), with the overall grade dropping from 7.3 g/t to 5.9 g/t, but increasing the tonnage from 121 kt, to 358 kt. |
| - | +14 koz within the pillars portion of the deposit. |
| ○ | SRK has declared the first Mineral Resources for the Vera deposit which reported +38 koz of Inferred and +2 koz of Indicated resources. Drilling has confirmed a new model for the Vera vein which was built based on historical drill hole intercepts, new structural data, chip channel data and fieldwork. This new model incorporates a post-mineralization NW striking dextral oblique-reverse fault that dips to the NE. This was not previously identified by FGM, which interpreted that there were two sub-parallel quartz veins named Vera and Lluvias, the latter in the hanging-wall of the Vera vein. The intersections to date of the current drill program confirm the presence of the interpreted fault and the relative displacement along it and support the model that the Vera and Lluvias veins are the same vein, with the Lluvias vein occurring in the upthrown fault block. |
A summary of the changes is shown in the waterfall charts split by M&I and Inferred (Figure 14-39).
|
BP/KD |
May 2022 |
| SRK Consulting (U.S.), Inc. NI 43-101 Technical Report – Segovia 2021 PFS Update |
Page 235 |
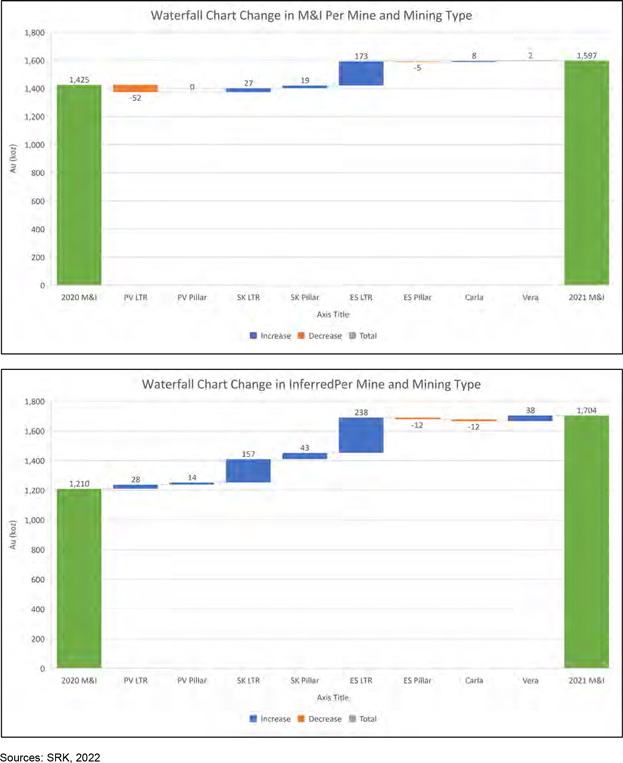
Figure 14-39: Waterfall Charts Detailing the Main Changes per Model by Classification (M&I = Top, and Inferred =
Bottom)
|
BP/KD |
May 2022 |
| SRK Consulting (U.S.), Inc. NI 43-101 Technical Report – Segovia 2021 PFS Update |
Page 236 |
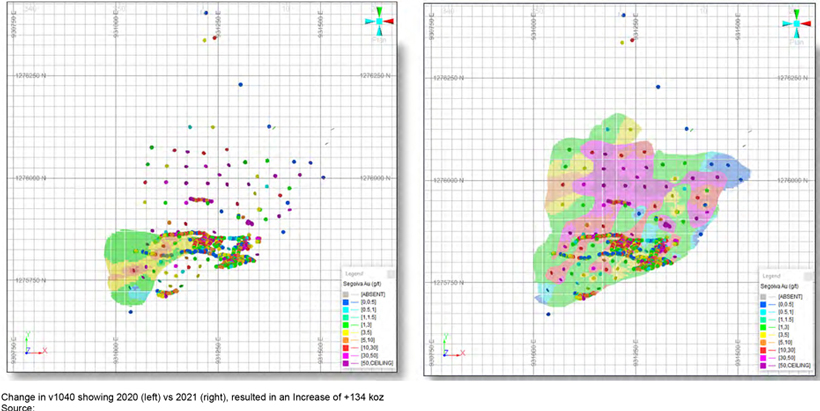
Figure 14-40: Reconciliation of El Silencio Significant Changes
|
BP/KD |
May 2022 |
| SRK Consulting (U.S.), Inc. NI 43-101 Technical Report – Segovia 2021 PFS Update |
Page 237 |
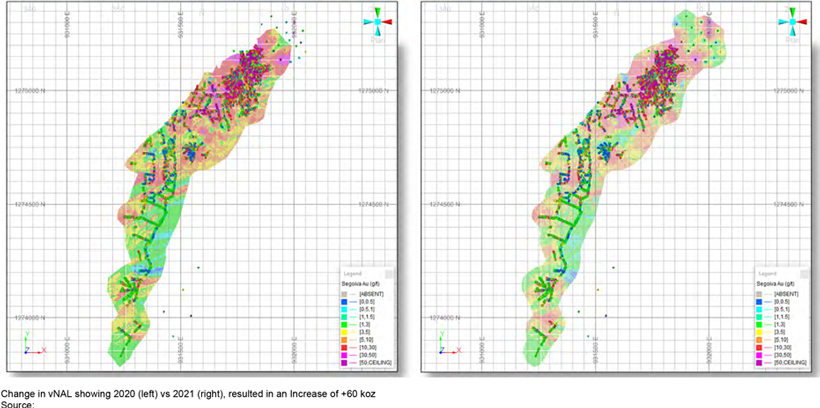
Figure 14-41: Reconciliation of Sandra K Significant Changes
|
BP/KD |
May 2022 |
| SRK Consulting (U.S.), Inc. NI 43-101 Technical Report – Segovia 2021 PFS Update |
Page 238 |
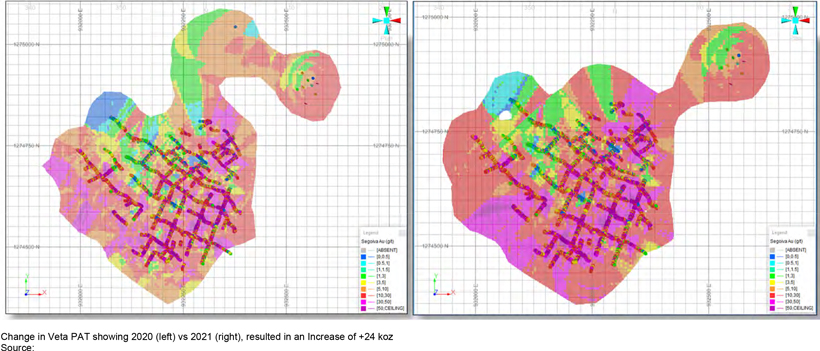
Figure 14-42: Reconciliation of Sandra K Patio Vein Significant Changes
|
BP/KD |
May 2022 |
| SRK Consulting (U.S.), Inc. NI 43-101 Technical Report – Segovia 2021 PFS Update |
Page 239 |
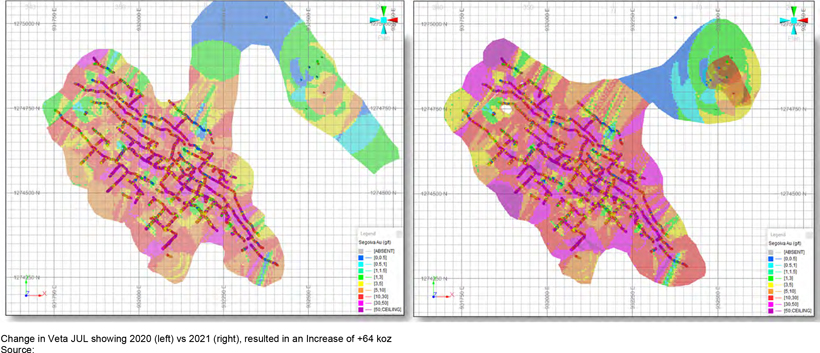
Figure 14-43: Reconciliation of Sandra K Julio Vein Significant Changes
|
BP/KD |
May 2022 |
| SRK Consulting (U.S.), Inc. NI 43-101 Technical Report – Segovia 2021 PFS Update |
Page 240 |
| • | The only increases have occurred at Sandra K, and Carla with increases of +50 koz, and +28 koz, respectively. |
| ○ | At Sandra K, the most significant changes have been the expansion of the JUL and PAT structures which were initially modelled at depth from exploration drilling in 2019. The increase is a result of capture of the historical underground database within the previously operated mines up dip of the 2019 intersections. |
| ○ | The resultant models increased the Inferred Mineral Resources for the two veins by +75 koz combined. These veins are estimated to have grades in the order of 12 to 13 g/t, which is higher than the grades at Sandra K, and therefore represent significant upside if confirmed via additional drilling and sampling. The 2019 drilling highlighted continuity in the structures and therefore an exploration program to extend the mine to depth is recommended. |
| ○ | The only other change of note at Sandra K was a reduction of -15 koz in the southern fault block of the Veta Techo (SKT) vein. |
Impact from Change in Cut-off Grade from 3.0 g/t to 2.9 g/t
| • | Reconciliation on the new model between a cut-off of 2.9 g/t to 3.0 g/t shows an increase in the contained metal for the M&I of +11 koz, and +10 koz for the Inferred Material. |
| • | The largest increases occur at El Silencio (+7 koz) and Providencia (+3 koz) for the M&I. |
| • | Within the Inferred the main increase is +6 koz within the El Silencio model. |
| • | There is limited growth in the Mineral Resources at Sandra K and Carla based on the marginal changes in the CoGs. |
|
BP/KD |
May 2022 |
| SRK Consulting (U.S.), Inc. NI 43-101 Technical Report – Segovia 2021 PFS Update |
Page 241 |
Table 14-21: Mineral Resource Comparison to Previous Estimates for all Mines
| Project | Deposit | Type | Measured | Indicated |
Measured and Indicated | Inferred |
||||||||||||||||||||||||||||||||||||||||||||||
| Tonnes | Grade | Au Metal |
Tonnes | Grade | Au Metal |
Tonnes | Grade | Au Metal |
Tonnes | Grade | Au Metal |
|||||||||||||||||||||||||||||||||||||||||
| (kt) | (g/t) | (koz) | (kt) | (g/t) | (koz) | (kt) | (g/t) | (koz) | (kt) | (g/t) | (koz) | |||||||||||||||||||||||||||||||||||||||||
| Segovia | Providencia | LTR 2020 Pillars 2020 |
218 109 |
18.5 22.3 |
130 78 |
237 99 |
14.9 10.2 |
114 32 |
455 208 |
16.6 16.5 |
243 110 |
171 384 |
9.9 19.8 |
55 245 |
||||||||||||||||||||||||||||||||||||||
| LTR 2021 Pillars 2021 |
263 156 |
12.0 | 101 | 385 | 8.8 | 109 | 648 | 10.1 | 210 |
367 458 |
7.0 17.6 |
83 259 |
||||||||||||||||||||||||||||||||||||||||
| 17.5 | 88 | 88 | 9.3 | 26 | 243 | 14.6 | 114 | |||||||||||||||||||||||||||||||||||||||||||||
| Difference LTR | 45 | -6.5 | -29 | 148 | -6.1 | -5 | 193 | -6.5 | -33 | 196 | -2.9 | 28 | ||||||||||||||||||||||||||||||||||||||||
| Difference Pillars | 47 | -4.8 | 10 | -11 | -0.9 | -6 | 35 | -1.9 | 4 | 74 | -2.2 | 14 | ||||||||||||||||||||||||||||||||||||||||
| Sandra K | LTR 2020 Pillars 2020 |
413 156 |
10 11.1 |
132 56 |
413 | 10 | 132 | 384 17 |
9.9 27.5 |
122 15 |
||||||||||||||||||||||||||||||||||||||||||
| 156 | 11.1 | 56 | ||||||||||||||||||||||||||||||||||||||||||||||||||
| LTR 2021 Pillars 2021 |
17 27 |
12.2 14.7 |
7 13 |
498 188 |
9.5 10.4 |
153 63 |
515 214 |
9.6 10.9 |
159 75 |
704 67 |
12.3 26.8 |
279 58 |
||||||||||||||||||||||||||||||||||||||||
| Difference LTR | 17 | 12.2 | 7 | 85 | -0.5 | 21 | 102 | -0.4 | 27 | 320 | 2.4 | 157 | ||||||||||||||||||||||||||||||||||||||||
| Difference Pillars | 27 | 14.7 | 13 | 32 | -0.7 | 7 | 58 | -0.2 | 19 | 50 | -0.7 | 43 | ||||||||||||||||||||||||||||||||||||||||
| El Silencio |
LTR 2020 Pillars 2020 |
1,277 | 9.8 | 404 | 1,277 | 9.8 | 404 | 1,279 | 9.0 | 371 | ||||||||||||||||||||||||||||||||||||||||||
| 1,326 | 10.6 | 454 | 1,326 | 10.6 | 454 | 395 | 11.4 | 145 | ||||||||||||||||||||||||||||||||||||||||||||
| LTR 2021 | 1,601 | 11.2 | 577 | 1,601 | 11.2 | 577 | 2,159 341 |
8.8 12.1 |
609 133 |
|||||||||||||||||||||||||||||||||||||||||||
| Pillars 2021 | 1,228 | 11.4 | 449 | 1,228 | 11.4 | 449 | ||||||||||||||||||||||||||||||||||||||||||||||
| Difference LTR | 324 | 1.4 | 173 | 324 | 1.4 | 173 | 880 | -0.2 | 238 | |||||||||||||||||||||||||||||||||||||||||||
| Difference Pillars | -98 | 0.8 | -5 | -98 | 0.8 | -5 | -54 | 0.7 | -12 | |||||||||||||||||||||||||||||||||||||||||||
|
Verticales |
LTR 2020 LTR 2021 |
0 | 0 | 0 | 0 | 0 | 0 | 771 | 7.1 | 176 | ||||||||||||||||||||||||||||||||||||||||||
| 0 | 0 | 0 | 0 | 0 | 0 | 771 | 7.1 | 176 | ||||||||||||||||||||||||||||||||||||||||||||
| Difference LTR | 0 | 0.0 | 0 | 0 | 0.0 | 0 | 0 | 0.0 | 0 | |||||||||||||||||||||||||||||||||||||||||||
|
Subtotal Segovia Project |
LTR 2020 Pillars 2020 |
118 108 |
15.9 26.1 |
60 90 |
1,504 1,727 |
11.5 10.8 |
555 602 |
2,145 1,690 |
11.3 11.4 |
779 620 |
2,605 796 |
8 16 |
724 405 |
|||||||||||||||||||||||||||||||||||||||
| LTR 2021 Pillars 2021 |
280 182 |
12.0 17.1 |
108 100 |
2,484 1,504 |
10.5 11.1 |
839 538 |
2,764 1,686 |
10.7 11.8 |
947 638 |
4,001 867 |
8.9 16.2 |
1,146 450 |
||||||||||||||||||||||||||||||||||||||||
| Difference LTR | 162 | -3.9 | 48 | 980 | -1.0 | 284 | 619 -4 |
-0.6 0.4 |
168 18 |
1,396 | 0.9 | 422 | ||||||||||||||||||||||||||||||||||||||||
| Difference Pillars | 74 | -9.0 | 10 | -223 | 0.3 | -64 | 71 | 0.2 | 45 | |||||||||||||||||||||||||||||||||||||||||||
| Carla | Subtotal Carla Project |
LTR 2020 | 132 | 6.0 | 25 | 132 | 6.0 | 25 | 260 | 9.7 | 81 | |||||||||||||||||||||||||||||||||||||||||
| LTR 2021 | 129 | 7.9 | 33 | 129 | 7.9 | 33 | 224 | 9.6 | 69 | |||||||||||||||||||||||||||||||||||||||||||
| Difference LTR | -3 | 1.9 | 8 | -3 0 6 |
1.9 0.0 10.9 |
8 0 2 |
-36 | -0.1 | -12 | |||||||||||||||||||||||||||||||||||||||||||
| Vera |
Subtotal Vera |
LTR 2020 | 0 | 0.0 | 0 | 0 | 0 | 0 | ||||||||||||||||||||||||||||||||||||||||||||
| LTR 2021 | 6 | 10.9 | 2 | 257 | 4.6 | 38 | ||||||||||||||||||||||||||||||||||||||||||||||
| Difference LTR | 6 | 10.9 | 2 | 6 | 10.9 | 2 | 257 | 4.6 | 38 | |||||||||||||||||||||||||||||||||||||||||||
Source: SRK, 2022
|
BP/KD |
May 2022 |
| SRK Consulting (U.S.), Inc. NI 43-101 Technical Report – Segovia 2021 PFS Update |
Page 242 |
| 14.13 Relevant | Factors |
Although additional studies are recommended to further develop tailings and water management strategies, SRK considers there to be no other environmental, permitting, legal, title, social, taxation, marketing or other factors that could affect the Mineral Resource Statement.
|
BP/KD |
May 2022 |
| SRK Consulting (U.S.), Inc. NI 43-101 Technical Report – Segovia 2021 PFS Update |
Page 243 |
| 15 | Mineral Reserve Estimate |
Mineral Reserves stated here for the Segovia operations include four distinct areas named Providencia, El Silencio, Sandra K, and Carla. Providencia, El Silencio, and Sandra K are shown in Figure 15-1. Carla is located 7 km to the south of these mines. There are other mines in the vicinity, owned by GCM, however there are no Indicated resources stated outside of these four areas at this time. There are also other mines in the vicinity owned by others.
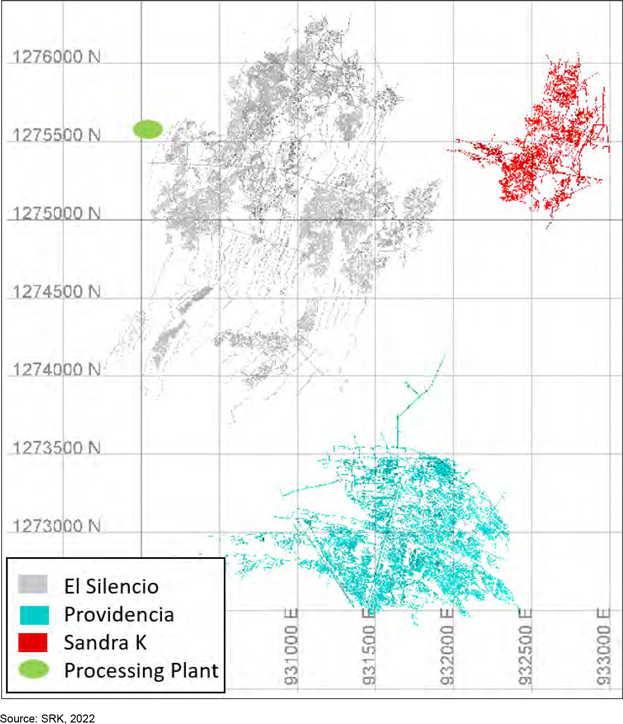
Figure 15-1: Segovia Reserve Areas
|
BP/KD |
May 2022 |
| SRK Consulting (U.S.), Inc. NI 43-101 Technical Report – Segovia 2021 PFS Update |
Page 244 |
The general dip of the orebodies for El Silencio, Providencia, and Sandra K areas is 30° to 40°. Carla is between 40-45°. The veins are narrow and range from several cm to over 1 m. Providencia, El Silencio, and Sandra K are actively being mined. Carla has been mined historically and rehabilitation/enlarging of the Carla main access was undertaken in 2020 with production in 2021. There is a future plan to connect the Providencia and El Silencio mines underground.
| 15.1 | Conversion Assumptions, Parameters and Methods |
Measured and Indicated Mineral Resources were converted to Proven and Probable Mineral Reserves by applying the appropriate modifying factors, as described herein, to potential mining block shapes created during the mine design process. Inferred material is treated as waste with zero grade.
| 15.1.1 | Dilution |
The stated reserves include dilution to a minimum mining width and additional expected dilution due to overbreak. Parameters used vary by area and mining method, as shown in Table 15-1, and are based on GCM’s experience in the underground mine
Table 15-1: Dilution Assumptions
| Mining Area |
Mining Method | Minimum Mining Height (m) | Overbreak Dilution | |||||||||||
| Providencia |
Room and Pillar | 1.5 | 0.3 m | |||||||||||
| Cut and Fill | - | Factor of 2.6 | ||||||||||||
| El Silencio |
Room and Pillar | 1.5 | 0.2 m | |||||||||||
| Carla |
Room and Pillar | 1.2 | 0.2 m | |||||||||||
| Sandra K |
Room and Pillar | 1.5 | 0.3 m |
Source: SRK, 2022
| 15.1.2 | Recovery |
Mining extraction ratios/recovery factors are applied to the mine design by area and by mining method as shown in Table 15-2.
Table 15-2: Mining Extraction/Recovery Assumptions
| Mining Area |
Mining Method | Extraction/Recovery of Designed Areas (%) 1 | ||||
| Providencia |
Room and Pillar | 90 | ||||
| Cut and Fill | 95 | |||||
| El Silencio |
Room and Pillar | 60 to 85 | ||||
| Carla |
Room and Pillar | 90 | ||||
| Sandra K |
Room and Pillar | 90 |
Source: SRK, 2022
Notes:
| 1. | In small mining areas adjacent to existing mining, extraction ratios are decreased to ensure a full 2 m x 2 m pillar stays in situ. The majority of El Silencio extractions are lower largely due to survey unknowns. In new mining areas at depth where survey information is complete at El Silencio, an 85% extraction is used. Wood packs and jack packs are used in areas to achieve these extractions. |
The extraction ratios/recovery factors consider:
| • | Maximum geotechnical extraction which includes existing openings underground |
| • | Timber packs and cement pillars are used where necessary to achieve the stated extraction ratios |
| • | Material loss to mucking along the sides |
|
BP/KD |
May 2022 |
| SRK Consulting (U.S.), Inc. NI 43-101 Technical Report – Segovia 2021 PFS Update |
Page 245 |
| • | Additional loss factor due to rockfalls, misdirected loads, and other geotechnical reasons |
| 15.1.3 | Additional Allowance Factors |
Development extensions in the PFS design include use of apiques and ramps. No additional allowance factors are used at this time.
| 15.2 | Reserve Estimate |
Mineral Reserves were classified using the 2014 CIM Definition standards. Measured Mineral Resources were converted to Proven Mineral Reserves and Indicated Mineral Resources were converted to Probable Mineral Reserves by applying the appropriate modifying factors, as described herein, to potential mining shapes created during the mine design process.
The underground mine design process resulted in underground mining reserves of 2.3 Mt (diluted) with an average grade of 10.11 g/t Au. The Mineral Reserve statement, as of December 31, 2021, for Segovia is presented in Table 15-3. The LoM production schedule is provided in Table 16-10.
Table 15-3: GCM Mineral Reserves Estimate as of December 31, 2021
| Segovia Mineral Reserves |
Cut-off (1):3.20 - 3.51 g/t | |||||||||||||||||
| Category |
Area | Tonnes | Au Grade (g/t) | Oz (in situ) | ||||||||||||||
| Proven |
Providencia | 203,738 | 12.00 | 78,587 | ||||||||||||||
| Carla | - | - | - | |||||||||||||||
| Sandra K | - | - | - | |||||||||||||||
| El Silencio | - | - | - | |||||||||||||||
| Subtotal Proven |
203,738 | 12.00 | 78,587 | |||||||||||||||
| Probable |
Providencia | 154,644 | 9.92 | 49,339 | ||||||||||||||
| Carla | 72,193 | 9.55 | 22,157 | |||||||||||||||
| Sandra K | 399,036 | 8.01 | 102,754 | |||||||||||||||
| El Silencio | 1,460,863 | 10.47 | 491,823 | |||||||||||||||
| Subtotal Probable |
2,086,736 | 9.93 | 666,073 | |||||||||||||||
| Total |
Proven + Probable | 2,290,474 | 10.11 | 744,661 | ||||||||||||||
Source: SRK, 2022
Notes:
| • | Ore reserves are reported using a gold cut-off grade (CoG) ranging from 3.20 to 3.51 g/t depending on mining area and mining method. The CoG calculation assumes a $1,650/oz Au price, 90.5% metallurgical recovery, $6/oz smelting and refining charges, 3.5% royalty, $21.72/t G&A costs, $26.06/t processing cost, and mining costs ranging from $99.70 to $114.05/t. Note that costs/prices used here may be somewhat different than those in the final economic model. This is due to the need to make assumptions early on for mine planning prior to finalizing other items and using long term forecasts for the life of mine plan. |
| • | Mining dilution is applied to a minimum mining height and to estimate overbreak (values differ by area/mining method) using a zero grade. |
| • | All figures are rounded to reflect the relative accuracy of the estimates. Totals may not sum due to rounding. Mineral Reserves have been stated on the basis of a mine design, mine plan, and economic model. Mineral Resources are reported inclusive of the Mineral Reserve. |
| • | There are potential survey unknowns in some of the mining areas and lower extractions have been used to account for these unknowns. |
| • | The Mineral Reserves were estimated by Fernando Rodrigues, BS Mining, MBA, MMSAQP #01405, MAusIMM #304726 of SRK, a Qualified Person. |
| 15.3 | Relevant Factors |
GCM continues to work on surveying historical workings to ensure all underground openings in the planned mining areas are well understood. This is an ongoing process and there are still areas within
|
BP/KD |
May 2022 |
| SRK Consulting (U.S.), Inc. NI 43-101 Technical Report – Segovia 2021 PFS Update |
Page 246 |
the various mines where uncertainties exist in the as-builts. Portions of the reserves stated here for El Silencio use a lower mining recovery than expected geotechnically, to provide an allowance for these types of potential unknowns.
There are approximately eight artisan mines that are located on GCM leases that are not included in the reserve estimate. Artisanal mines can provide approximately 20% of the plant capacity. Note that the Mineral Reserves and stated PFS economics are based on a LoM approximate average of 1,000 t/d processing rate. The maximum daily rate is approximately 1,750 t/d, the first two years of the production plan can support an average daily rate of 1,640 t/d and the feed rate starts to decrease in the following years and as the mining areas are depleted.
Contractor mining supplied ore is well documented at the plant through a detailed sampling system. The owner operated mines ore is not as well documented and historically produces on a consistent basis more than the mine plan model predicts.
The mine plan is based on improved productivities that incorporate improvements in mechanization and includes the purchasing of new mining equipment and enhanced ventilation.
The El Chocho Tailings area is functional and has capacity to support the PFS reserves.
|
BP/KD |
May 2022 |
| SRK Consulting (U.S.), Inc. NI 43-101 Technical Report – Segovia 2021 PFS Update |
Page 247 |
| 16 | Mining Methods |
The Segovia operations are located in a historic mining district that has been mined for over 150 years. The majority of the mineralization has a dip of approximately 35°. The current mining methods used at the Segovia operations include room and pillar mining as well as cut and fill. Material is typically removed from the mine through use of an apique hoist system (angled hoisting system which follows the dip of the vein structure).
| 16.1 | Current Room and Pillar Mining Method |
Room and pillar mining consist of a primary and secondary phase. The primary phase mines a traditional room and pillar layout to a stated extraction ratio and the secondary phase extracts additional material from pillars. The overall extraction from both phases is as stated in Section 15.1.2.
| 16.1.1 | Primary Mining |
Primary mining applies a conventional room and pillar technique using manual mining methods. The panels are accessed from the overlying and underlying haulage levels as well as from down-dip development that breaks up the panels into discrete mining blocks. A loading chute from which the mined rock can be loaded into the materials handling system is constructed within the lower haulage level access. Sublevels are then developed horizontally along strike. A slusher is an air powered or electric scraper that is used to pull muck from the face back to the loading chute. Rooms between the sublevels are mined creating the room and pillar layout. The sublevels have an ore chute either at the end or middle of the panels. The layouts follow the typical dip of the vein (~35°).
Historically, ramps are located within the mineralization and winzes are angled to follow the dip of the mineralized zone and are used for moving material and for access to the various levels. The subsequent cuts are developed and then connected by cross drifts as shown in Figure 16-1. More recently, ramps have been located in waste rock.
If the height of mineralization is smaller than the minimum mining dimensions (1.5 m by 1.5 m), yet still economic (i.e., above CoG) when diluted, then a “resue” methodology is used where horizontal holes are drilled in the face and the mineralization is blasted and mucked out. After the mineralization has been removed, the waste is blasted and mucked (to a previously mined area) to expand the size of the heading before the next round is mined. The purpose of the resue method is to minimize the amount of waste that is sent to the processing plant.
The mining at Segovia is very labor intensive and uses mostly slushers and jacklegs. Pillars are typically 4 m x 4 m and rooms are from 4 to 6 m wide; down to 2 m by 2 m; however, pillar sizes and shapes vary significantly as shown in Figure 16-1. Ground support, in most areas of the mines, is typically helical rock bolts, split sets, timber, mesh and shotcrete. Timber packs and cement pillars are used to achieve planned extraction ratios during pillar recovery.
|
BP/KD |
May 2022 |
| SRK Consulting (U.S.), Inc. NI 43-101 Technical Report – Segovia 2021 PFS Update |
Page 248 |
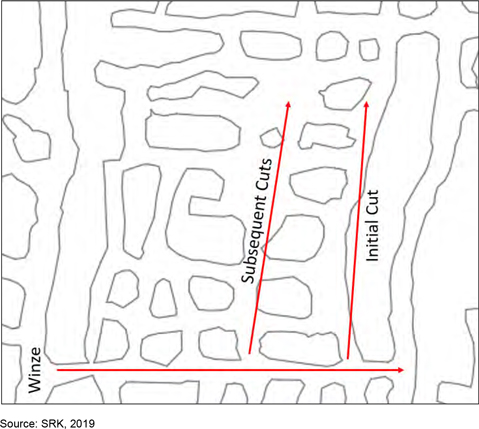
Figure 16-1: Typical Mining Layout
Sill pillars are left in situ to protect the haulage levels. A GCM geomechanics team sizes these pillars and completes a stability analysis. During 2018, Segovia conducted several specific window mappings and laboratory tests to better understand the pillar requirements to maximize recovery during primary mining. A portion of the current production comes from the reduction of pillars.
SRK notes that the majority of the workings (as seen from existing mining) do not follow this template and there is a high variability in the approach to mining each block. However, the vast majority of historic mining was undertaken by companies other than GCM and therefore cannot be considered representative of GCM’s approach going forward. SRK recognizes that processes are being implemented to improve the operational efficiencies of the mine which is intended to deliver more standardized mining practices.
Production is achieved using 38 mm blastholes drilled using airlegs. Blastholes are usually drilled to a 2 m depth although shorter drill steels are also used. The blastholes are charged using predominately emulsion cartridges although some ammonium nitrate fuel oil (ANFO) is used. A combination of detonators (electric and nonelectric or “Nonel”) and safety fuses are used in the various mining operations. Typically, around 30 drillholes will be used per round, although the drilling pattern is adjusted to suit the geometry and ground conditions. Powder factors average around 1 kg/t. Blasting times are scheduled to coincide with shift changes. Development ramps use mechanized drills (jumbos) with 3 m drill steels.
|
BP/KD |
May 2022 |
| SRK Consulting (U.S.), Inc. NI 43-101 Technical Report – Segovia 2021 PFS Update |
Page 249 |
The mined rock is mucked from the working face to the haulage level using slushers, from where it is loaded into a small rail network via a loading chute. The battery-powered locomotives haul 6 to 10 rail cars, with a capacity of approximately 2 t, to a grizzly that feeds an inclined shaft. The inclined shafts use 3 t skips to transport the material between multiple levels. As the inclined shafts follow the vein, intermediate rail levels are required to transport the payable material between shafts where the veins are offset by faulting.
| 16.1.2 | Secondary Mining |
Secondary mining is achieved using pillar recovery methods. Conventionally, two wooden supports (approximately 200 mm by 200 mm, equivalent to 8-inch by 8-inch) are installed adjacent to the pillar prior to mining. In areas of poor ground, additional support such as split sets and mesh may be added. The pillar is then either completely or partially removed depending on the geotechnical conditions. Minimum mining heights are approximately 1.2 m, limited by the space required for miners to work effectively. As secondary mining is more labor intensive, dilution is kept to a minimum to reduce the amount of material that requires loading by hand.
Drill and blast techniques for pillar extraction are similar to that used for production. Manual methods, including an airleg with a chisel bit and hand-held picks, are used in areas where the vein is very small or access is challenging.
Payable material is hauled by hand from the work face to the haulage levels in sacks of around 40 kg. The bags are stacked in the rail cars and use the same materials handling system to the surface as for primary mining.
Where primary and secondary mining occurs in the same mine, the methods are separated into distinct production areas to limit interaction. Occasionally, when secondary mining does occur within the primary mining work areas, it is strictly regulated to minimize the potential impact on stability in the immediate vicinity of recovered pillars.
GCM plans to undertake investigations into alternatives to timber supports to improve safety and maximize recovery from secondary mining as there is a lack of planning and reconciliation in areas where pillar recovery contractors have mined. The pillar extraction sequence is determined by the individual contractors and GCM provides basic maps showing which areas pillars have been mined and which are still in place. GCM informed SRK that plans are in place for improvements to be implemented; however, to SRK’s knowledge this has not yet occurred. The mine plan includes significant secondary mining material, with tonnage and grade calculated for the general mining area based on the block model.
| 16.2 | Current Cut and Fill Mining Method |
GCM uses two methods of cut and fill. The primary cut and fill method uses diesel LHD’s and electric/hydraulic jumbo drills with development located in waste in the hangingwall. Access to the vein is via crosscuts and drifting along the vein. The first cut in the vein is made using a jumbo drilling horizontally. The round is then blasted and mucked out with a diesel LHD. The back is bolted using jacklegs as required with attention paid to not bolting in the mineralized material unless required. The second cut and subsequent cuts are completed as follows. The jumbo drill is used to drill upholes in the vein. The entire length of the stope is drilled as a backstope, charged and timed to allow proper
|
BP/KD |
May 2022 |
| SRK Consulting (U.S.), Inc. NI 43-101 Technical Report – Segovia 2021 PFS Update |
Page 250 |
breakage of the mineralized material. A 1.5 m3 LHD is used to muck out the mineralized material from the backstope round. The waste material in the vein is drilled with the jumbo and advanced as a normal breast down round and left in place. The LHD is used to level the floor of broken waste with jacklegs used to bolt the back as required for each round. SRK notes that currently GCM has one Sandvik 210 jumbo drill, used for development. Other jumbos are on order and will be used as described above.
The secondary cut and fill method used by GCM is a modified resue method whereby the mineralized vein material is drilled and blasted using jackleg drills and then removed manually or with a slusher. The remaining waste rock material is then shot down to the floor and becomes the new working surface.
Both cut and fill methods used do not require backfill as the waste from the cut remains in the stope.
| 16.3 | Cut-off Grade Calculations |
CoG’s used for the reserves are based on LoM projected costs as shown in Table 16-1.
Table 16-1: Underground Cut-off Grade Calculation
| Parameter |
Units | Carla | El Silencio | Providencia | Sandra K | |||||||||||||||
| Gold price |
US$/oz | 1,650.00 | 1,650.00 | 1,650.00 | 1,650.00 | |||||||||||||||
| Au mill Recovery |
% | 90.5% | 90.5% | 90.5% | 90.5% | |||||||||||||||
| Mining cost (1,2) |
US$/t | 110.90 | 114.05 | 109.55 | 99.70 | |||||||||||||||
| Process cost |
US$/t | 26.06 | 26.06 | 26.06 | 26.06 | |||||||||||||||
|
G&A |
US$/t | 21.72 | 21.72 | 21.72 | 21.72 | |||||||||||||||
| Royalty |
% | 3.5% | 3.5% | 3.5% | 3.5% | |||||||||||||||
| Smelting & Refining |
US$/oz | 6.00 | 6.00 | 6.00 | 6.00 | |||||||||||||||
| Total Cost(3) |
US$/t | 165.05 | 168.35 | 163.67 | 153.42 | |||||||||||||||
|
CoG |
g/t | 3.44 | 3.51 | 3.41 | 3.20 | |||||||||||||||
Sources: SRK, GCM, 2022
Notes:
1. Note that costs/prices used here may be somewhat different than those in the final economic model. This is due to the need to make assumptions early on for mine planning prior to finalizing other items and using long term forecasts for the life of mine plan.
2. At this time there is no breakout of mining costs for room and pillar vs. cut and fill. In the future these costs should be tracked separately to allow for using variable CoG’s for design.
3 Total cost includes US$6.00/oz smelting and refining charge and royalty of 3.5%.
The basis for the PFS mine design work is the resource models described in Section 14. Grade/tonne curves showing Measured and Indicated material for each mine area, based on Au cut-offs, are shown in Figure 16-2 to Figure 16-5. Note that a minimum height is not used for reporting these grade/tonne curves.
|
BP/KD |
May 2022 |
| SRK Consulting (U.S.), Inc. NI 43-101 Technical Report – Segovia 2021 PFS Update |
Page 251 |
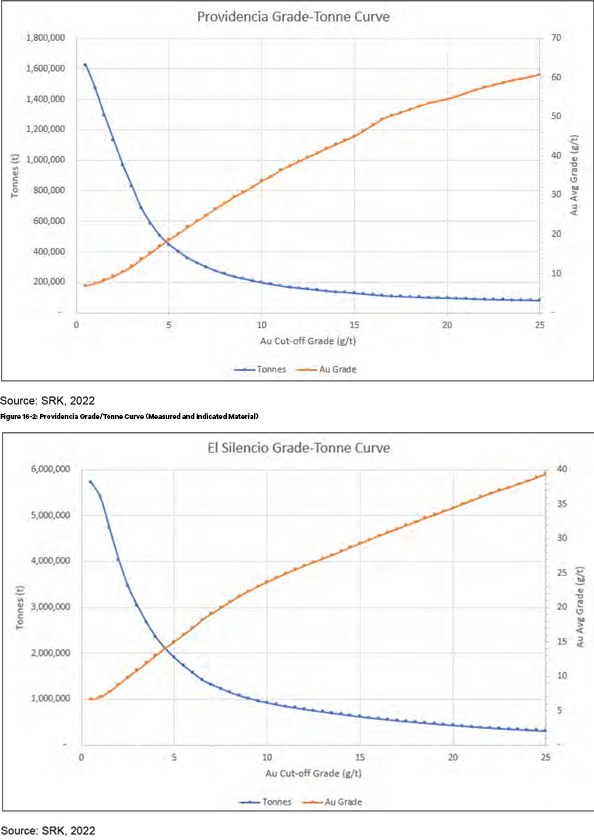
|
BP/KD |
May 2022 |
| SRK Consulting (U.S.), Inc. NI 43-101 Technical Report – Segovia 2021 PFS Update |
Page 252 |
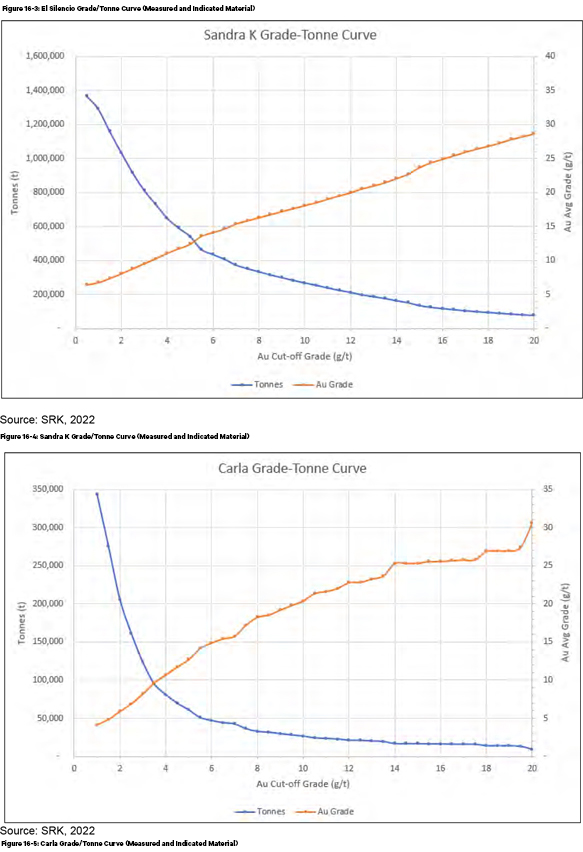
|
BP/KD |
May 2022 |
| SRK Consulting (U.S.), Inc. NI 43-101 Technical Report – Segovia 2021 PFS Update |
Page 253 |
| 16.4 | Geotechnical |
Segovia personnel, in conjunction with SRK, developed a geotechnical block model based on exploration drill holes, which included a total of 155,245 m of geotechnical data. Since 2018, the Segovia rock mechanics team has continued collecting geotechnical and structural data increasing the geotechnical database. As part of SRK’s work, a geotechnical specialist reviewed and validated the existing geotechnical data and has concluded that the collected rock mechanics and structural information comply with the industry standards and the quality and quantity are sufficient for supporting mine designs at a PFS level. Geotechnical data and laboratory tests are a continuous process, which helps Segovia personnel to continually update the geotechnical model. SRK recommends updating the geotechnical model every year at a minimum to increase the reliability of the rock mass model, structural domaining, and numerical simulations.
Segovia has conducted several laboratory tests to understand the intact rock strength. The laboratory tests were reviewed and validated by SRK, the validated laboratory tests included; 78 uniaxial compressive strength (UCS) tests, 98 multiaxial compressive strength (TXT) tests, 30 indirect tensile tests, 20-point load tests (PLT) valid tests, and 15 direct shear tests 9 (DST). Table 16-2, shows the results of the validated test.
Table 16-2: Valid Geotechnical Tests
| Number/Type of Tests | ||||||||||||||||||||||||||
|
|
Mine |
|
Multiaxial Compressive Strength |
|
|
Indirect Tensile (Brazilian) |
|
|
Multiaxial Compressive Strength |
|
|
Schmidt Hammer |
|
Point Load Tests | |
Direct Shear Tests |
| |||||||||
|
Providencia |
22 | 10 | 24 | 24 | 6 | 3 | ||||||||||||||||||||
| Sandra K |
17 | 6 | 24 | 28 | 6 | 5 | ||||||||||||||||||||
| El Silencio |
24 | 8 | 24 | 17 | 6 | 7 | ||||||||||||||||||||
|
Carla |
15 | 6 | 26 | 11 | 2 | - | ||||||||||||||||||||
|
Total |
78 | 30 | 98 | 80 | 20 | 15 | ||||||||||||||||||||
Source: GCM, 2021
Segovia has also implemented systematic traverse mapping with the objective to estimate the rock mass rating (RMR) using the Bieniawski,1989 system. At the time of this report, Segovia has conducted a total of 843 face mapping stations, following international standards. Table 16-4 summarizes the total number of windows mapping and the lithology mapped.
In addition to the systematic data collection and laboratory testing implemented, Segovia has implemented a convergence monitoring network across the operations. Based on the monitoring data no indication of excessive deformation has been observed, which would indicate that the pillar recovery has minimum effect on the mine stability.
Table 16-3: Window Mapping
|
|
Mine |
No. of Mapping Stations PFS 2018 | No. of Mapping Stations 2021 | |
Total Stations PFS 2021 |
| ||||||||
|
Providencia |
192 | 148 | 340 | |||||||||||
|
Silencio |
148 | 155 | 303 | |||||||||||
| Sandra K |
110 | 90 | 200 | |||||||||||
|
Carla |
- | 6 | 6 |
Source: GCM, 2021
|
BP/KD |
May 2022 |
| SRK Consulting (U.S.), Inc. NI 43-101 Technical Report – Segovia 2021 PFS Update |
Page 254 |
SRK considers that the existing geotechnical data is appropriate for supporting a PFS level mine design and extraction ratios. Based on the existing rock mechanics database, monitoring data, field observations, existing experiences and the application of the pillar recovery strategy database, SRK has provided PFS design parameters as shown in Table 16-2.
In the room and pillar areas, the access development consists of a 3 m by 3 m and a raise/access along the vein (referred to as tambores). Tambores are developed along with the dip of mineralization (~35°) and serve as a material handlings area where the material is slushed, and subsequently moved out of the panel. Tambores are constructed prior to exploitation. In many cases, development accesses to panels exist through current workings and did not need to be specifically designed.
Table 16-2: PFS Design Parameters
|
|
Mine |
Pillar Width, WP | Pillar Length, LP | Max Pillar Height, HP | Room Width, MP | |||||||||||||
| (m | ) | (m | ) | (m | ) | (m | ) | |||||||||||
|
Providencia |
2.5 | 2.5 | 2.5 | 2.5 | ||||||||||||||
| El Silencio 1 |
4.0 | 5.0 | 2 | 3.0 | 5.5 | |||||||||||||
|
Sandra K |
3.5 | 3.5 | 2.5 | 2.5 | ||||||||||||||
|
Carla |
3.5 | 3.5 | 2.5 | 3.5 |
Source: SRK, 2022
Notes:
1. Pillar dimensions do not include previously unmined areas
2. Opportunity for pillar optimization after detailed stability assessment
SRK did not review the detailed pillar recovery protocols and the short-term recovery plan. SRK tailored the effort to confirm the ongoing pillar recoveries and estimate the required ground support. SRK reviewed the 2D and 3D numerical simulations conducted by Segovia which supports the proposed pillar recovery and extraction ratio. After the stability model review was completed, SRK concluded that the numerical simulations method is sufficient to support the proposed extraction ratios and the pillar recovery strategy. Since 2018, Segovia has been successfully recovering high-grade pillars using timber packs at Carla, Sandra K, and Providencia for ground support as shown in Figure 16-6. Field observations indicate that the pillar recovery is also applicable to Carla.
|
BP/KD |
May 2022 |
| SRK Consulting (U.S.), Inc. NI 43-101 Technical Report – Segovia 2021 PFS Update |
Page 255 |
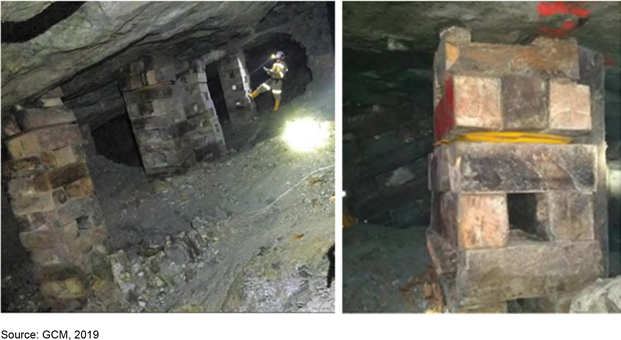
Figure 16-6: Timber Packs Example Used by Segovia
Based on PFS numerical simulations, it is concluded:
Sandra K
| • | 90% pillar recovery is acceptable |
| • | Pillar recovery requires square timber packs with 0.6 m width and 0.6 m length |
| • | Timber packs spacing 3.5 m between central line (pillar axe) |
El Silencio
| • | 85% pillar recovery is acceptable |
| • | Pillar recovery requires square timber packs with 0.6 m width and 0.6 m length |
| • | Timber pillar spacing 2.7 m between central line (pillar axe) |
Providencia
| • | 90% pillar recovery is acceptable |
| • | Pillar recovery requires square timber packs with 0.6 m width and 0.6 m length |
| • | Timber pillar spacing 3.5 m between central line (pillar axe) |
Numerical simulations showed that the potential roof instabilities are structurally controlled and not controlled by rock mass. Structurally controlled instability will become a significant safety risk; therefore, it is important that the timber pack installation follows the specifications and the installation plan. At a PFS level, the installation sequence and detail short term plan has not been evaluated. SRK recommends Segovia conduct a detailed stability assessment to examine the feasibility of the short- term mine plan.
|
BP/KD |
May 2022 |
| SRK Consulting (U.S.), Inc. NI 43-101 Technical Report – Segovia 2021 PFS Update |
Page 256 |
| 16.4.1 | Geotechnical Gap Assessment |
It is SRK’s opinion that the current rock mass understanding and the recommended mine design are suitable for a PFS. SRK has however identified some geotechnical gaps that must be addressed for feasibility and execution:
| • | Stress measurements in various areas of the mines needs to be implemented to determine the induced stress condition. |
| • | Mine scale 3D numerical model is required for simulating the mine scale stress condition |
| • | Although, Segovia has implemented a good monitoring network, SRK recommends measuring the wood packs performance. SRK considers that there are some opportunities of wood packs optimizations. |
| • | More laboratory tests needs to be implemented as part of the yearly budgeting. SRK considers valuable for Segovia mines increases the discontinuities direct shear test and Multiaxial compressive strength tests in all mines. In addition, a UCS with Elastic modules are strongly recommended. |
| • | There is not a centralized geotechnical database. SRK recommends that GCM implement a fully integrated geotechnical database which should (include at a minimum): |
| ○ | Geotechnical traverse mappings |
| ○ | Laboratory test results |
| ○ | Field inspections |
| ○ | Ground support tests |
| ○ | Instrumentations |
| 16.5 | Hydrogeology |
The mine area is in the hydrogeological regional area of Magdalena Cauca. Most of this region is comprised of igneous and metamorphic rocks with limited groundwater storage capacity and hydraulic conductivity. The fractured rocks within the Antioquia Department may host local aquifers (IDEAM, 2013).
Preliminary hydrogeological characterization developed for the environmental study in the RPP 140 district (Zandor, 2015) describes saprolite and bedrock as the two major hydrogeological units in the mine area. The saprolite is draped on the top of the bedrock as a surficial layer and has a thickness from 5 to 45 m. It is formed by clayey material generated through intense weathering processes; consequently, it is considered to have a low hydraulic conductivity unit. The bedrock is formed primarily by the Segovia batholith and dikes, covering almost all the mine levels. There is a high density of fractures and cracks in the unit, an assumed consequence of the long-term mine activity. Likewise, the mine developments are themselves lineal elements of very high permeability, which connect different zones of this unit. In 2021, SHI defined three preliminary hydrogeological units as follows (SHI, 2021):
Hydrogeological Unit I (HGU-I) corresponds to saprolites that cover the surface of the entire project domain. Geophysical studies suggest a thickness of 40 m. The clay material dominates this unit, generating low porosity and permeability conditions.
Hydrogeological Unit II (HGU-II) is formed by fractured intrusive rocks below the saprolite (HGU-I). Lugeon tests performed in this unit define an average thickness of 450 m, and a hydraulic conductivity
|
BP/KD |
May 2022 |
| SRK Consulting (U.S.), Inc. NI 43-101 Technical Report – Segovia 2021 PFS Update |
Page 257 |
(K) of around 0.1 m/d. However, this high K is associated to high-fractured tested zones related to fault areas or the intense mine activity.
Hydrogeological Unit III (HGU-III) corresponds to intrusive rocks with limited development of fractures, which are found below the 490 m of depth.
SRK has received hydrogeological information as part of the hydrological and hydrogeological investigation developed for GCM by HSA and SHI (HSA, 2020; SHI, 2021), and field data collected by GCM in 2021 (GCM, 2021). The low number of water level data and permeability tests in the hydrogeological unit makes it difficult to describe the groundwater dynamics in this area of study. Currently, nine piezometers have been completed in different levels of Segovia mines and three on the surface. Because the mines have been in operation for a significant amount of time, it is likely that a large cone of drawdown exists around each of the mines, and the combined drawdown seems to dominate the mining district. A preliminary potentiometric map created by HSA confirms this conclusion. This map shows water level elevation at -180 meters above mean sea level (mamsl) at the bottom of El Silencio mine, and above 230 mamsl in Providencia and Sandra K mines (Figure 16-6)
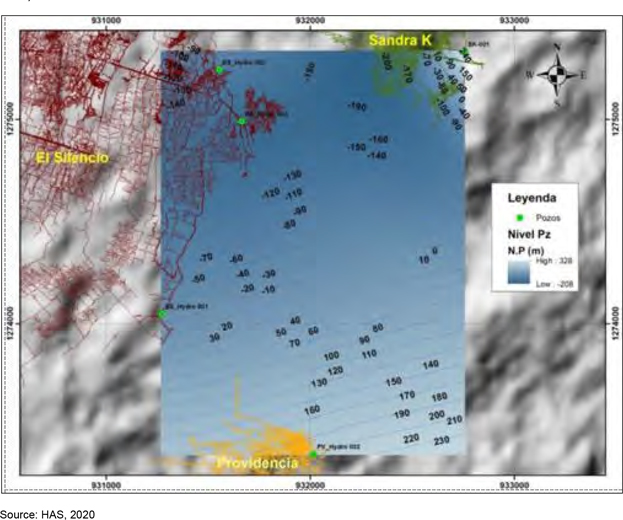
Figure 16-6: Preliminary Potentiometric Surface in Mine Area
|
BP/KD |
May 2022 |
| SRK Consulting (U.S.), Inc. NI 43-101 Technical Report – Segovia 2021 PFS Update |
Page 258 |
The recharge from precipitation and surface water flows occur primarily in the bedrock unit (Zandor, 2015), draining toward the bottom of the mine due to the cone of drawdown where it is ultimately pumped out to the surface streams close to the mines. Based on hydrological models, the annual average precipitation in the Segovia area is estimated to be 2,925.26 mm/year (HAS, 2020). The rainy season is from May to November, and the rainiest month is October, with 335 to 347 mm. The measured annual evaporation is 1,127 mm/year, and the real evapotranspiration has been estimated as 1,538.1 mm/year. Finally, the recharge from precipitation has been estimated to be between 11 to 21.6% of the annual precipitation (320.69 to 632.2 mm/year) (HSA, 2020). In 2021, a new hydrological model was developed by DHI (DHI, 2021), estimating the recharge of 317.9 mm/year and 129.2 mm/year in wet and dry years, respectively, and 224.6 mm/year in an average year.
In 2020 and 2021, GCM is developing a field campaign to collect hydrogeological data in El Silencio, Sandra K, and Providencia mines. The field campaign includes hydraulic tests and water level collection in five new piezometers. The results confirm relatively low hydraulic conductivity values (K) in the bedrock, 0.03 to 0.05 meters per day (m/d), with a reduction in-depth, and higher values in faults/fractured zones (0.25 to 1.7 m/d) (HSA, 2020). Additional tests were performed in October 2020 and February and April 2021 at the Sandra K, Providencia, and El Silencio mines, respectively, showing higher values in fractured areas from 0.14 to 3.2 m/d and (field data GCM, 2020/21 and SHI, 2021)..
The hydrogeological system is controlled by fracture and fault systems, generating confined conditions of moderate-pressured water in the fracture/fault zones and high permeability conduits in specific areas. An example of this is the artesian conditions found on level 38 of the El Silencio mine and the high flows detected in the Providencia mine on Level 4 W. Therefore, the potential presence of deep aquifers and high-pressured water in structures cannot be ignored, and further studies are recommended. SRK also recommends conducting a detailed hydrogeological field study of the main structures and fracture zones. SRK strongly suggests implementing a safety procedure for when high pressure/flow events are detected in the mine.
| 16.6 | Surface Water |
No information related to surface water impacts to the mine was provided to SRK. The mine facilities do not appear to be impacted by excess surface water run-off. No diversion was evident around the older TSFs. The El Chocho TSF includes surface water diversions in the design, preventing run-on from the surrounding hillsides mixing with the tailings water. The mine appears to be including design elements to address exclusion of surface water from the newer mine facilities. Further discussion of surface water management is described in Section 18.
| 16.7 | Mine Dewatering |
The dewatering strategy for the mines allows passive inflow of groundwater into the underground mine. The water flows under gravity to the lower levels of the mine, where it is collected and pumped to the surface. There is no active dewatering infrastructure (wells or galleries) in place that attempts to intercept groundwater before it enters the underground mine.
|
BP/KD |
May 2022 |
| SRK Consulting (U.S.), Inc. NI 43-101 Technical Report – Segovia 2021 PFS Update |
Page 259 |
| 16.7.1 | Water Data Sources |
The underground dewatering systems for Providencia, Sandra K, and El Silencio are relatively well documented in a report produced by GCM in 2017, entitled Sistema de Bombeo Minas Zandor Proyecto Segovia Remedios. The report includes tank capacities, pump specifications, cross-sectional diagrams showing levels, dewatering infrastructure, and plan-view maps. Additional information regarding the dewatering rates and dewatering system was received in 2021, however, several details are missing, and therefore a complete evaluation of the current dewatering system was not performed at this point.
GCM has provided mine discharge data for the Providencia, Sandra K, and El Silencio mines on a daily basis from May 2016 to December 2018. The average effective pumping rates for this period are:
| • | El Silencio: 978 gpm |
| • | Providencia: 1,171 gpm |
| • | Sandra K: 487 gpm. |
In 2019, the dewatering rates delivered by GCM were incomplete or absent. The records correspond to measurements at the ground surface; however, no further methodology details or locations have been received. During this period, the Providencia and Sandra K mines average 1,309 gpm and 499 gpm, respectively, which is very consistent with the historical records from 2016 to 2018. No information for El Silencio mine has been received for the year 2019. Figure 16-7 shows the dewatering records for each mine.
Currently, general dewatering rates reported by GCM are 3,000 gpm in Providencia mine, 1,085 gpm in El Silencio mine, and 700 gpm in Sandra K. Carla mine has a pumping capacity of 250 gpm; however, no information on current dewatering rates have been provided (flow in 2020 220 gpm). Detailed records of dewatering rates have not been provided by GCM for any of the mines in operation since 2020.
In February 2019, GCM carried out a preliminary mine reconnaissance to identify and quantify the points of groundwater inflow into the operating mines. Plan view maps were generated showing the location and flow rates of the sources of water (Figure 16-8 through Figure 16-10). Maximum flow rates recorded were:
| • | Providencia: 122 gpm |
| • | El Silencio:180 gpm |
| • | Sandra K: 45 gpm |
| • | Carla: 100 gpm |
|
BP/KD |
May 2022 |
| SRK Consulting (U.S.), Inc. NI 43-101 Technical Report – Segovia 2021 PFS Update |
Page 260 |
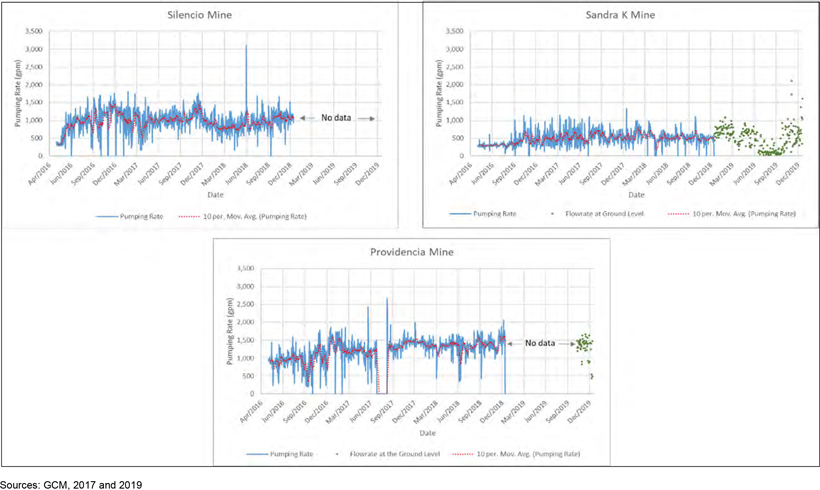
Figure 16-7: Measured Dewatering Rates
|
BP/KD |
May 2022 |
| SRK Consulting (U.S.), Inc. NI 43-101 Technical Report – Segovia 2021 PFS Update |
Page 261 |
The mine discharge data also provides mine water effluent chemistry data from Sandra K, El Silencio, and Providencia in spreadsheet format. Samples have been collected and analyzed twice a year, from 2011 to 2021. The typical list of analytes includes a short list of metals, pH, conductivity, temperature, oxygen demand, total suspended solids, total solids, E-coli, total hydrocarbons, and sulfate. Additionally, the Environmental group at GCM conducts periodic analysis that includes pH (daily) and quantity of solids in suspension (weekly).
| 16.7.2 | Dewatering System |
The mines allow a passive inflow of groundwater, using gravity to drain the groundwater to the bottom levels, where sumps are used to capture and settle the water. Water is progressively pumped to the surface using a network of water storage tanks at strategic locations. The water is pumped with the use of pneumatic membrane pumps or submersible pumps installed in auxiliary tanks, the intermediate capacity tanks generally employ the use of Barnes centrifugal pumps, and the main stations mostly operate with centrifugal pumps of the brands Durco, SIHI or Hidromac. A summary description of the dewatering system in each mine is presented as follows.
Sandra K
The Sandra K Mine has eight levels, with Level 8 being the main one with an elevation of 262 mamsl at the bottom of the mine (April 2022). The dewatering system has three main pumping stations on levels 3, 4, and 6, which can be considered permanent in the medium and long term. Other six pumping stations are located from Level 3 1⁄2 to Level 8, totalizing 20 pumps distributed in nine pumping stations. Table 16-3 shows the main features of the dewatering system installed in the Sandra K Mine.
Table 16-3: Dewatering System in Sandra K
|
Level |
Location | Pump Brand |
|
Pump HP |
|
|
# Pumps |
|
|
Flow Capacity (GPM |
) |
|
Water Storage Tank |
|||||||||||||
| Location | m3 | |||||||||||||||||||||||||
|
Level 8 |
Pond Tunnel 450 | Barnes | 25 | 1 | - | - | - | |||||||||||||||||||
| Bottom 6340 | Wilden | NA | 1 | - | ||||||||||||||||||||||
|
Level 7 1/2 |
Pond Tunnel 350N | Barnes | 6 | 1 | - | - | - | |||||||||||||||||||
| Pond 6340 | Grindex | 7.5 | 1 | 90 | ||||||||||||||||||||||
|
Level 7 |
Tank Level 7 (Tunnel 270) |
Barnes | 40 | 1 | 180 | - | - | |||||||||||||||||||
| Barnes | 25 | 1 | - | |||||||||||||||||||||||
|
Level 6 1/2 |
Shaft 6400 | Barnes | 15 | 1 | - | - | - | |||||||||||||||||||
| Barnes | 6 | 2 | - | |||||||||||||||||||||||
|
Level 6 |
Guía 6S | Grindex | 7.5 | 1 | - | Tank 6 | 32 | |||||||||||||||||||
| Tank Level 6 | Barnes | 40 | 1 | 128 | ||||||||||||||||||||||
| Barnes | 25 | 1 | 149 | |||||||||||||||||||||||
| Pond Level 6 | Grindex | 7.5 | 2 | - | ||||||||||||||||||||||
|
Level 5 |
Tank Level 5 | Barnes | 15 | 1 | - | - | - | |||||||||||||||||||
|
Level 4 |
Corte 6320S | Wilden | NA | 1 | - | Tank 4155 | 24 | |||||||||||||||||||
| Window 6210 | Barnes | 6.6 | 1 | - | ||||||||||||||||||||||
| Tank Level 4 | Barnes | 40 | 1 | - | ||||||||||||||||||||||
| Barnes | 25 | 1 | 132 | |||||||||||||||||||||||
|
Level 3 1/2 |
Window 6210 | Barnes | 6.6 | 1 | - | Tank 3 1/2 | 150 | |||||||||||||||||||
| Tank Level 3 1⁄2 | Durco | 150 | 2 | 618 | ||||||||||||||||||||||
|
Level 3 |
Guía 3S | Wilden | NA | 1 | - | - | - | |||||||||||||||||||
|
Level 0 |
Surface | - | - | 0 | - | Tank 0 | 198 | |||||||||||||||||||
Source: GCM, 2022
|
BP/KD |
May 2022 |
| SRK Consulting (U.S.), Inc. NI 43-101 Technical Report – Segovia 2021 PFS Update |
Page 262 |
In 2021, Sandra K pumped up to 700 gpm, keeping water levels at the bottom of the mine. This flow represents the average water per minute that is pumped to the surface. The planned mine bottom elevation is 235 mamsl (or 27 m deeper); therefore, no significant increase in the dewatering rate is expected.
A new main pumping station is currently under construction in Level 7 (Shaft 6430), which will discharge the water directly to Level 0 by two 350 HP pumps.
Sumps at all pumping station levels contain a sediment control settling system to clarify the water before pumping.
The hydrogeological mine reconnaissance (GCM, 2019) identifies moderate groundwater inflows in Level 0 (40 gpm) and Level 2 (45 gpm) (Figure 16-8).
|
BP/KD |
May 2022 |
| SRK Consulting (U.S.), Inc. NI 43-101 Technical Report – Segovia 2021 PFS Update |
Page 263 |
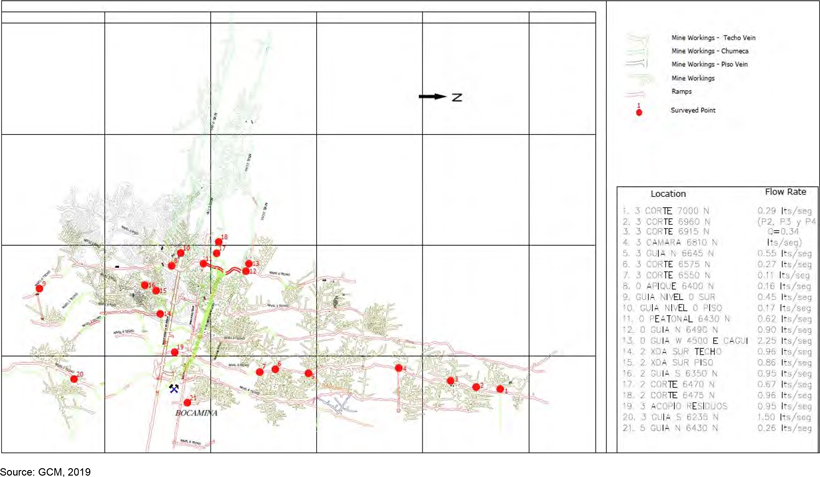
Figure 16-8: Hydrogeological Reconnaissance - Sandra K Mine
|
BP/KD |
May 2022 |
| SRK Consulting (U.S.), Inc. NI 43-101 Technical Report – Segovia 2021 PFS Update |
Page 264 |
Providencia
The Providencia Mine has 17 underground levels, with the deepest one reaching 100 mamsl (April 2022). The pumping system has 11 main pumping stations distributed in two branches, Level 4E and Level 4W. The total theoretical pumping capacity is 3400 gpm in 30 pumps. Table 16-4 shows the main features of the dewatering system in Providencia Mine.
|
BP/KD |
May 2022 |
| SRK Consulting (U.S.), Inc. NI 43-101 Technical Report – Segovia 2021 PFS Update |
Page 265 |
Table 16-4: Dewatering System in Providencia
| Level |
Location |
Pump Brand |
|
Pump HP |
|
|
# Pumps |
|
|
Flow Capacity (GPM) |
|
Water Storage Tank |
| |||||||||
| Location | m | 3 | ||||||||||||||||||||
| Level 1 |
Ramp 030 | Barnes | 40 | 2 | 460 | - | ||||||||||||||||
| Ramp 014 | Barnes | 25 | 2 | 240 | - | |||||||||||||||||
| Level 17 |
Tank 5 | Hidromac | 100 | 1 | 439 | Tank 5 | 293 | |||||||||||||||
| Hidromac | 100 | 1 | 500 | |||||||||||||||||||
| Level 16 |
Tank 4 | Barnes | 25 | 2 | 240 | Tank 4 | - | |||||||||||||||
| Ramp 3985 | Wilden | NA | 1 | - | ||||||||||||||||||
| Level 15 |
Pond 715 | Barnes | 25 | 2 | 239 | Tank 3 | 143 | |||||||||||||||
| Barnes | 40 | 1 | 230 | |||||||||||||||||||
| Tunnel 1504B | Barnes | 25 | 1 | - | - | |||||||||||||||||
| Level 14 |
Tunnel 1408W | Barnes | 40 | 1 | - | - | ||||||||||||||||
| Tank 3/Gal 4065 |
Durco | 150 | 1 | 456 | - |
|||||||||||||||||
| Durco | 200 | 1 | 406 | |||||||||||||||||||
| Level 13 |
Ramp Este | Grindex | 7,5 | 1 | - | - | ||||||||||||||||
| Tank 4155 | Barnes | 25 | 2 | 250 | Tank 4155 | 190 | ||||||||||||||||
| Level 12 |
Pond 4155 | Grindex | 7,5 | 1 | - | - | ||||||||||||||||
| APQ 3530 | Barnes | 25 | 1 | - | - | |||||||||||||||||
| Level 11 1/2 |
Tunnel 3690 | Wilden | NA | 1 | - | - | ||||||||||||||||
| Pond 11 1/2 | Barnes | 40 | 1 | 230 | Pond 11 1/2 | 73 | ||||||||||||||||
| Level 10 1/2 |
Tank 10 1/2 3660 | Hidromac | 200 | 2 | 554 | Tank 10 1/2 3660 | 135 | |||||||||||||||
| Level 10 |
Tank 9 1/2 3980 | Durco | 150 | 2 | 511 | Tank 9 1/2 3980 | 152 | |||||||||||||||
| Level 9 1/2 |
Tank 9 1/2 3530 | Durco | 150 | 2 | 380 | Tank 9 1/2 3530 | - | |||||||||||||||
| Level 8 |
Tank Level 8 | Durco | 150 | 1 | 882 | Tank Level 8 | 27,092 | |||||||||||||||
| Level 7 |
Tank 6 1/2 |
Durco | 200 | 1 | 1980 | Tank 6 1/2 |
|
226 |
| |||||||||||||
| Sihi | 250 | 1 | - | |||||||||||||||||||
| Level 4 |
Tank Level 3 1/2 |
Hidromac | 250 | 1 | 1585 | Tank Level 3 1/2 |
|
296 |
| |||||||||||||
| Durco | 150 | 1 | - | |||||||||||||||||||
| Tank Level 4 (bottom) | Barnes | 40 | 1 | 216 | Tank Level 4 (bottom) | - | ||||||||||||||||
| Guía Level 4 W |
Wilden | NA | 1 | - | - |
|||||||||||||||||
| Flygt | 12 | 1 | - | |||||||||||||||||||
| Tank Level 4 E | Franklin | 150 | 2 | 1950 | Tank Level 4 E | 397 | ||||||||||||||||
Source: GCG 2022
|
BP/KD |
May 2022 |
| SRK Consulting (U.S.), Inc. NI 43-101 Technical Report – Segovia 2021 PFS Update |
Page 266 |
In 2021, GCM reported a pumping rate of approximately 1,500 gpm from the pumping station Level 4E and same amount in Level 4W. No changes in the current mine bottom elevation are expected (100 mamsl); therefore, no significant changes in the dewatering rate are expected. However, if future underground development connects Providencia and El Silencio mines at any level, the dewatering systems from both mines need to be revisited.
The planned dewatering system considers five main pumping stations from level 4E to level 16, with a primary and a backup pump. Table 16-5 presents the summary of the modifications to the dewatering system.
|
BP/KD |
May 2022 |
| SRK Consulting (U.S.), Inc. NI 43-101 Technical Report – Segovia 2021 PFS Update |
Page 267 |
Table 16-5: Planned Dewatering System
| Station | Location | Tank | |
Pump |
Distribution | Pipes | Diameter | Length | Height | |
Flow (gpm |
) | ||||||||||||||||||||||||||||||
| m | 3 | Hours* | HP | Brand | From | To | Type | |||||||||||||||||||||||||||||||||||
| 1 | Level 4E | 40 | 0.2 | 150 | Franklin | Station 2-3 and Level 4 | Surface | PEAD | 8 | 333 | 110.5 | 900 | ||||||||||||||||||||||||||||||
| 0.2 | 150 | Franklin | Surface | PEAD | 8 | 333 | 110.5 | 900 | ||||||||||||||||||||||||||||||||||
|
|
2 | Level 8 | 25,000 | 172.0 | 150 | Durco | Level 6-7 and Shaft 3120 | Station 1 | PEAD | 6 | 401 | 120.8 | 640 | |||||||||||||||||||||||||||||
| 3 | Tank 3700 |
240 | 0.8 | 340 | Hidromac | Station 4 and levels 9-10-11 | Station 1 |
PEAD | 8 | 657 | 120.0 | 1,300 | ||||||||||||||||||||||||||||||
| 4 | Tank 3700 |
136 | 1.1 | 150 | Durco | Station 5 | Station 3 |
PEAD | 6 | 937 | 80.0 | 570 | ||||||||||||||||||||||||||||||
| 5 | Level 16 | 220 | 4.2 | 25 | Barnes | Mine bottom | Station 4 |
PEAD | 4 | 523 | 52.0 | 230 | ||||||||||||||||||||||||||||||
*Filling time
Source: GCG, 2022
|
BP/KD |
May 2022 |
| SRK Consulting (U.S.), Inc. NI 43-101 Technical Report – Segovia 2021 PFS Update |
Page 268 |
All of the tanks have a regular maintenance and cleaning schedule, as well as a system to settle suspended solids.
In 2016 and 2017, Providencia pumped an average of 1,068 gpm, keeping the water levels at the bottom of the mine (150 mamsl). In 2018, the average pumping rates increased to 1,342 gpm and 1,309 gpm in 2019 (incomplete). The combined total from 2016 to 2018 averaged 1,171 gpm.
The hydrogeological mine reconnaissance (GCM, 2019) identifies relatively high groundwater inflows at Level 6 (63 gpm), Level 4 (75 gpm), Level 2 – 6475 (77 gpm), the western end of Level 4 (122 gpm) and Level 14 – Sill (97 gpm) (Figure 16-9).
|
BP/KD |
May 2022 |
| SRK Consulting (U.S.), Inc. NI 43-101 Technical Report – Segovia 2021 PFS Update |
Page 269 |
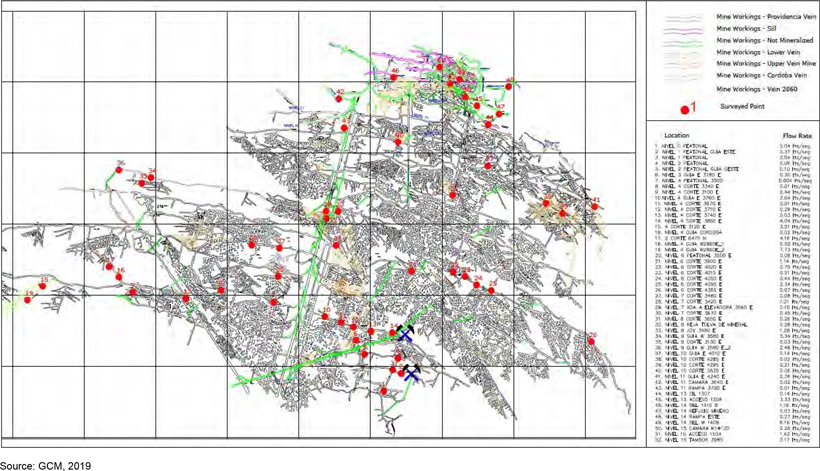
Figure 16-9: Hydrogeological Reconnaissance - Providencia Mine
|
BP/KD |
May 2022 |
| SRK Consulting (U.S.), Inc. NI 43-101 Technical Report – Segovia 2021 PFS Update |
Page 270 |
El Silencio
The El Silencio mine is the oldest and deepest in the Segovia district, with operations extending back more than 100 years and a bottom elevation of -349 mamsl (April 2022). Artisanal mine operations occur on Levels 26 to 46, and the mechanical mining equipment is housed on Level 24 north and south. The three major shafts are Shaft Zero (Level 32 to the surface), Shaft Bolivia (Level 23 to the surface), and Shaft 450 (Level 28 to 40); most of them are used as major pumping pathways for dewatering. Shaft Zero host the main dewatering system from Level 23 to Level 7. El Silencio mine has ten main pumping stations and seven auxiliary ponds between levels 40 and 48, totalizing 2,900 HP installed power.
|
|
Table 16-6 |
shows the main features of the dewatering system installed in El Silencio mine. |
Table 16-6: Dewatering System in El Silencio
| Level | Location | Pump Brand |
Pump HP |
# Pumps |
Flow capacity (GPM) |
Water Storage Tank | ||||||||||||||||
| Location | m3 | |||||||||||||||||||||
| Level 7 |
Shaft 0 | Sihi | 150 | 1 | 600 | Tank Level 7 |
91 | |||||||||||||||
| Hidromac | 200 | 1 | 650 | |||||||||||||||||||
| Level 16 |
Shaft 0 | Hidromac | 200 | 2 | 1290 | Tank Level 16 | 409 | |||||||||||||||
| Level 19 |
Shaft 0 | Sihi | 150 | 1 | 850 | Tank Level 19 | 454 | |||||||||||||||
| Level 23 |
Shaft 0 | Sihi | 150 | 1 | 700 | Tank Level 23 | 273 | |||||||||||||||
| Level 30 |
Tank Level 30 | Durco | 100 | 1 | 500 | Tank Level 30 | 170 | |||||||||||||||
| Level 28 |
Shaft 450 | Sihi | 250 | 1 | 1450 | Tank Level 28-450 | - | |||||||||||||||
| Level 31 |
Shaft 450 | Sihi | 250 | 1 | 1500 | Tank Level 31-450 | - | |||||||||||||||
| Level 34 |
Shaft 450 | Hidromac | 250 | 1 | 1430 | Tank Level 34-450 | 273 | |||||||||||||||
| Level 39 |
Shaft 450 | Sihi | 250 | 1 | 1480 | Tank Level 39- 450 |
|
228 |
| |||||||||||||
| Shaft 485 | Barnes | 15 | 1 | - | ||||||||||||||||||
| Level 40 |
Shaft 450 | Barnes | 5 | 1 | - | Tank Level 40-485 | 5 | |||||||||||||||
| Level 42 |
42- 550 | Monoblock | 100 | 1 | - | - | - | |||||||||||||||
| Level 43 |
43-120 | Flygt | 12 | 1 | - | Tank Level 43-400 | 1,271 | |||||||||||||||
| Shaft 195 | Barnes | 15 | 1 | - | ||||||||||||||||||
| Level 45 |
Shaft 400 | Durco | 100 | 2 | - | - | - | |||||||||||||||
| Level 46 |
46 -400 | Hidromac | 25 | 1 | - | - | - | |||||||||||||||
| Level 46 |
46 1/2 400 | Barnes | 15 | 1 | - | - | - | |||||||||||||||
| Level 47 |
10 corteros | Barnes | 3 | 1 | - | - | - | |||||||||||||||
Source: GCM, 2022
All of the tanks have a regular maintenance and cleaning schedule, as well as a system to settle suspended solids.
In 2016 and 2017, El Silencio pumped an average of 1,007 gpm, keeping the water levels at the bottom of the mine (-268 mamsl). During 2018, the average pumping rate decreased to 930 gpm. The combined total from 2016 to 2018 averaged 978 gpm. The maximum operational pumping rate was
|
BP/KD |
May 2022 |
| SRK Consulting (U.S.), Inc. NI 43-101 Technical Report – Segovia 2021 PFS Update |
Page 271 |
above 3,106 gpm for 8 hours (June 2018). In 2021, GCM reported an average dewatering rate of 1,085 gpm.
The planned mine bottom elevation is -460 mamsl (or 111 m deeper); consequently, an increase in the dewatering rate is expected. The short/medium-term dewatering plan includes new infrastructure in Level 12 to replace the current pumping stations in level 7 and 16. The long-term dewatering plan is a conceptual level optimization study, which does not include any dewatering station below the current Level 43. A pumping plan that considers the future mine at -460 mamsl is required.
The hydrogeological mine reconnaissance (GCM, 2019) identifies high groundwater inflows in the northeastern part of Level 38 (180 gpm), Level 18 (180 gpm) and in the western end of the Levels 43, 45 and 46 (150 gpm). Lower flow rates can be found in the southern part of Level 12 (150 gpm), Level 23 (130 gpm), and Level 29 (120 gpm) (Figure 16-10).
|
BP/KD |
May 2022 |
| SRK Consulting (U.S.), Inc. NI 43-101 Technical Report – Segovia 2021 PFS Update |
Page 272 |
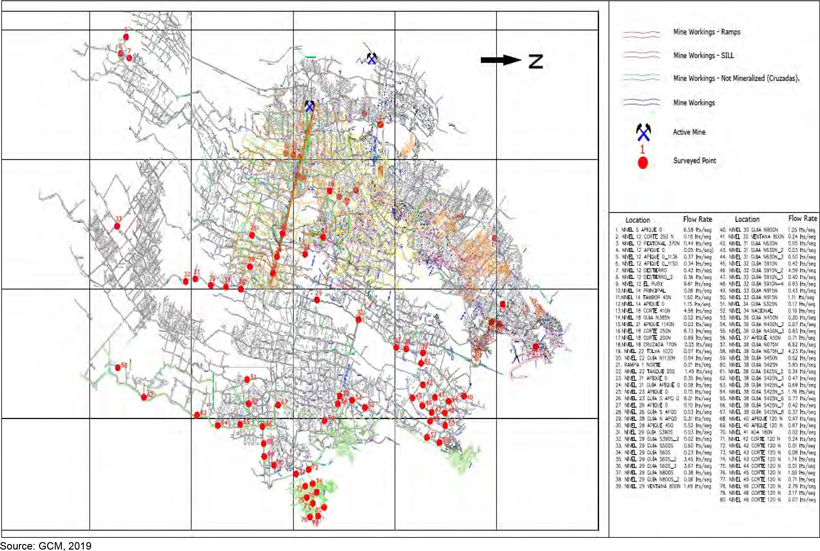
Figure 16-10: Hydrogeological Reconnaissance-El Silencio Mine
|
BP/KD |
May 2022 |
| SRK Consulting (U.S.), Inc. NI 43-101 Technical Report – Segovia 2021 PFS Update |
Page 273 |
Carla
The Carla mine is located 4.2 km south of the Providencia mine. It is a shallow mine with a projected bottom elevation 388 mamsl. Given the current mine bottom elevation of 519 mamsl and the distance from the major mines in the Segovia district, it can be considered independent from the dewatering influences at the El Silencio, Providencia, and Sandra K mines. The current dewatering system collects the water from the bottom of Shaft 8230 and “Guia 3”, stored in Level 3 1⁄2, pumped in a sequence to level 1 1⁄2 and to the surface with an installed pumping capacity of 250 gpm. Table 16-7 presents the main features of the dewatering system installed in the Carla mine.
Table 16-7: Dewatering System in Carla Mine
| Level |
Location |
Pump Brand |
|
Pump HP |
|
|
Flow Capacity (GPM) |
|
Water Storage Tank | |||||||||
| Location | m | 3 | ||||||||||||||||
| 3 |
Pond Shaft 8320 | Wilden | NA | - |
Level 3 |
|
22 |
| ||||||||||
| Tank Level 3 | Grindex |
|
8 |
|
|
8 |
| |||||||||||
| 2 |
Tank Level 2 | Barnes | 25 | 83 | - | - | ||||||||||||
| 1 |
Tank Level 1 | Barnes | 25 | 114 | Level 1 | 47 | ||||||||||||
| 0 |
- | - | - | - | Level 0 | 20 | ||||||||||||
Source: GCM, 2022
The future dewatering system is currently at a conceptual design level. It will increase the pumping capacity from 250 gpm to 540 gpm, with a main pumping station in Level 4, which will discharge the water directly to Level 0. A system to settle suspended solids is also planned.
The hydrogeological mine reconnaissance (GCM, 2019) identifies moderate groundwater inflows in the bottom of the shaft (100 gpm) (Figure 16-11).
Dewatering System Conclusions
The current dewatering system fits the needs of the mine operations at Sandra K, Providencia, El Silencio and Carla mines, however more details are needed to evaluate the system’s response to inrush flow events. Future mine plans are up to 111 m deeper than the current Segovia mines and over 130 m in Carla mine; this will increase the groundwater inflow into the mine as well as the lift head. The mine dewatering system will in the future will need to accommodate the new development. The design should consider potential inrush flow from deep aquifers and/or high-pressure water in fracture/fault systems. Such a design will need to be based on drilling and hydraulic testing to estimate static heads and the potential for large inrush events from faults or fracture sets.
|
BP/KD |
May 2022 |
| SRK Consulting (U.S.), Inc. NI 43-101 Technical Report – Segovia 2021 PFS Update |
Page 274 |
Figure 16-11: Hydrogeological Reconnaissance – Carla Mine
|
BP/KD |
May 2022 |
| SRK Consulting (U.S.), Inc. NI 43-101 Technical Report – Segovia 2021 PFS Update |
Page 275 |
| 16.8 | Geochemistry |
A substantial effort is needed to bring the mine into conformity with international best practices of data collection, management, and geochemical characterization. Implementation of a comprehensive data collection and management program will form the quantitative basis for understanding the current status, forecasting future impacts, and designing concurrent and post-closure mitigation measures to minimize environmental impacts. The primary areas of risk related to geochemistry are presented in Section 20.1.3.
| 16.9 | Identifying Minable Areas |
The block models were constructed in such a way that there is a single block in the z direction through the mineralization. The block is assigned a thickness based on the geological wireframes. Due to this type of block model construction, a stope optimization type of approach was deemed unnecessary and more of a grid type model approach was used for mine planning.
To determine minable areas, the grades in the block model were diluted to include a minimum mining height and expected overbreak dilution, as discussed in Section 15.1.1. The diluted grades above cut-off, based on mining method, were then displayed on the screen and polygons were drawn around minable panel areas. This was done for each individual vein (as some veins are stacked on top of each other). Panel sizes vary considerably from small panels around existing workings to larger panels in new mining areas.
Once mining areas were identified, the geologic vein triangulations were cut to the polygons giving a 3D shape showing the mining area (without dilution). Cut and fill area triangulations were further cut into 3 m high levels to provide specific tonnage/grade information for each cut. Tonnages and grades for each of the shapes was then reported based on the diluted tonnages and grades in the block model. As discussed in Section 15.1.2, recovery/extraction was applied to the tonnes/grade of each mining shape to determine the reserve.
There are ownership boundaries at the various areas which have been considered in the design process. Land ownership is discussed in Section 4.3.
| 16.10 | Mine Design |
Based on the identified mining areas, development was designed as necessary to provide access. In the room and pillar areas, development generally consists of a 3.5 m by 3.5 m development access to the area and a raise/access along the vein (referred to as a tambores). Accesses vary somewhat in size dependent on planned equipment and opening size of existing adjacent development. Tambores are developed along the dip of mineralization (~35°), using approximate dimensions of 2.0 m by 1.5 m, and serve as a material handlings area where material is slushed to and subsequently moved out of the panel. Additional detailed design should be completed prior to mining. In many cases, development accesses to panels exist through current working and did not need to be specifically designed.
In cut and fill areas, main ramps are designed either in the hangingwall or the footwall (footwall vs hangingwall determined based on existing underground openings) and are offset a geotechnically determined distance from the veins. Main ramp sizes range from 3 m by 3 m to 4.0 m by 3.5 m
|
BP/KD |
May 2022 |
| SRK Consulting (U.S.), Inc. NI 43-101 Technical Report – Segovia 2021 PFS Update |
Page 276 |
dependent on mining area. Main ramp grades are 13% with turning radius ranging from 11 m to 15 m. The main ramps connect to the veins via attack ramps which are sized as 3.5 m by 3.5 m openings. Currently the ramp has been developed to the lowest cut and fill level and attack ramps have been completed to select levels.
Additional infrastructure such as raises, and ventilation connections were designed as necessary. Waste tonnages were calculated using a density factor of 2.7 t/m3.
Figure 16-12 through Figure 16-15 show the completed mine design, colored by Au grade, for each mining area.
|
BP/KD |
May 2022 |
| SRK Consulting (U.S.), Inc. NI 43-101 Technical Report – Segovia 2021 PFS Update |
Page 277 |
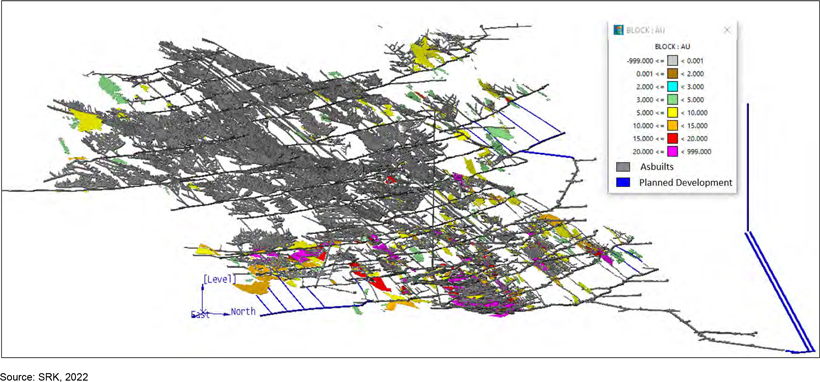
Figure 16-12: Providencia Mine Design, Colored by Au Grade (Rotated View)
|
BP/KD |
May 2022 |
| SRK Consulting (U.S.), Inc. NI 43-101 Technical Report – Segovia 2021 PFS Update |
Page 278 |
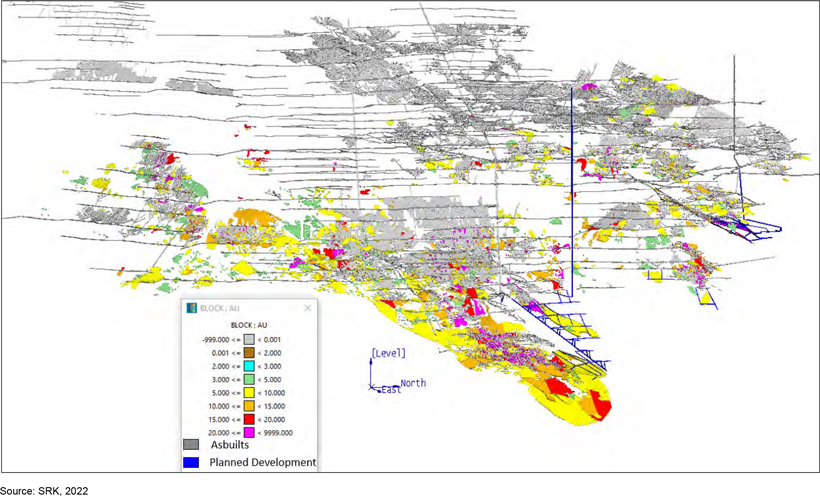
Figure 16-13: El Silencio Mine Design, Colored by Au Grade (Rotated View)
|
BP/KD |
May 2022 |
| SRK Consulting (U.S.), Inc. NI 43-101 Technical Report – Segovia 2021 PFS Update |
Page 279 |
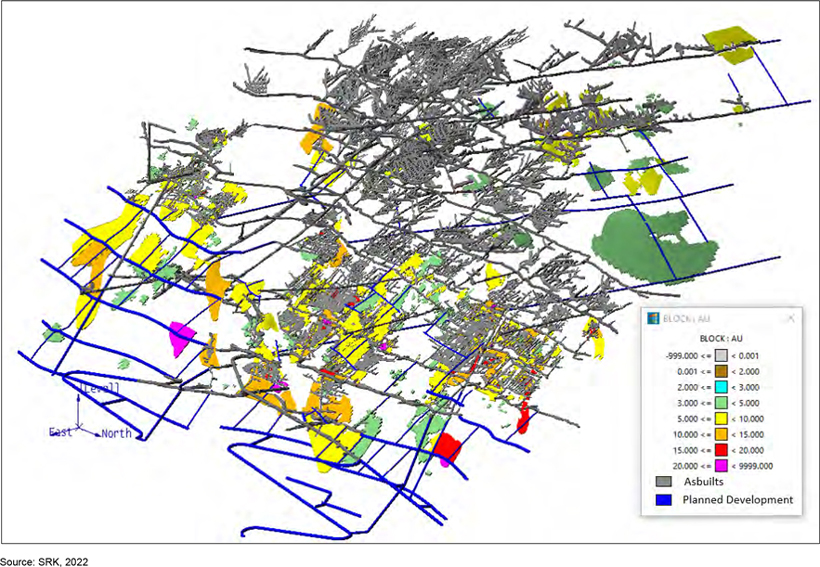
Figure 16.16-14: Sandra K Mine Design, Colored by Au Grade (Rotated View)
|
BP/KD |
May 2022 |
| SRK Consulting (U.S.), Inc. NI 43-101 Technical Report – Segovia 2021 PFS Update |
Page 280 |
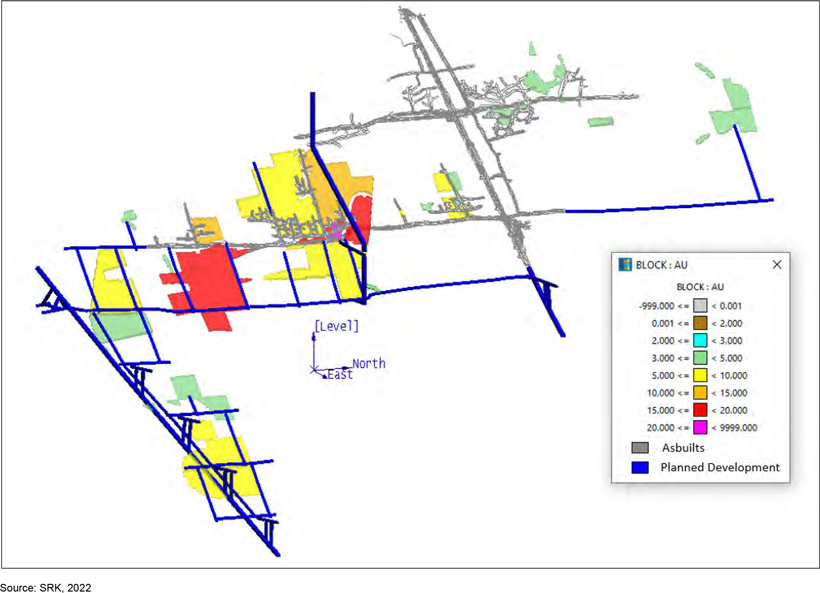
Figure 16-15: Carla Mine Design, Colored by Au Grade (Rotated View)
|
BP/KD |
May 2022 |
| SRK Consulting (U.S.), Inc. NI 43-101 Technical Report – Segovia 2021 PFS Update |
Page 281 |
The mine design total tonnage and Au quantities are summarized in Table 16-8. The mining areas are mined by the owner and by contractors and include mining of remnant pillars.
Table 16-8: Reserve Totals by Area and Mining Type
|
Area |
Mining Type | Tonnes (t) | Au Grade (g/t) | Ounces Mined (oz) | ||||||||||||
|
|
Providencia |
Owner Cut & Fill | 17,032 | 34.59 | 18,940 | |||||||||||
| Owner Room & Pillar | 309,692 | 8.75 | 87,108 | |||||||||||||
| Subtotal | 326,724 | 10.10 | 106,048 | |||||||||||||
| Masora - Contractor Remnant Pillar | 31,657 | 21.50 | 21,878 | |||||||||||||
| Providencia Ore Total | 358,381 | 11.10 | 127,927 | |||||||||||||
| Waste Development | 63,610 | |||||||||||||||
|
Carla |
Carla Room & Pillar Total Ore | 72,193 | 9.55 | 22,157 | ||||||||||||
| Waste Development | 42,489 | |||||||||||||||
|
Sandra K |
Sandra K Room & Pillar Total Ore | 399,036 | 8.01 | 102,754 | ||||||||||||
| Waste Development | 205,976 | |||||||||||||||
|
El Silencio |
Navar -Contractor Room & Pillar | 436,067 | 12.78 | 179,206 | ||||||||||||
| Owner Room & Pillar | 1,024,797 | 9.48 | 312,618 | |||||||||||||
| El Silencio Total Ore | 1,460,863 | 10.47 | 491,823 | |||||||||||||
| Waste Development | 160,638 | |||||||||||||||
| Total Ore |
2,290,474 | 10.11 | 744,661 | |||||||||||||
|
Total Waste Development |
472,713 | |||||||||||||||
Source: SRK, 2022
| 16.11Productivities | |
Productivities are developed from the existing operations and based on productivity improvements that mine personnel think are achievable given additional equipment/training. The current productivities are low if benchmarked against other projects in Mexico and South America but are improving. A pilot mining program is being tested at the Sandra K mine during 2021 to increase productivities that is a variant of the inclined panel mining to test the modified methodology.
General schedule parameters applicable to all underground mining activities are presented in Table 16-9.
Table 16-9: Schedule Parameters for Underground Mining
|
Schedule Parameters |
Units | Value | ||||||
|
|
Annual mining days Mining days per week 1 Shifts per day Scheduled shift length |
days/year days/week shifts/day hrs/shift |
|
360 7 3 8 |
| |||
|
Scheduled Deductions Travel to/from the underground working area from the surface Workplace examinations/equipment pre-shift inspections Lunch Breaks |
hrs/shift hrs/shift hrs/shift hrs/shift |
|
1 0.25 0.5 0.5 |
| ||||
|
Total Scheduled Deductions |
hrs/shift | 2.25 | ||||||
|
Operating time (scheduled shift length less scheduled deductions) Effective time (operating time reduced to a 50-minute hour, i.e., multiplied by 83.3%) |
hrs/shift hrs/shift |
|
5.75 4.79 |
| ||||
Source: SRK, 2021
Notes:
1. 50% of mine personnel work on Sundays, extracting normal production.
|
BP/KD |
May 2022 |
| SRK Consulting (U.S.), Inc. NI 43-101 Technical Report – Segovia 2021 PFS Update |
Page 282 |
Table 16-10 summarizes the productivities used in the production schedule. Note, that these rates are based on full months (i.e. operating every day of the month).
Table 16-10: Productivities Used in the Production Schedule 1
|
Area |
Activity Type | Rate | ||||
|
|
Providencia |
Tambores TB (2 m x 1.5 m) Development Accesses GL (3.5 m x 3.5 m) Chimenea Raise CH 3.5 m x 3.5 m Ramp RP (3.5 m x 3.5 m) MAS (Masora Contractor) CAF (Owner Cut and Fill Mining) RAP (Owner Room and Pillar Mining) |
20 m/month 30 m/month 30 m/month 40 m/month 30 t/d 30 t/d 30 t/d | |||
|
El Silencio |
Apique AP (2.5 m x 2.5 m – 3.7 m x 3.7 m) Chimenea, Raise (2.0 m x 2.0 m – 3.5 m x 3.5 m) Development Accesses GL (2.2 m x 2.3 m – 4 m x 3.5 m) Development Cross Cuts XC (2.2 m x 2.3 m – 3.5 m x 3.5 m) Pocket Development (2.5 m dia) Ramp RP(4 m x 3.5 m) Tambores TB (2 m x 1.5 m) Room and Pillar Mining |
20 m/month 30 m/month 30 m/month 30-40 m/month 20 m/month 40 m/month 20 m/month 30 t/d | ||||
|
Sandra K |
Chimenea Raise CH (3 m x 3 m) | 30 m/month | ||||
| Apique AP (2.5 m x 2.5 m) Development Accesses GL (2.2 m x 2.3 m – 3.5 m x 3.5 m) Ramp RP (4.0 m x 3.5 m) Development Cross Cuts XC (2.2 m x 2.3 m – 3.5 m x 3.5 m) Tambores TB (2 m x 1.5 m) Room and Pillar Mining |
15 m/month 30-40 m/month 40 m/month 30 m/month 20 m/month 30 t/d | |||||
|
Carla |
Apique AP (3.7 m x 3 m) Development Accesses GL (2.2 m x 2.3 m) Pocket PKT (2.5 m x 2.5 m) Development Cross Cuts XC (2.2 m x 2.3 m) Chimenea Raise CH (3 m x 3 m) Tambores TB (2 m x 1.5 m) Room and Pillar Mining |
15 m/month 40 m/month 15 m/month 30 m/month 30 m/month 20 m/month 20 t/d | ||||
Sources: SRK/GCM, 2022
Notes:
1. Note that dimensions used in this mine design may vary slightly from actual development (i.e., 3 m x 3 m vs 3 m x 3.2 m) These minor dimension changes can be made at the detailed mine planning stage.
| 16.12 | Mine Production Schedule |
Production schedules were generated using Vulcan Gantt scheduling software and were completed by GCM personnel. The mill is expected to operate 92% of the time, or 335 days/year with a capacity of 502 kt per year (1,500 t/d). The plant capacity is expanding to 2000 t/d. Ore material quantities from each mine vary over time with approximate targeted averages as follows:
| • | Providencia (owner and contractor): 400 t/d |
| • | Sandra K: approximately 350 t/d |
| • | Carla: approximately 75 t/d |
| • | El Silencio (owner and contractor) – 750 t/d |
Table 16-11 and Figure 16-16 present the production schedules. Figure 16-17 to Figure 16-20 show the annual mining schedule for each area. Figure 16-21 shows the in situ gold ounces by mine.
|
BP/KD |
May 2022 |
| SRK Consulting (U.S.), Inc. NI 43-101 Technical Report – Segovia 2021 PFS Update |
Page 283 |
Additional detailed mine planning is recommended at El Silencio to ensure appropriate blending similar to that presented in this PFS schedule.
Table 16-11: Segovia Mine Production Summarized Schedule
|
Description |
Units | 2022 | 2023 | 2024 | 2025 | 2026 | 2027 | 2028 | Total | |||||||||||||||||||||||||
|
|
Tonnes Au In Situ Au Grade |
(t) (oz) (g/t) |
|
569,648 223,658 12.21 |
|
|
543,341 197,278 11.29 |
|
|
468,598 136,985 9.09 |
|
|
288,994 88,546 9.53 |
|
|
174,128 50,238 8.97 |
|
|
143,362 32,366 7.02 |
|
|
102,402 15,591 4.74 |
|
2,290,473 744,661 10.11 | ||||||||||
| Waste Tonnes |
(t) | 208,496 | 164,438 | 89,947 | 9,832 | - | - | - | 472,713 |
Source: SRK, 2022
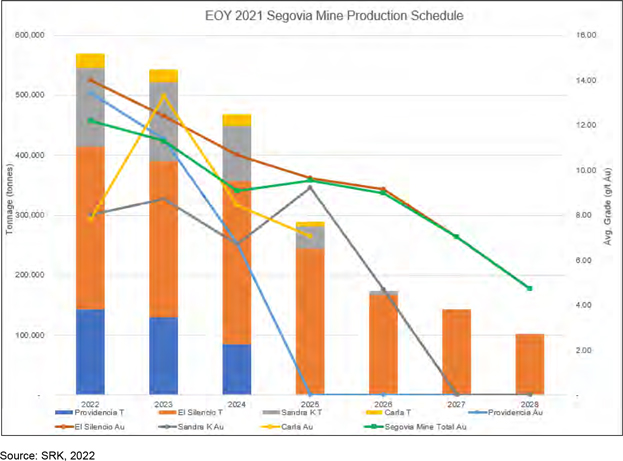
Figure 16-16: Segovia Mine Production by Area
|
BP/KD |
May 2022 |
| SRK Consulting (U.S.), Inc. NI 43-101 Technical Report – Segovia 2021 PFS Update |
Page 284 |
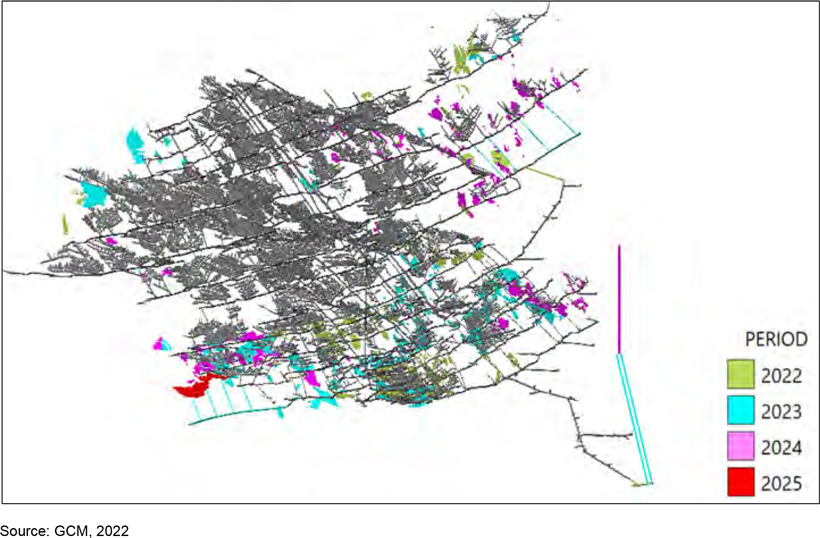
Figure 16-17: Providencia Mine Production Schedule Colored by Time Period (rotated view looking southwest)
|
BP/KD |
May 2022 |
| SRK Consulting (U.S.), Inc. NI 43-101 Technical Report – Segovia 2021 PFS Update |
Page 285 |
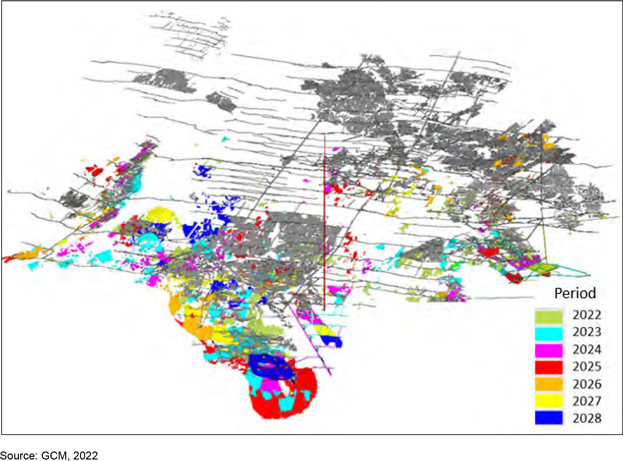
Figure 16-18: El Silencio Mine Production Schedule Colored by Time Period (Rotated View Looking West)
|
BP/KD |
May 2022 |
| SRK Consulting (U.S.), Inc. NI 43-101 Technical Report – Segovia 2021 PFS Update |
Page 286 |
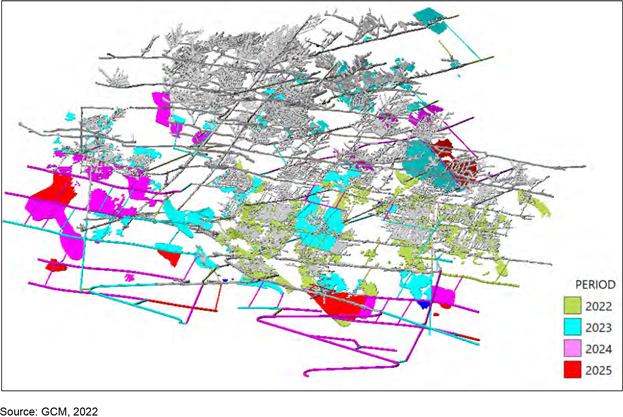
Figure 16-19: Sandra K Mine Production Schedule Colored by Time Period (rotated view looking westward)
|
BP/KD |
May 2022 |
| SRK Consulting (U.S.), Inc. NI 43-101 Technical Report – Segovia 2021 PFS Update |
Page 287 |
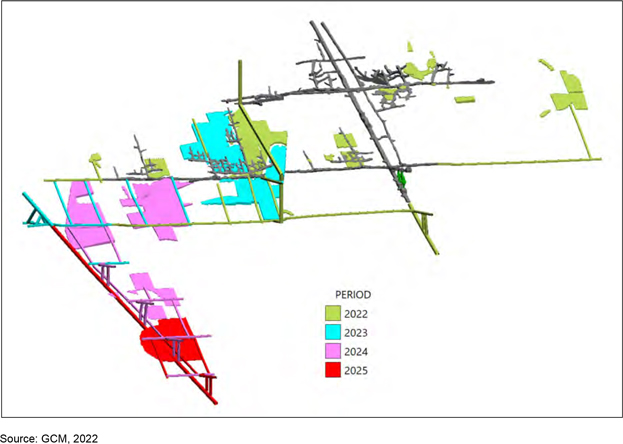
Figure 16-20: Carla Mine Production Schedule Colored by Time Period (rotated view looking west)
|
BP/KD |
May 2022 |
| SRK Consulting (U.S.), Inc. NI 43-101 Technical Report – Segovia 2021 PFS Update |
Page 288 |
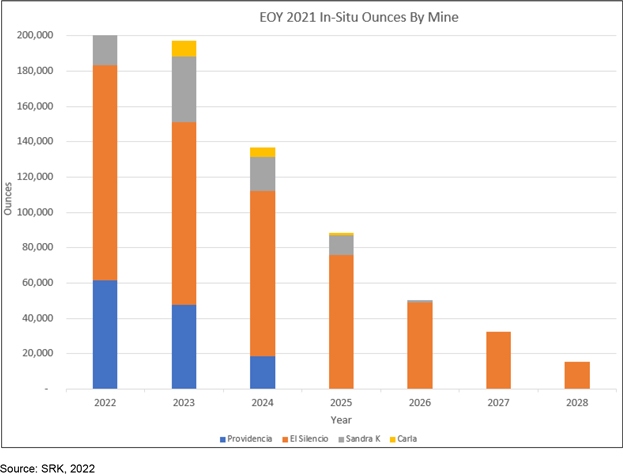
Figure 16-21: In Situ Au Ounces by Mine
Appendix B contains tables with detailed schedule information for each area.
| 16.13 | Mining Operations |
| 16.13.1 | Mine Access |
SRK has reviewed the current limitations of the apique hoist systems and has the following comments:
| • | Providencia apique system has a capacity of 650 t/d. This system is currently being used by the owner and contract miners. The mine plan has combined ore and waste production of 400 to 520 t/d (based on year-round operations). The current apique system capacity will be sufficient to handle the proposed tonnage. Apique 3530 provides access from Level 12 to the Cero Level and has a capacity of 650 t/d. Apique 3660 has a capacity of 550 t/d and provides service from Level 11 to Level 8. Contractors use Apique 3530 which has a capacity of 150 t/d (Level 0 to Level 8) |
Figure 16-22 shows a general Providencia material flow.
|
BP/KD |
May 2022 |
| SRK Consulting (U.S.), Inc. NI 43-101 Technical Report – Segovia 2021 PFS Update |
Page 289 |
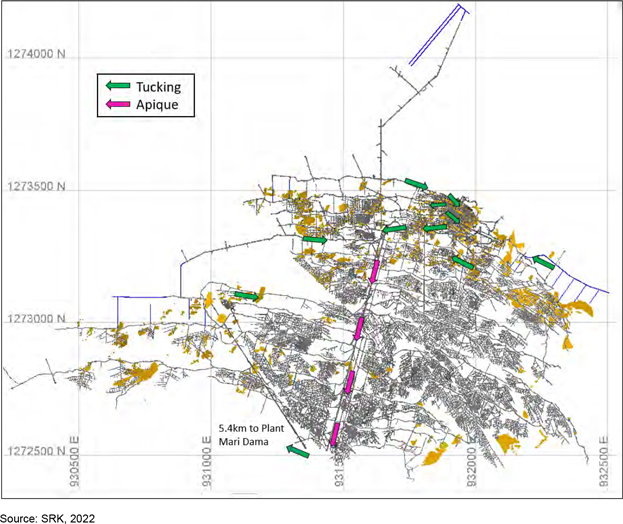
Figure 16-22: Providencia Mine Ore Path to Surface
El Silencio Mine is accessed via several apique systems. Apique Bolivia provides access from the surface to Level 25. Apique Bolivar has a capacity of 660 t/d (Level 25). If 21 level is used, the Apique has a capacity of 750 t/d. It is used for GCM production. Currently, Apique Bolivia is upgrading the motor and the capacity in June of 2022 will be 950 t/d. Apique Cero is used primarily by the contractor Navar and provides access from the surface to Level 28 and has a capacity of 480 t/d. Apique 450 provides Navar access to the deepest portions of the mine at Level 28. The 450 apique provides a 600 t/d capacity. There are ramps in some areas connecting various apique systems. Current projects at the mine include deepening of Apique Bolivia, completing a ramp near Apique Cero, and a new apique at depth to the northeast. There is a raise to surface in the northern part of the mine which has just been completed. The mine plan has combined ore and waste production of 720 to 970 t/d (based on year-round operations).
Figure 16-23 shows a general El Silencio Mine material flow.
|
BP/KD |
May 2022 |
| SRK Consulting (U.S.), Inc. NI 43-101 Technical Report – Segovia 2021 PFS Update |
Page 290 |
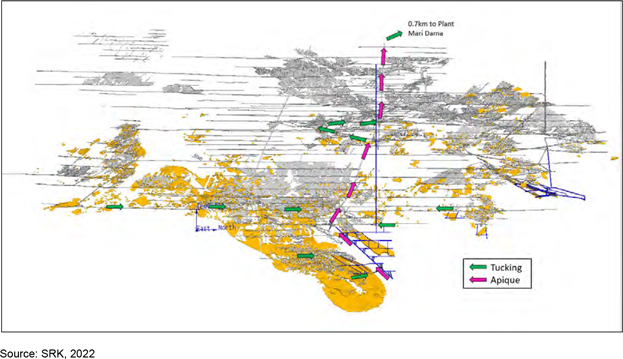
| Figure 16-23: El | Silencio Mine Ore Path to Surface (rotated view) |
Sandra K apique system has a capacity of 720 t/d. The mine is serviced by two apiques. Apique 6400 operates at 690 t/d and provides access from the surface to Level 6. Apique 6430 operates as personnel access and operates from Level 0 to Level 6. All mining at Sandra K is owner miners and contract miners are not currently mining in these areas. The mine plan has combined ore and waste production of 480 to 570 t/d (based on year-round operations). Figure 16-24 shows a general Sandra K material flow.
|
BP/KD |
May 2022 |
| SRK Consulting (U.S.), Inc. NI 43-101 Technical Report – Segovia 2021 PFS Update |
Page 291 |
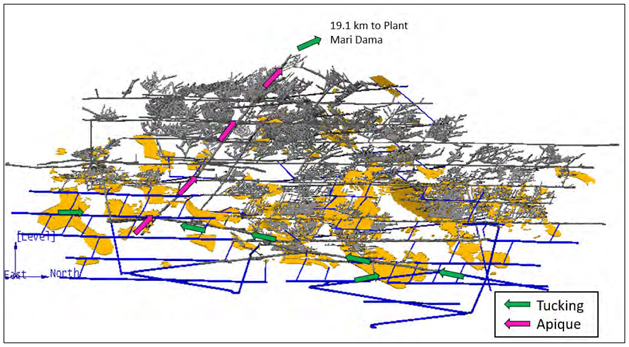
| Figure 16-24: Sandra | K Mine Ore Path to Surface (rotated view) |
Carla has a new apique from surface, with a capacity of 250 t/d. Mining at Carla is by owner mining. The mine plan has combined ore and waste production of 40 to 200 t/d (based on year-round operations). Figure 16-25 shows a general Carla material flow.
|
BP/KD |
May 2022 |
| SRK Consulting (U.S.), Inc. NI 43-101 Technical Report – Segovia 2021 PFS Update |
Page 292 |
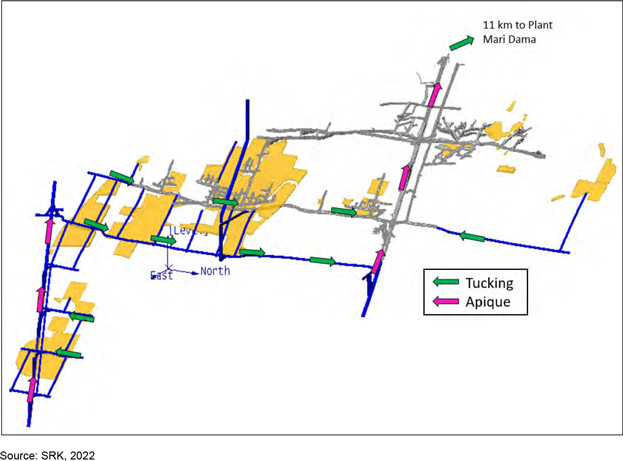
| Figure 16-25: Carla | Mine Ore Path to Surface (rotated view) |
| 16.13.2 | Mine Development |
At Sandra K, the development is completed typically in the same manner as El Silencio and Providencia. Drilling is done with a DD210 jumbo, loading with two MTI 1.2 yd3 LHDs or a LH307, and haulage with 16t and 7t haul trucks. The development cycle is typically completed once per shift. From level 6 and below, jumbos are used to develop the main ramp, material is loaded with LHD to the apique system.
At El Silencio and Providencia, jumbos are used to develop the main ramps. The jumbos drill 3 m rounds that are loaded with INDUGEL Plus AP and ANFO for blasting. Material is loaded with 2 to 3 yd3 LHD’s into 7 to 15 t nominal trucks (5.5 to 12 t effective) that move the material to the apique systems.
Rock bolting is completed on an as needed basis with jacklegs. Additionally, rock support utilizes steel mesh, shotcrete, timbering or steel frames. Much of the development is left unsupported due to the good quality of the walls rock (granodiorite Type I and II).
Ventilation raises are developed using airlegs drilling vertical holes from a constructed staging area. In some cases, contract Alimak raises are constructed. As the raise progresses upward the blasted rock is loaded below using an overshot mucker or LHD. 1.5 m by 1.5 m raises are mined initially and then enlarged to 4 m by 4 m raises.
|
BP/KD |
May 2022 |
| SRK Consulting (U.S.), Inc. NI 43-101 Technical Report – Segovia 2021 PFS Update |
Page 293 |
SRK notes that if these mining methods are used in the future, additional geotechnical work should be completed to assess the stability of working areas to ensure safe working conditions for the many personnel working underground. The extraction ratios are explained in other sections of this report.
Grade Control
Grade control is performed by a grade control geologist using a disk cutter to remove material from vein and surrounding rock. The sampling intervals are marked on the face using spray paint by the grade control geologist prior to sampling. All sampling is stopped along key geological contacts which are labeled as separate samples. The samples are taken from footwall to hangingwall with sampling approximately every 2 m along the drift or development raise. Samples are cut onto a plastic sheet to ensure a complete sample is captured and are then placed into a plastic sample bag. Areas where incomplete intersections exist are logged in the database such as vein in the hangingwall or footwall of the drift. These samples should be excluded from the geological modeling process as they would likely result in pinching of the vein on a local scale. In areas operated by contractors, a similar process is used but sampling uses a hammer and chisel and is considered a continuous chip sample. SRK considers the quality of these samples to be lower than using the disk cutter to ensure sample representativity.
The material placed in bags, is labeled by sample ID, location, and the location survey. The samples are shipped to a local laboratory operated by GCM (mine and contractors) and also to SGS Medellín (for exploration channels). Once analyses are received, the short-term planning geologists use polygonal methods, based on solely the mine control samples, to estimate the tonnes and grade for an area. SRK recommends the mine move to an active database and estimation process using the grade control samples to update the block models continuously as the sample information is available. This would allow for using standard estimating techniques, using grade control samples and exploration samples, to report tonnes and grade for an area. These models could then be evaluated on a local scale by polygons delineating the production panel for any given period. Currently grade control samples are only incorporated into the resource block model a few times a year, which SRK does not consider as appropriate for short term planning. The introduction of short-term models will also enable the ability to monitor the performance of the Mineral Resource model though out the year and allow management more flexibility.
| 16.14 Ventilation | |
The basic ventilation layout and evaluation of the existing ventilation systems for the Providencia Mine, El Silencio Mine and Sandra K Mine has been described in SRK’s report entitled “Review of Existing Ventilation Systems for the Providencia, El Silencio, and Sandra K Mines” (SRK, 2018) which was based on a site visit to each of the mines. The expansion of the existing ventilation systems to meet the new equipment loads and mining areas is described in the following sections.
| 16.14.1 | Basic Airflow Quantity Considerations |
Several factors must be considered when determining the airflow requirements for the mine such as gas dilution, diesel particulates, heat, maintaining minimum air velocities and meeting government regulations. These factors need to be applied to target areas to determine the actual total mine airflow requirement.
|
BP/KD |
May 2022 |
| SRK Consulting (U.S.), Inc. NI 43-101 Technical Report – Segovia 2021 PFS Update |
Page 294 |
Personnel Airflow Requirement
As the operation is less than 1,500 mamsl, Colombian regulations state that the minimum airflow per worker is at least 0.05 m3/s. This airflow requirement is typically used in areas without diesel equipment, as the requirements for ventilating diesel equipment far exceeds this value. This requirement includes the traditional room and pillar mining areas.
Diesel Dilution
As the operation is less than 1,500 mamsl, Colombian regulations state that the minimum airflow for diesel equipment is 4 m3/minute per hp which relates to 0.09m3/s per kW of engine power to ensure gaseous and aerosol contaminants from diesel equipment are sufficiently diluted, which is a typical minimum design value for many ventilation systems. This will be used to determine the airflow in the ramps/haulage routes, and on the mining levels.
Ventilation Raises
Two types of ventilation designs are used in the development of the underground ventilation system. Raise bore raises or Alimak raises, and room and pillar stope raises. The Alimak raises are modeled with dimensions ranging from 2 m by 2 m for inter level access raises, 2.5 m by 2.5 m for small surface raise connections, to 3.5 m by 3.5 m for the long El Silencio main exhaust raise to surface (the top 36.75 m of the raise is over bored with a diameter of 5 m). The room and pillar raises are developed through the vein and will only have the height of the vein, but their width may be larger. These were modeled at an equivalent area of 1.5 m by 1.5 m. Smaller surface exhaust raises were considered at 2.5 m diameter.
Horizontal Airways
Horizontal room and pillar accesses are sized at 3 m by 3 m to allow for the operation of an LHD. The cut and fill levels are designed at 3 m by 3 m to allow for the operation of an LHD with the access are designed at 4 m by 4 m to allow for the loading of the truck. The ramps are designed at 4.5 m by 4.5 m. For the room and pillar accesses where LHDs are not used, the access drifts will be approximately 2.4 m by 2 m. A notch will be required in the ramp just above the level to allow for the placement and operation of the level auxiliary fan.
Air Velocities
Air velocity limitations vary according to airway type. In areas such as return airways and shafts where personnel are not expected to work, higher velocities are acceptable. Table 16-12 shows airway velocities typically used by SRK for various airway types. Air velocity limits and recommended values for travel ways are established to accommodate work and travel by personnel and equipment, optimizing dust entrainment and temperature regulation.
|
BP/KD |
May 2022 |
| SRK Consulting (U.S.), Inc. NI 43-101 Technical Report – Segovia 2021 PFS Update |
Page 295 |
Table 16-12: Recommended Maximum Air Velocities for Various Airway Types
| Airway Type | Air Velocity (m/s) Maximum | |
| Travel Ways (As Required by Colombian Regulations) |
6 | |
| Primary Ventilation Intake and Exhaust Entries (No Personnel) |
10 | |
| Primary Ventilation Shaft(1) |
20 | |
| Ventilation Shaft with Conveyance or Escape |
10 |
Source: SRK, 2022
Notes:
| 1. | The typical value of 20 m/s is used to represent the maximum air velocity in a raise/shaft, for design purposes a value of 18 m/s is generally used to allow for flexibility in the design. |
Low airflow volumes may insufficiently dilute/remove airborne dust, but high air velocities will entrain larger dust particles, resulting in a potentially hazardous environment for personnel. An air velocity between 1.5 m/s and 2.5 m/s should be maintained to minimize dust in areas affected by dust generation. Air velocities in this range represent the provision of sufficient airflow to dilute the dust, without excessive air velocity to re-entrain dust.
In general, the minimum air velocity in a heading (without diesel equipment in operation) is based on the perceptible movement of airflow which is between 0.3 m/s and 0.5 m/s. The higher value of 0.5 m/s is used to comply with Colombian regulation.
Heat
Especially in areas ventilated with minimal air velocity, the heat produced by equipment (diesel or electric) may not dissipate quickly enough and could result in high air temperatures which could pose a hazard to workers. SRK recommends that a wet bulb temperature of 28°C be used as the design maximum for acclimated workers in areas where personnel will be active. Colombian regulations allow for an effective temperature 28°C above which work/rest cycles are required up to a maximum of 32°C. If conditions exceed this value in an active working area, work should be stopped, and the equipment load reduced or auxiliary ventilation systems adjusted. If this is not possible (i.e. auxiliary systems are already at maximum capacity or equipment load in the area cannot be further reduced), the establishment of a work-rest regimen (regular scheduled rest breaks) for workers may be required to maintain safe working conditions for miners working in elevated temperatures. Providing workers with cool water also helps to reduce the effects of heat on workers. It is important that ventilation/air velocity is supplied to the working areas and that workers are in “still” air.
| 16.14.2 | Airflow Calculations |
SRK and GCM compiled a schedule of development and production equipment that will be in operation over the LoM. Minimum airflow volume requirements for each vehicle were established based on vehicle motor power (kW) at 0.09 m3/s per kW and the airflow requirement for personnel was allocated at 0.05 m3/s per person. The airflow allowance for leakage is identified through the ventilation models and is not represented by a fixed percentage. A level of conservativeness is built into the airflow calculation as it assumes that all equipment is in operation at a 100% utilization rate.
The airflow requirement in cubic meters per second (m3/s) for the various mining areas, based on personnel and the diesel equipment fleet, is shown in Table 16-13. The airflow requirement expressed as thousand cubic feet per minute (kcfm) is included for reference. Areas being mined without diesel equipment will be evaluated based upon minimal airflow velocities and general stope airflow requirements.
|
BP/KD |
May 2022 |
| SRK Consulting (U.S.), Inc. NI 43-101 Technical Report – Segovia 2021 PFS Update |
Page 296 |
Table 16-13: Airflow Calculation for Personnel and Diesel Dilution
| Mine | Quantity | Equipment | Power (Hp) |
Airflow (m3/s) |
Total Airflow (m3/s) |
Total Airflow (kcfm) |
||||||||||||||||||
|
|
El Silencio |
1 | Jumbo D201 12 ft | 54 | 3.6 |
|
133.4 |
|
|
282.7 |
| |||||||||||||
| 1 | Muki LHB 8 ft | 74 | 5 | |||||||||||||||||||||
| 1 | Volqueta T 12 | 173 | 11.7 | |||||||||||||||||||||
| 2 | Volqueta Sandvik TH 315 | 220 | 29.7 | |||||||||||||||||||||
| 1 | Scoop Sandvik LH203 | 95 | 6.4 | |||||||||||||||||||||
| 1 | Scoop MTI LT210 | 55 | 3.7 | |||||||||||||||||||||
| 1 | Scoop Sandvik LH307 | 201 | 13.6 | |||||||||||||||||||||
| 1 | Bulldozer 550 J | 85 | 5.7 | |||||||||||||||||||||
| 1 | Camioneta Toyota | 230 | 15.5 | |||||||||||||||||||||
| 2 | Utilitario Kubota | 25 | 3.4 | |||||||||||||||||||||
| 1 | Camion NPS de Personnel | 153 | 10.3 | |||||||||||||||||||||
| 495 | Personnel (0.05 m3/s per worker) | 24.8 | ||||||||||||||||||||||
|
Providencia |
1 | Jumbo | 54 | 3.6 |
|
75.9 |
|
|
160.9 |
| ||||||||||||||
| 1 | Volqueta YMC | 86.5 | 5.8 | |||||||||||||||||||||
| 1 | Volqueta YMC | 86.5 | 5.8 | |||||||||||||||||||||
| 1 | Volqueta YMC | 86.5 | 5.8 | |||||||||||||||||||||
| 1 | Volqueta Joy | 96 | 6.5 | |||||||||||||||||||||
| 1 | Scoop LH203 | 112 | 7.6 | |||||||||||||||||||||
| 1 | Scoop LH203 | 112 | 7.6 | |||||||||||||||||||||
| 1 | Scoop MTI Diesel | 50 | 3.4 | |||||||||||||||||||||
| 2 | Utilitario Kubota RTV | 24.8 | 3.3 | |||||||||||||||||||||
| 1 | Camioneta | 150 | 10.1 | |||||||||||||||||||||
| 1 | Bobcat | 49 | 3.3 | |||||||||||||||||||||
| 260 | Personnel (0.05 m3/s per worker) | 13 | ||||||||||||||||||||||
|
Sandra K |
1 | Jumbo | 54 | 3.6 |
|
68.6 |
|
|
145.4 |
| ||||||||||||||
| 1 | Scoop | 201 | 13.6 | |||||||||||||||||||||
| 3 | Volqueta Sandvik TH315 | 220 | 44.6 | |||||||||||||||||||||
| 1 | Bobcat | 46 | 3.1 | |||||||||||||||||||||
| 75 | Personnel (0.05 m3/s per worker) | 3.8 | ||||||||||||||||||||||
| Carla |
75 | Personnel | 3.8 | 3.8 | 8.1 | |||||||||||||||||||
Source: SRK, 2022
| 16.14.3 | Ventilation System Design and Layout |
In 2019, ventilation models were developed for each of the four mines at representative maximum-case layouts. The mine plans have since been revised significantly for Sandra K and Carla mines, however, the main fan operating duties are expected to be similar to previous designs. The El Silencio mine has been revised to incorporate a ramp extending from the base of the Alimak to approximately Level 36 with an internal exhaust decline extending from the base of the Alimak half-way down the ramp extension. The Providencia mine maintains the main existing infrastructure with multiple additional working areas. The overall approach to the ventilation system at each mine is identified in the following sections.
Providencia Mine
The basic ventilation circuit for the Providencia mine exists, however, the system needs to be continually upgraded with improved bulkheads to counter the normal wear on the system and to reduce leakage. The mine has parallel Howden 5400 VAX 3150 HB fans installed at the top of the exhaust raise. The surface exhaust raise fan collar house will require continued maintenance and re-flashing
|
BP/KD |
May 2022 |
| SRK Consulting (U.S.), Inc. NI 43-101 Technical Report – Segovia 2021 PFS Update |
Page 297 |
to minimize leakage and maximize efficiency to allow the exhaust fans to operate at their full pressure. There is plan to replace the collar house with a single steel elbow that would remove the issue of the current flashing installation and improve efficiency. Fresh air is provided by the three surface openings and reaches the lower areas through both the apiques and the open workings. Once the air reaches the lower levels it is confined to the ramp and then is drawn through the stopes, up to Level 15, and then into the exhaust raise to surface (contra pozo). Level 15 will act as an exhaust plenum or transfer level to gather the exhaust airflow from the lower levels to move it into the contra pozo to surface. A 2.5 m x 2.5 m exhaust raise was developed between level 13 and level 15 and will be extended as new levels are developed.
The room and pillar stopes will be ventilated with fresh air supplied from the bottom and exhausted out the top, the cut and fill stopes will be ventilated from the stope access to the raises at the stope perimeter. Figure 16-26 shows the overall ventilation system for the mine.
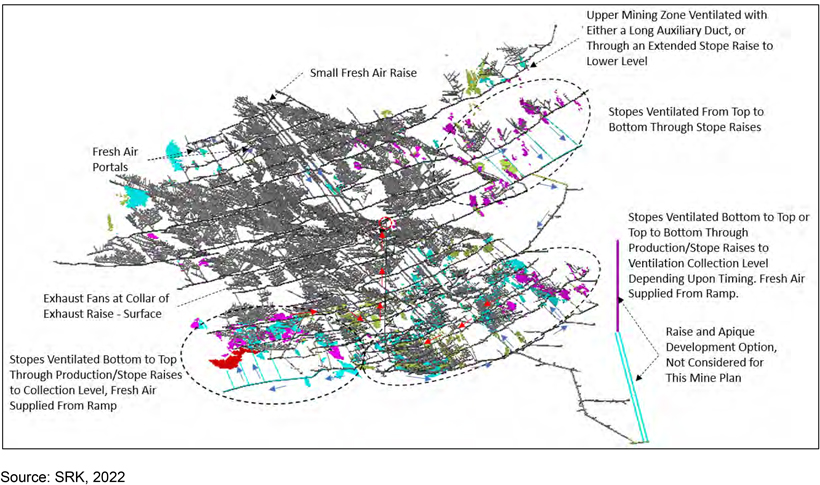
Figure 16-26: Providencia Mine Infrastructure Additions
The stopes in the upper areas representing remnant mining will be ventilated from the top down. The blasting in these stopes will be required to be scheduled as the stope exhaust will be drawn down to the lower workings. For those stopes located on the perimeter of the mine, small booster fans will be required to force the airflow out to the extremities through the ventilation loops.
El Silencio Mine
The main ventilation infrastructure for the El Silencio mine has been constructed with the exception of the lower connection between the deep south mining areas and the north. The principal ventilation system is driven by a set of parallel exhaust fans (Howden 8400 VAX 3150 FB) installed at the collar of the exhaust Alimak. The airflow to the ventilation system is supplied through the Apique 0, Apique Bolivia, Level 5 portal, and several lesser connections to abandoned mining areas. The El Silencio
|
BP/KD |
May 2022 |
| SRK Consulting (U.S.), Inc. NI 43-101 Technical Report – Segovia 2021 PFS Update |
Page 298 |
mine generally has three working areas, located away from each other, complicating the ventilation system. The El Silencio ventilation system will consist of several different air splits:
| • | One area (north) will be ventilated by drawing airflow down Apique Bolivia and parallel open stopes to the ramp system which will supply airflow to the stopes. The exhaust will be through the stope raises up to the base of the Alimak, then to the surface. The mining areas to the North will continue to be ventilated as they currently are with fresh air being provided through both the ramp and through the parallel stopes. The air is drawn to the bottom of the ramp and is directed into the exhaust raise. As new mining levels are developed deeper, the exhaust raise will be deepened in segments as is the current plan. The airflow entering the base of the raise will likely need to be regulated so that airflow may also be drawn from the south area. |
| • | The second area (lower south) will be ventilated by drawing airflow down Apique 0 and lower apiques to the working areas (contractor). The stopes in this area are all room and pillar which will be ventilated with fresh air supplied from the top and exhausted through the base of the stope. Airflow will be exhausted to toward the GCM worked levels. |
| • | The third area (lower GCM working areas) will exhaust toward the north through to the access ramp leading to the Alimak exhaust. The fresh air will be supplied by the combination of air from the lower contractor working areas sweetened by fresh air from Apique 438. As levels are developed below Level 38, fresh air can be drawn from the Apique system northern level extremities and exhausted through the north ramp extension. It is anticipated that only one or two levels would be in active production at any one time in this area, however multiple stopes along a level could be operated simultaneously. |
The current design incorporates a ramp extending from the Alimak area down to approximately Level 35. The lower portion of this ramp will provide an exhaust route to the exhaust decline leading to the exhaust Alimak, fresh air will be supplied by Apique 438. One booster fan “A” drawing airflow from the workings into the ramp extension located on approximately Level 35 to the Alimak will be required. A second booster fan/jet fan, fan “B”, will be required to draw fresh air down to the lower levels which will then be exhausted back up to Level 35/38. Booster fan “C” was previously specified and has been installed on Level 28 to draw fresh air from the perimeter to the access to the lower areas. Figure 16-27 outlines the proposed ventilation infrastructure layouts required to achieve the airflow distribution.
|
BP/KD |
May 2022 |
| SRK Consulting (U.S.), Inc. NI 43-101 Technical Report – Segovia 2021 PFS Update |
Page 299 |
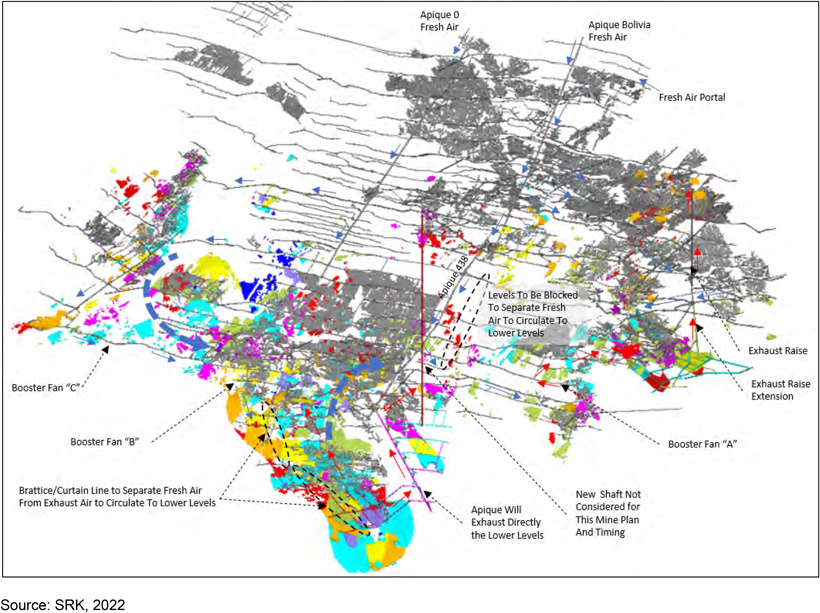
Figure 16-27: El Silencio Base of Alimak Infrastructure Layout
Sandra K Mine
The basic ventilation routing for the Sandra K mine will have fresh air supplied through the existing portal/adit and a short raise bypassing the blocked portal on Level 0 to the Apique system. The exhaust air is currently exhausting through the new Alimak raise extending to surface with parallel Howden 5400-VAX-2700 installed on Level 3. A zone between levels will need to be isolated so that a significant portion of the airflow can be drawn through the perimeter stopes, and then to the lower levels. This will require the installation of a booster fan. Figure 16-28 shows the system layout and ventilation routing phased from 2022 to 2025. The maximum airflow through the mine is approximately 80.4 m3/s, however, at this airflow the portal velocity will be approximately 8.4 m/s for a 25m section of drift but is reduced to 5.5 m/s for the rest of the portal adit. An ongoing program has been initiated to increase the portal dimensions to decrease the air velocity to 5 m/s. The second exhaust raise has been removed from the ventilation plan; this will require a booster fan to be installed to draw fresh air toward the perimeter so that it can be exhausted through the lower ramp system toward the exhaust raise. The stopes would all be ventilated from the top down; fresh air enters the stope from the top and the air is exhausted out of the bottom of the stope. There is an increased amount of mining in the accesses leading to the Rubiela Mine. The connections to the Rubiela Mine need to be controlled so that the ventilation through this portion of the mine can be stabilized and continuity be ensured in the case of changes in the Rubiela Mine.
|
BP/KD |
May 2022 |
| SRK Consulting (U.S.), Inc. NI 43-101 Technical Report – Segovia 2021 PFS Update |
Page 300 |
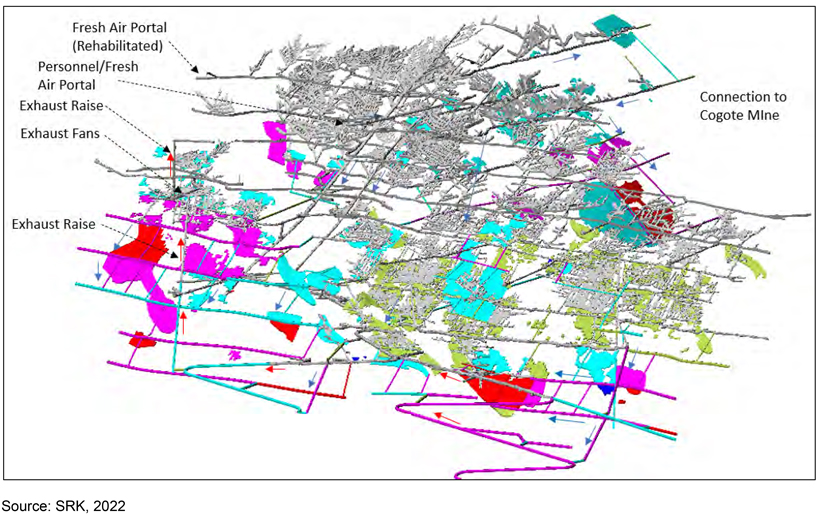
Figure 16-28: Sandra K Ventilation Model Layout and Identification
Carla Mine
The Carla Mine has a less extensive network of developed workings than the other mines, and less leakage is expected, allowing the ventilation system to be developed more rapidly. The overall ventilation layout for the Carla Mine is shown in Figure 16-29. Fresh air will downcast the principal apique and escapeway. Level 3 (or the lowest connected level) will be used for fresh air with the exhaust air upcasting the new exhaust raise. The exhaust fan is installed on Level 1 which will require an offset between the lower exhaust raise segment and the upper exhaust raise segment extending to surface in which the fan can be installed. Installing the fan underground will minimize the noise on surface and provide additional security for the fan installation. The lower levels (levels 4 to 7) are accessed by an apique with a parallel escape raise. Fresh air will flow down the apique and be exhausted through the escape raise up to Level 2, then across Level 2 to the exhaust raise to surface. The lower leg of the exhaust raise will be closed off, however, it can be extended if additional lower levels are developed. By exhausting through Level 2, the haulage on Level 3 will be unobstructed. Doors will be required on Level 1 and Level 2 to isolate the exhaust side of the ventilation system. The remote pod on Level 2 will require a dedicated auxiliary duct system to draw fresh air from the apique to the stope.
|
BP/KD |
May 2022 |
| SRK Consulting (U.S.), Inc. NI 43-101 Technical Report – Segovia 2021 PFS Update |
Page 301 |
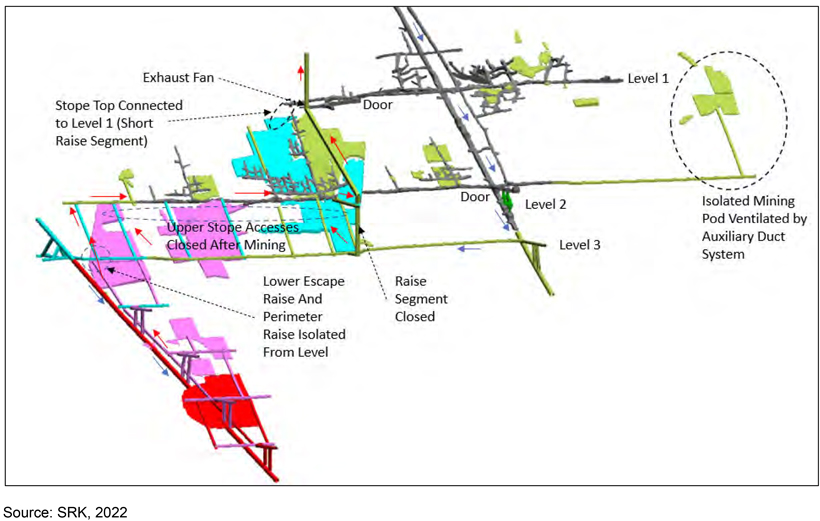
Figure 16-29: Ventilation Sequences for Carla Mine
The exhaust fan is based on a general value of 5 m3/s per mining area (flow through ventilation), a minimum air velocity on a level of approximately 0.5 m/s, and leakage. This results in an exhaust fan requirement of 60 m3/s with an applied pressure (bulkhead pressure) of approximately 500 Pa. Because of the low fan pressure requirement there can be an allowance for poor ground conditions, irregular drift sizes, and irregular stope ventilation distributions. The general sequencing of the infrastructure is as follows:
| • | The original ventilation duct has been upgraded along with the auxiliary ventilation fan. |
| • | The new personnel apique developed alongside of the production apique has been developed allowing for the initial flow though ventilation system to be established. Small booster fans installed on Level 1 and Level 2 will complete the circuit for the Level 1 exhaust fan, Level 1 mining, and Level 2 development. Once the parallel escape apique is developed the main duct can be removed. |
| • | Once the exhaust raise is developed to surface from Level 2, the exhaust fan installed on Level 1 can be turned on and the main ventilation system can be established. This will provide a full flow through ventilation system from which the remainder of the levels can be developed. |
| • | The second or lower apique is offset from the main surface apique and will be developed later. Fresh air will downcast the main apique with the exhaust routed through the escapeway up to Level 2. The perimeter raise between Level 2 and Level 3 will need to be isolated when the lower apique is developed. |
|
BP/KD |
May 2022 |
| SRK Consulting (U.S.), Inc. NI 43-101 Technical Report – Segovia 2021 PFS Update |
Page 302 |
| 16.14.4 | Auxiliary Ventilation Systems |
There are three types of auxiliary ventilation systems that will be used in both development and production at the four mines. In order to standardize the systems, they will all be grouped together based on general conditions.
Ramp Development
The ramp development was assumed to require an airflow to support the operation of both a truck and a LHD listed in Table 16-14. Providing airflow to support two pieces of equipment will provide flexibility. It was assumed that the length of the heading is 150 m with a flexible duct diameter of 0.75 m (twin ducts). Currently the mine is using 0.75 m duct, however, with the larger dimensions required for the operation of both a truck and LHD, the diameter of the duct should be increased to 1 m to improve the conditions at the face. If the larger duct is not possible due to special conditions then a parallel duct should be used.
Table 16-14: Ramp Development Equipment
| Equipment | Power (kW) |
Airflow (m3/s) |
Duct Size (m) | Airflow (m3/s) |
Pressure (kPa) |
|||||||||||||
|
Sandvik LH 307 |
160 | 14.4 |
Twin 0.75 with adapter to single fan |
|
30.8 |
|
|
5.7 |
| |||||||||
|
Dumper TH 315 |
164 | 14.8 | ||||||||||||||||
|
Sandvik LH 307 |
160 | 14.4 |
Twin 0.75 with adapter to single fan |
23.1 | 3.2 | |||||||||||||
|
Dumper TH 315 |
164 | @50% 7.4 | ||||||||||||||||
Source: SRK, 2022
A total of 21.8 m3/s must be delivered to the face of the ramp development if a utilization factor of 50% is applied to the operation of the dumper (used in the heading intermittently). In order to achieve the airflow at the face, a fan pressure of approximately 3.2 kilopascal (kPa) is required with an airflow of approximately 23.1 m3/s (face airflow quantity plus joint leakage).
Single Heading Stope Ventilation
The single side stope ventilation was assumed to require an airflow to support the operation of an LHD listed in Table 16-15. It is assumed that the loading of the haul truck will take place in the ramp or access. It was assumed that stope would be a maximum length of 80 m with a 20 m access length with a flexible duct diameter of 0.7 m.
Table 16-15: Single Heading Stope Equipment
| Equipment | Power (kW) | Airflow (m3/s) | Duct Size (m) | Airflow (m3/s) | Pressure (kPa) | |||||||||||||||||
|
|
Sandvik LH 203 |
71.5 | 6.4 | 0.7 | 8.3 | 1.5 | ||||||||||||||||
| Sandvik LH 307. |
160 | 14.4 | 1 | 16.1 | 1.4 | |||||||||||||||||
Source: SRK, 2022
A total of at least 6.4 m3/s must be delivered to the face of a closed end mechanized production stope. In order to achieve the airflow of 6.4 m3/s at the face, as required for a small LHD, a fan pressure of approximately 1.5 kPa will be required with an airflow of approximately 8.3 m3/s (face airflow quantity plus joint leakage and 25% rip leakage).
In order to provide ventilation for a large LHD an airflow of 14.4 m3/s is required at the face, a fan pressure of approximately 1.4 kPa will be required with an airflow of approximately 16.1 m3/s (face airflow quantity plus joint leakage and 25% rip leakage).
|
BP/KD |
May 2022 |
| SRK Consulting (U.S.), Inc. NI 43-101 Technical Report – Segovia 2021 PFS Update |
Page 303 |
| 16.14.5 | Main Fan Summary |
Based on the ventilation modeling, the operating points for the main fans are estimated. A basic summary of the main exhaust fans and booster fans is shown in Table 16-16. The fan installations are shown identified as single, or parallel if two fans operating together can be used.
Table 16-16: Summary of Main Fan Operating Points
| Mine |
Fan |
Location |
Requirements | |||||||||||
| Airflow (m3/s) |
Pressure (kPa) |
Power (kW) |
Installation | |||||||||||
| Providencia | Main Fans | Contra Pozo Exhaust (Existing on Site) | 2 x Howden 5400 VAX 3150 HB (Installed) | |||||||||||
| El Silencio | Main Fans | Alimak Raise Surface Exhaust (Existing on Site) | 2 x Howden 8400 VAX 3150 FB (Installed | |||||||||||
| Booster Fans1 | Booster Fan A | 75 | 2.4 | 275 | Parallel | |||||||||
| Booster Fans1 | Booster Fan B | 50 | 0.4 | 30 | Single (jet) | |||||||||
| Booster Fans1 | Booster Fan C (Existing on Site) | 50 | 0.4 | 30 | Single (installed) | |||||||||
| Sandra K | Main Fans | Exhaust Raise Fan (Existing on Site) | 2 x Howden 5400 VAX-2700 (Installed) | |||||||||||
| Booster Fan | Booster Fan (Existing on Site) | 50 | 0.4 | 30 | Single (installed) | |||||||||
| Carla | Main Exhaust Fans1 | Exhaust Raise Fan | 60 | 0.5 | 1002 | Single | ||||||||
| Dev Booster | Personnel Apique | 30 | 0.5 | 20 | Single | |||||||||
Source: SRK, 2022
Notes: Power based on system efficiency of 75%
1. Required to be procured
2. 30% efficiency based on potential installation losses
| 16.14.6 | Component Costing Information |
The fan and fan housings are often the most expensive components in the ventilation system aside from the development of the actual ventilation raises and dedicated ventilation drifts. The manufacturers contacted included: Advanced Fan (now Howden), ABC, Howden, Spendrup, Clemcorp, and Zitron. Currently the mine uses auxiliary ventilation fans from Zitron and has procured the main surface exhaust fans for the Providencia and El Silencio mines from Howden. The underground booster fans will require a substantial bulkhead for the fan to be mounted in (similar to the Sandra K main fan installation). A double walled concrete block bulkhead should be sufficient for this type of bulkhead. Auxiliary ventilation systems have already been procured and are not included in this study.
| 16.15 | Mine Services |
The primary mine services at the Segovia mines include compressed air systems, apique hoisting systems, electrical power distribution, and ventilation services. The systems are fully developed with ongoing expansion of the systems to support new development. The electrical system and compressed air equipment are discussed in Section 18. Ventilation is discussed in Section 16.14.
| 16.15.1 | Health & Safety |
GCM has a health & safety management team and their program includes the following:
| • | New miner training |
| • | Certification for equipment use |
| • | PPE supply and instruction on use |
| • | Safety refresher courses for existing miners |
|
BP/KD |
May 2022 |
| SRK Consulting (U.S.), Inc. NI 43-101 Technical Report – Segovia 2021 PFS Update |
Page 304 |
| • | Mine rescue team |
| • | Site ambulance and fire equipment |
| • | Tag in/Tag out system for mine egress |
| • | Provide bottled water for miners |
| • | Blasting clearance protocols |
| 16.15.2 | Labor |
Direct Employment
Segovia has 1,700 employees (no contractors are included in this number), 1,382 of which are contracted directly to GCM as their employer, and the remaining 318 workers are contracted though external companies called “Empresas de servicios TEMPORALES” (normally workers have one-year contracts).
Included in the 1,700 employees, are 916 workers (staff & mine workers) who are working as part of the General Mine Management at Providencia, El Silencio, Sandra K, Carla, Planning Department, Geology Department, and Small Mining Department. The remaining 786 work in the Mill, Health and Safety, Security, Finance, Purchases, Lab, and various smaller departments.
GCM operates three eight hour shifts each day, working seven days per week (approximately 360 workdays per year). GCM states that the average underground miner has four to five years’ experience, however there are large numbers of workers with considerably more experience than this.
Contract Labor
Contract labor is composed of two major local mine contractors who carry out the primary and secondary mining. The two major contractors currently operating at GCM’s mines are:
| • | Providencia Mine – Masora |
| • | El Silencio Mine – Navar |
The Masora and Navar contractors mine 35% of the LoM total ore tonnage and provide approximately 41% of the ounces in the current forward looking LoM production schedule presented herein.
There are also multiple smaller contractors (these contracts are based on mining material that has not been included in the Mineral Reserve; however, these contracts have been fulfilled for the last decade)
The remaining 63 contracts have contributed approximately 33% of the contractor-supplied gold ounces (~34k oz) in the past 12 months with Masaro and Navar contributing the remainder.
The contractors are paid a percentage of the value of the recovered gold from the payable material delivered to the plant. The gold content is determined by assaying (verified independently by SGS laboratories) the RoM as it is supplied. A new assay facility is being constructed at the plant site to assist with this process.
Typically, these contracts are renewed annually for one-year terms. The total contract labor for all mines is approximately 1,500 miners.
Currently, GCM currently pays approximately US$676.50/oz of recovered gold, which is approximately 41% of the gold price, to the two largest contactor miners (Navar and Masora). The contractors are responsible for supplying and maintaining all required equipment.
|
BP/KD |
May 2022 |
| SRK Consulting (U.S.), Inc. NI 43-101 Technical Report – Segovia 2021 PFS Update |
Page 305 |
GCM directly employs a team, currently comprised of approximately 36 employees, who coordinate and direct the operations of the contractors. This team conducts visits and audits of the various contractors operating within GCM’ mines to verify compliance with GCM’ health, safety, environmental and administrative policies, to verify that they are working in designated areas in compliance with technical specifications, and to verify compliance with GCM’ protocols for obtaining explosives permits and the appropriate use and storage of explosives within the mines.
Although the Company does provide an indicative schedule for production, listing production tonnage and grade, the key measurable for the contractors’ payments is gold content. As the contract labor is able to determine its own pillar extraction sequence, the priority is on mining only the high-grade pillars where the physical work required to meet the monthly production targets can be minimized. GCM has been working to limit contractors to certain areas of a mine to allow for tighter controls in owner mining areas.
Pillars are sampled and lab assayed to determine those with the highest grade; however, the association between gold and sulfides in the quartz vein means it is relatively simple to determine visually which pillars these might be. The resulting pillar extraction sequence is therefore not optimized for geotechnical reasons. GCM stated its intention on changing the current system to create a more predictable extraction sequence, however, there is uncertainty over the limitations that could result from the existing work contracts; mainly because a percentage of the workers’ payment is proportional to extracted ore grade.
The current nature of the contractors’ operations reduces the planning requirements for GCM; however, it presents the following operational risks:
| • | Lack of control over sequencing of pillar extraction, potentially resulting in sterilization of some areas due to geotechnical reasons |
| • | Difficulty in reconciling production versus plan |
| • | Safety risks as poor sequencing may result in roof and/or pillar failure |
| • | Lack of clarity over accountability in the event of serious injury or death in a Company operated mine |
| • | Difficulty in determining resource grade and tonnage as there is no survey of total of mined pillars. At this moment GCM only can accurately measure reserves located in the main area of the contractor at El Silencio Mine. |
| • | Potential for undetected gold theft |
As noted, GCM employs a team to coordinate and direct the operations of the contractors and is in the process of implementing additional resources and procedures to reduce the risks associated with the contractors operating within its mines.
| 16.15.3 | Mobile Equipment |
The PFS design incorporates additional equipment to support additional development and to further mechanize production in the cut and fill mining areas. The existing diesel operated mobile equipment list, provided by GCM, is shown in Table 16-17.
GCM has a large number of track and air powered overshot muckers and jackleg style drills that are used for general production as well as air and electric slushers. Primary haulage on the levels is by
|
BP/KD |
May 2022 |
| SRK Consulting (U.S.), Inc. NI 43-101 Technical Report – Segovia 2021 PFS Update |
Page 306 |
battery operated locomotives that move rail cars with ore, waste, and supplies along the various levels of the mine.
Table 16-17: Mobile Equipment by Mine Area
| Location | Description | Engine Type | Power (HP) |
Existing | ||||||||||
| El Silencio | Scoop Sandvik LH203 (2,2 yd3) | BF6L914 SERIE 0888275 | 112 | 1 | ||||||||||
| Scoop sandvik LH307 (3,5 yd3) | Volvo TAD850VE 160 Kw 214.5 H @ 2200 rpm Tier 3 | 214.5 | 1 | |||||||||||
| Volqueta Aramyne T1601C | CUMMINS QSB 6.7 164 KW | 220 | 1 | |||||||||||
| Dumper Sandvik TH315 (15 ton) | QUMMINS QSB 6.7 | 220 | 2 | |||||||||||
| Jumbo Sandvik DD210 | Deutz D914L04 55 Kw 73.75 HP Tier 3 | 73.75 | 1 | |||||||||||
| Jumbo N°3 MUKI | Deutz F6L914 89 KW | 119.35 | 1 | |||||||||||
| MiniCargador N°6 BOBCAT SD 50 | Motor Kubota / V2403_Modelo | 49 | 1 | |||||||||||
| Utilitario Toyota Hilux | TOYOTA 2.4 DIESEL 2GD | 160 | 2 | |||||||||||
| Providencia | Scoop MTI LT210 (1,25 yd3) | BF6M1013EC (electric) | 210 | 1 | ||||||||||
| Scoop Sandvik LH203 (2,2 yd3) | BF6L914 SERIE 0888275 | 112 | 2 | |||||||||||
| Scoop N°12 ST2G (2,2 yd3) | Cummins QSB 4.5, EPA Tier 3 | 109 | 1 | |||||||||||
| Dumper N°1 YMC T7 (7 ton) | D914 L06 SERIE 08868175 | 86.5 | 3 | |||||||||||
| Dumper JOY Komatsu T7 (7 ton) | BF4L914 DEUTZ 72 KW | 96 | 2 | |||||||||||
| Jumbo N°2 DD210 | Deutz D914L04 55 Kw 73.75 HP Tier 3 | 73.75 | 1 | |||||||||||
| MiniCargador N°4 BOBCAT SD 50 | Motor Kubota / V2403_Modelo | 49 | 1 | |||||||||||
| Utilitario Toyota Hilux | TOYOTA 2.4 DIESEL 2GD | 160 | 2 | |||||||||||
| Sandra K | Scoop N°4 MTI ELT210 (1,25 yd3) Eléctrico | BF6M1013EC (electric) | 210 | 2 | ||||||||||
| Scoop N°6 MTI LT210 (1,2 yd3) Diesel | D914L04 SERIE 08875206 | 55 | 1 | |||||||||||
| Scoop N°11 LH307 (3,5 yd3) | Volvo TAD850VE 160 Kw 214.5 HP @ 2200 rpm Tier 3 | 214.5 | 1 | |||||||||||
| Dumper N°10 T16 ( 16 ton) (abril) | CUMMINS QSB 6.7 164 KW | 220 | 1 | |||||||||||
| Jumbo N°4 DD210 | Deutz D914L04 55 Kw 73.75 HP Tier 3 | 73.75 | 1 | |||||||||||
| MiniCargador N°5 BOBCAT SD 50 | Motor Kubota / V2403_Modelo | 49 | 1 | |||||||||||
Source: SRK, 2021
|
BP/KD |
May 2022 |
| SRK Consulting (U.S.), Inc. NI 43-101 Technical Report – Segovia 2021 PFS Update |
Page 307 |
| 17 | Recovery Methods |
| 17.1 | Processing Methods |
GCM processes ore in its 1,500 t/d Maria Dama process plant from the Providencia, El Silencio Sandra K Mines and Carla mines, in addition to mineral from small mining units. The Maria Dama process plant includes crushing, grinding, gravity concentration, gold flotation, cyanidation of the flotation concentrate, Merrill-Crowe precipitation and refining of both the Merrill-Crowe precipitate and gravity concentrate to produce a final doré. Hydrogen peroxide is used for cyanide detoxification. The process flowsheet is shown in Figure 17-1 and a list of major equipment is shown in Table 17-2. A general arrangement drawing is displayed in Figure 17-2.
GCM is expanding the capacity of Maria Dama process plant and expects to be able to process ore at the rate of 2,000 tpd by July 2022. The plant expansion includes:
| • | Expansion of the ore stockpile area and upgrades to the crushing circuit designed to increase crushing capacity from 70 to 150 t/h. |
| • | Installation of a new 40 m3 tank flotation cell to the rougher flotation circuit to provide the required additional flotation capacity and retention time. |
| • | Installation of a new Merrill-Crowe circuit for recovery of gold from the leach solution using conventional zinc precipitation technology. |
| • | Replacement of the old thickeners in the counter-current-decantation (CCD) circuit with new thickeners that will allow for improved washing efficiency and reduction of soluble gold losses to the final tailings. |
| • | Upgrading the process water distribution system |
| • | Installation of a second tailings pressure filter at the El Chocho dry stack TSF. The inclusion of a second higher capacity will supplement the current pressure filter and provide redundancy to assure that tailings can be filtered at the new design capacity. |
The plant expansion if budgeted at a cost of US$9.57 million as summarized below:
Table 17-1: Plant Expansion Costs (US$)
| Cost Area | US$ Million | |||
|
|
Second tailings pressure filter: |
4.16 | ||
|
Ore stockpile and crusher upgrade: |
3.96 | |||
| New Merrill-Crowe circuit: |
0.24 | |||
| Process water distribution: |
0.14 | |||
| New thickeners: |
0.76 | |||
| New rougher flotation tank cell: |
0.31 | |||
|
Total: |
9.57 |
|
BP/KD |
May 2022 |
| SRK Consulting (U.S.), Inc. NI 43-101 Technical Report – Segovia 2021 PFS Update |
Page 308 |
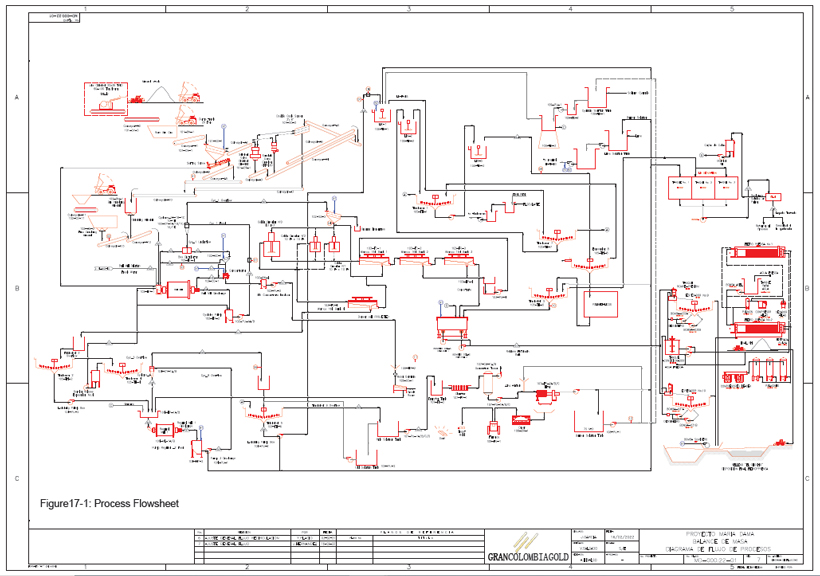
|
BP/KD |
May 2022 |
| SRK Consulting (U.S.), Inc. NI 43-101 Technical Report – Segovia 2021 PFS Update |
Page 309 |
Table 17-2: Segovia Process Plant Major Equipment List
| Equipment | Quantity | Size | HP | Manufacture | ||||||||||||
| Crushing Circuit |
| |||||||||||||||
| Primary Jaw Crusher | 1 | 20” x 36” | 150 | Weir | ||||||||||||
| Secondary Cone Crusher | 1 | 4 ft CH-440 | 300 | Sandvik | ||||||||||||
| Secondary Screen (double deck) |
1 | 1.8 m x 6 m | 30 | Sandvik | ||||||||||||
| Secondary Cone Crusher (extra coarse) |
1 | CH-430 | 200 | Sandvik | ||||||||||||
| Tertiary Cone Crusher | 1 | CH-430 | 200 | Sandvik | ||||||||||||
| Primary Screen (double deck) | 1 | 1.9 m x 4.7 m | 20 | Dismet | ||||||||||||
| Screw classifier | 1 | 16 rpm | 10 | |||||||||||||
| Grinding Circuit |
| |||||||||||||||
| Ball Mill | 1 | 12.5 ft x 23 ft | 1500 | KVS | ||||||||||||
| Cyclone | 3 operating, 3 stand-by | 10” | Cavex 250 | |||||||||||||
| Ludowici Screen | 1 | FlSmith | ||||||||||||||
| Centrifugal Gravity Concentrator |
1 | QS-40 | 7.5 | Knelson | ||||||||||||
| Flotation Circuit |
| |||||||||||||||
| Rougher Flotation KYF40 | 1 | 40m | 3 | 30 | Prominer | |||||||||||
| Scavenger Flotation | 3 | 60 m | 3 | 65-70 | WEMCO | |||||||||||
| Cleaner Flotation | 1 | 60 m | 3 | 65 | CHINA | |||||||||||
| Derrick Screen | 1 | 2 | ||||||||||||||
| Concentrate Regrind |
| |||||||||||||||
| Ball Mill MQGg1224 | 2 | 4 ft x 8 ft | 60 | China | ||||||||||||
| Thickener 2 | 1 | 9m X 3.5m | Denver | |||||||||||||
| Cyclone | 1 operating, 1 stand-by | 6” | Krebs | |||||||||||||
| Concentrate Cyanidation |
| |||||||||||||||
| Thickener 7 | 1 | 24ft X 10ft | ||||||||||||||
| Thickener 1 | 1 | 5m X 3m | ||||||||||||||
| Thickener 8 | 1 | 13m X 3.2m | |
Tenova Delkor |
| |||||||||||
| Pre-leach Thickener 6 | 1 | 45 ft x 10 ft | 5 | |||||||||||||
| Leach Tanks | 1 | 150m | 3 | |||||||||||||
| Leach Tanks | 3 | 25 ft x 30 ft | 40 | |||||||||||||
| Merrill -Crowe |
| |||||||||||||||
| Clarifier | 1 | |||||||||||||||
| Deaeration Tower | 1 operating 1 stand-by | |||||||||||||||
| Precipitate Filter | 1 | |
30-inch x 30-inch
x 30 plates |
|
||||||||||||
| Precipitate Filter | 1 | 39-inch x 39-inch x
21 plates |
||||||||||||||
| Precipitate Filter | 2 | 0.7m X 0.7m | Prominer | |||||||||||||
| Gold Room | ||||||||||||||||
| Gravity Concentrate Gemini Table |
1 | Model MT-1250 | ||||||||||||||
| Furnace | 1 | 38” x 59” | ||||||||||||||
| Drying oven | 1 | |||||||||||||||
| Scrubber | 1 | |||||||||||||||
| Tailings |
| |||||||||||||||
| Slurry Pumps | 3 operative 3 Stand-by | ASH 6X4 | 100 | Weir | ||||||||||||
| Filter GHT2500 F12 | 1 | 3050 mm X 2640 mm | Diemme | |||||||||||||
| Water Tank | 1 | 150m | 3 | |||||||||||||
| Conditioner tank | 1 | 150m | 3 | |||||||||||||
| Filter FPX | 1 | FPX-OM-2000 | Cidelco Perù | |||||||||||||
|
BP/KD |
May 2022 |
| SRK Consulting (U.S.), Inc. NI 43-101 Technical Report – Segovia 2021 PFS Update |
Page 310 |
| Equipment | Quantity | Size | HP | Manufacture | ||||||
|
|
Thickener |
2 |
13HR/100HGL/24F 13X3.2m |
Tenova Delkor | ||||||
|
Power plant and Compressors | ||||||||||
|
Compressor 1 |
1 | Atlas Copco GA 160 | ||||||||
|
Compressor 2 |
1 | Kaeser DSD 238 | ||||||||
| Power Plant SDMO |
1 | 18V 2000 G85 | ||||||||
Source: GCM, 2022
|
BP/KD |
May 2022 |
| SRK Consulting (U.S.), Inc. NI 43-101 Technical Report – Segovia 2021 PFS Update |
Page 311 |
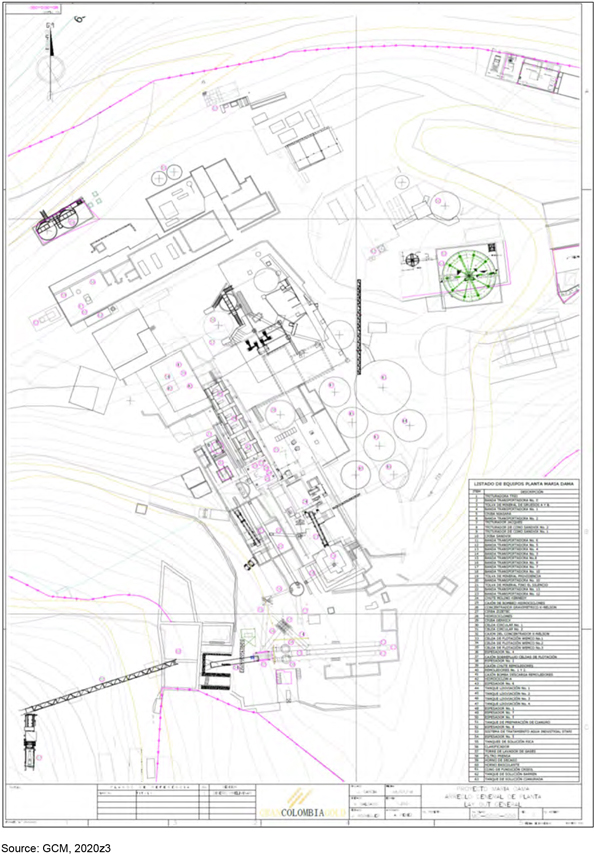
Figure 17-2: Maria Dama General Arrangement Drawing
|
BP/KD |
May 2022 |
| SRK Consulting (U.S.), Inc. NI 43-101 Technical Report – Segovia 2021 PFS Update |
Page 312 |
Run-of-mine (RoM) ore from GCM’s mining operations is crushed to -15 mm in a two-stage crushing circuit that includes a 20 inch x 36-inch primary jaw crusher, which discharges to a RoM ore bin. Primary crushed ore is screened at 15 mm on a 1.9 m x 4.7 m double-deck screen (1 1⁄2 inch top deck and 3⁄4 inch bottom deck) and the screen oversize is conveyed to a 4 ft secondary cone crusher (CH-440 Sandvik), which is operated in closed circuit with a secondary vibrating screen (1.8 m x 6 m). The final 15 mm crushed product is sampled with a primary cross-cut sampler and a secondary rotary sampler as it is conveyed to the fine ore bin. GCM ore samples are assayed by the on-site analytical laboratory. Two Sandvik CH-430 cone crushers serve as backup when the CH-440 crusher is down for maintenance.
Ore delivered to the Maria Dama process plant by the mining contractors is already crushed before it arrives and is dumped into a receiving bin. The contractor ore is sampled with both a primary cross-cut sampler and a secondary rotary sampler as it is conveyed from the receiving bin to a separate fine ore bin. Contractor ore samples are assayed by an outside commercial laboratory (SGS).
| 17.1.1 | Grinding Circuit |
GCM’s and the contractor’s ore are conveyed to a single conveyor belt feeding the grinding circuit, which consists of a 12.5 ft x 23 ft ball mill operated in a closed circuit cluster of Cavex 250 cyclones to produce a final grind of 80% passing 150 µm in the cyclone overflow, which is advanced to the flotation circuit. A portion of the cyclone underflow is diverted to the gravity concentration circuit, which consists of a single QS-40 Knelson centrifugal concentrator, which is operated in closed circuit with the grinding circuit. Approximately 30% of the contained gold is recovered into a primary gravity concentrate, which is further upgraded in the refinery on a Gemini table. Feed to the grinding circuit is continuously weighed on a belt-scale and hand-sampled every hour.
| 17.1.2 | Flotation and Regrind Circuit |
Cyclone overflow from the grinding circuit advances to the flotation circuit where it is first conditioned with the flotation reagents. Conditioned slurry is then subjected to one stage of rougher flotation in a 40 m3 tank cell manufactured by Prominer and three stages of scavenger flotation in a bank of three 30 m3 WEMCO flotation cells and finally one cleaner cell to recover the contained gold values. Rougher/scavenger flotation concentrate is upgraded in one stage of cleaner flotation and combined with the rougher flotation concentrate. The combined rougher/scavenger cleaner concentrate, which represents about 7 wt% of the plant feed is thickened to about 55% solids (w/w) and reground in a 4 ft x 8 ft ball mill to approximately 80% passing 45 µm prior to being advanced to the cyanidation circuit. The regrind ball mill is operated in closed circuit with 6-inch Krebs cyclones.
| 17.1.3 | Cyanidation and Counter-Current-Decantation (CCD) Circuit |
The reground flotation concentrate is thickened and then processed through a conventional cyanidation circuit consisting of four agitated leach tanks operated in series to provide a total leach retention time of about 96 hours. The cyanide concentration is adjusted to 450 ppm NaCN in the first leach tank and is allowed to naturally attenuate to about 200 ppm NaCN in the last leach tank. The pH of the leach slurry is maintained at about 10.5 to 11 with lime.
|
BP/KD |
May 2022 |
| SRK Consulting (U.S.), Inc. NI 43-101 Technical Report – Segovia 2021 PFS Update |
Page 313 |
Discharge from the fourth agitated leach tank flows to the CCD circuit, which consists of two 24 ft diameter thickeners and one 42 ft diameter thickener and serves to wash the pregnant leach solution (PLS) from the leach residue. The PLS from the first thickener overflow is advanced to the Merrill Crowe gold recovery circuit and the thickener underflow from the third thickener is discharged to the TSF.
| 17.1.4 | Merrill-Crowe and Refining |
The PLS is processed in the Merrill Crowe circuit to recover the solubilized gold and silver values from solution. This is accomplished by clarifying the PLS to remove any remaining suspended solids, de-aerating the solution to less than 1 ppm dissolved oxygen and then precipitating the gold and silver values by the addition of zinc dust. The resulting gold and silver precipitate is recovered in three plate and frame pressure filters. The gold and silver precipitate is smelted using a flux with the following composition:
|
|
• Precipitate |
|||||
|
○ Borax: |
40% | |||||
|
○ Sodium Nitrate: |
30% | |||||
|
○ Soda Ash: |
15% | |||||
|
○ Silica: |
3% | |||||
Approximately 650 kg of flux is blended with 600 kg of precipitate and smelted in a gas-fired furnace to produce a final doré product. The gravity concentrate produced from the Gemini table located in the refinery is directly smelted using the following flux formula in which flux is added in the ratio of two-parts flux to one-part gravity concentrate:
|
|
• Gravity Concentrate | |||||
|
○ Borax: |
40% | |||||
|
○ Sodium Nitrate: |
30 to 33% | |||||
|
○ Soda Ash: |
7.5% | |||||
|
○ Silica: |
6% | |||||
| 17.1.5 | Tailings |
Final leached tailings from the CCD circuit are detoxified with hydrogen peroxide and then pumped to lined dewatering cells identified as Bascula, Bolivia-1, Bolivia-2 and Bolivia-3. Effluent from the dewatering cells is then recycled back to the process plant. Flotation tailings are pumped to the El Chocho TSF where they are thickened and filtered to about 15% moisture prior to dry stack placement at the TSF. Thickener overflow and filtrate solutions are recycled back from the TSF to the process plant. A detailed discussion of tailings management is provided in Section 18.2.
| 17.2 | Production Performance |
| 17.2.1 | Historical Plant Production |
Historical plant production for the period from 2002 to 2018 is summarized in Table 17-3. During this period ore tonnes processed increased from 168,220 t (average 460 t/d) to 369,836 (average 1,013 t/d) and gold production increased from 42,692 to 192,953 oz.
|
BP/KD |
May 2022 |
| SRK Consulting (U.S.), Inc. NI 43-101 Technical Report – Segovia 2021 PFS Update |
Page 314 |
Table 17-3: Historic Production Summary
| Year | Ore Tonnes | Grade Au (g/t) | Au Produced (oz) | |||||
| 2002 | 168,220 | 7.8 | 42,692 | |||||
| 2003 | 144,141 | 9.2 | 37,830 | |||||
| 2004 | 158,304 | 10.1 | 48,871 | |||||
| 2005 | 178,528 | 9.6 | 49,677 | |||||
| 2006 | 202,168 | 9.4 | 52,290 | |||||
| 2007 | 218,963 | 5.8 | 38,244 | |||||
| 2008 | 185,816 | 5.6 | 33,460 | |||||
| 2009 | 175,230 | 10.9 | 55,126 | |||||
| 2010 | 149,214 | 9.8 | 50,313 | |||||
| 2011 | 173,684 | 6.0 | 69,179 | |||||
| 2012 | 260,806 | 11.0 | 79,177 | |||||
| 2014 | 237,740 | 10.6 | 75,506 | |||||
| 2015 | 211,049 | 14.3 | 92,894 | |||||
| 2016 | 284,896 | 13.8 | 126,261 | |||||
| 2017 | 293,395 | 16.9 | 149,037 | |||||
| 2018 | 369,836 | 16.9 | 192,953 |
Source: SRK, 2021
| 17.2.2 | Current Plant Production |
Plant production for the period 2019 to 2021 is summarized in Table 17-4. During this period ore tonnes processed increased from 451,450 t at an average gold grade of 15.48 g/t Au in 2019 to 556,219 t at an average gold grade of 12.21 g/t Au in 2021. Gold production decreased from 214,036 oz to 206,693 oz with gold recoveries that ranged from 94.7 to 95.6% over this period. Reported gold recovery is based on actual refinery gold production. Although silver occurs in the ore, silver recovery is not monitored.
Table 17-4: Summary of Maria Dama Process Plant Production (2019 to 2021)
|
|
Parameter |
2019 | 2020 | 2021 | ||||
| Plant Feed | ||||||||
| Ore tonnes |
451,450 | 468,597 | 556,219 | |||||
| Average tonnes/day (1) |
1,257 | 1,284 | 1,524 | |||||
| Au grade (g/t) |
15.48 | 13.63 | 12.21 | |||||
| Contained Au (Oz) |
224,714 | 205,338 | 218,290 | |||||
| Plant Tailing | ||||||||
| Au (g/t) |
0.74 | 0.60 | 0.65 | |||||
| Contained Au (Oz) |
10,678 | 9,008 | 11,597 | |||||
| Au Production |
||||||||
| Refinery Au Oz produced (2) |
214,036 | 196,329 | 206,693 | |||||
| Au Recovery (%) |
95.2 | 95.6 | 94.7 | |||||
Source: GCM, 2022
Notes:
| 1. | 365-day basis |
| 2. | Net of inventory |
| 17.3 | Process Plant Consumables |
Reagent and grinding media consumption for 2018 to 2021 are summarized in Table 17-5. Reagent usage and consumption are typical of and in the same range as other similar process plants.
|
BP/KD |
May 2022 |
| SRK Consulting (U.S.), Inc. NI 43-101 Technical Report – Segovia 2021 PFS Update |
Page 315 |
Table 17-5: Process Plant Reagent and Grinding Media Usage
| Consumable | Function | 2018 (g/t ore) | 2019 (g/t ore) | 2020 (g/t ore) | 2021 (g/t ore) | |||||||||||||||
|
|
Flotation Reagents |
| ||||||||||||||||||
| Copper Sulfate |
Mineral Activator |
20 | 19 | 17 | 15 | |||||||||||||||
| Aerofroth A65 |
Frother |
19 | 16 | 12 | 10 | |||||||||||||||
| MX5160 |
Collector |
11 | 10 | 10 | 9 | |||||||||||||||
| Isopropyl Xanthate |
Collector |
34 | 34 | 36 | 33 | |||||||||||||||
| Aero 404 |
Collector |
12 | 11 | 10 | 11 | |||||||||||||||
| Thickening Circuit |
| |||||||||||||||||||
| Hengfloc |
Flocculant |
3 | 3 | 4 | 4 | |||||||||||||||
| Nalco 9901 |
Flocculant |
5.1 | 23 | 28 | 27 | |||||||||||||||
| Cyanidation Circuit |
| |||||||||||||||||||
| Sodium Cyanide |
Lixiviant |
493 | 360 | 327 | 318 | |||||||||||||||
| Lime |
Ph Control |
363 | 260 | 275 | 218 | |||||||||||||||
| Merrill-Crowe |
| |||||||||||||||||||
| Zinc Dust |
Precipitant |
33 | 20 | 17 | 15 | |||||||||||||||
| Cyanide Detoxification |
|
|||||||||||||||||||
| Hydrogen Peroxide |
Oxidant |
641 | 300 | 233 | 175 | |||||||||||||||
| Refinery |
| |||||||||||||||||||
| Borax |
Flux |
32 | 26 | 25 | 25 | |||||||||||||||
| Soda Ash |
Flux |
11 | 9 | 8 | 7 | |||||||||||||||
| Sodium Nitrate |
Flux |
24 | 20 | 20 | 18 | |||||||||||||||
| Silica |
Flux |
24 | 20 | 18 | 16 | |||||||||||||||
| Lead Acetate |
Flux |
1 | 2 | 3 | 2 | |||||||||||||||
| Grinding Balls |
| |||||||||||||||||||
| 3” |
Primary |
1,551 | 1,538 | 842 | 967 | |||||||||||||||
| 2.5” |
100 | 645 | 716 | |||||||||||||||||
| 1” |
Regrind |
21 | 50 | 37 | 40 | |||||||||||||||
| General |
| |||||||||||||||||||
| Hydrochloric Acid |
Acid |
4 | 5 | 2 | 3 | |||||||||||||||
| Caustic Soda |
Base |
3 | 4 | 5 | 3 | |||||||||||||||
| Antifoam |
Foam Dispersant |
6 | 7 | 7 | 8 | |||||||||||||||
| Nitric Acid |
Acid |
15 | 13 | 13 | 16 | |||||||||||||||
| Iron Sulfate |
11 | 56 | 59 | 50 | ||||||||||||||||
Source: GCM, 2022
| 17.4 | Process Plant Operating Costs |
Process plant cash operating costs for 2020 and 2021 are summarized in Table 17-6. During 2020, plant operating costs averaged US$25.34/t, which was equivalent to US$60.49/Au oz produced. During 2021, process plant operating costs averaged US$25.30/t, which was equivalent to US$68.09/Au oz produced. The major cost drivers in 2021 included labor (13%), electrical power (21%), consumables (19%), maintenance (27%) and freight (7%).
|
BP/KD |
May 2022 |
| SRK Consulting (U.S.), Inc. NI 43-101 Technical Report – Segovia 2021 PFS Update |
Page 316 |
Table 17-6: Maria Dama Process Plant Operating Costs (2020 and 2021)
| Cost Area | 2020 | 2021 | Percent | |||||||||||||||||||||||||||||||||||||
| COP | US$ | US$/t | US$/Au OZ | Percent | COP | US$ | US$/t | US$/Au Oz | ||||||||||||||||||||||||||||||||
| Labor |
5,282,153,231 | 1,436,148 | 3.06 | 7.32 | 12.1 | 6,428,502,058 | 1,717,014 | 3.09 | 8.31 | 12.2 | ||||||||||||||||||||||||||||||
|
|
Management |
640,338,226 | 174,100 | 0.37 | 0.89 | 1.5 | 602,578,587 | 160,945 | 0.29 | 0.78 | 1.1 | |||||||||||||||||||||||||||||
| Logistics |
952,799,252 | 259,054 | 0.55 | 1.32 | 2.2 | 1,140,250,786 | 304,554 | 0.55 | 1.47 | 2.2 | ||||||||||||||||||||||||||||||
| Electrical Power |
9,337,674,938 | 2,538,791 | 5.42 | 12.93 | 21.4 | 10,829,382,737 | 2,892,463 | 5.20 | 13.99 | 20.6 | ||||||||||||||||||||||||||||||
| Reagents and Consumables |
6,989,996,057 | 1,900,488 | 4.06 | 9.68 | 16.0 | 10,056,414,745 | 2,686,008 | 4.83 | 13.00 | 19.1 | ||||||||||||||||||||||||||||||
| Freight |
3,544,496,439 | 963,702 | 2.06 | 4.91 | 8.1 | 3,852,655,718 | 1,029,021 | 1.85 | 4.98 | 7.3 | ||||||||||||||||||||||||||||||
| Maintenance |
10,980,481,139 | 2,985,449 | 6.37 | 15.21 | 25.1 | 14,042,874,720 | 3,750,768 | 6.74 | 18.15 | 26.7 | ||||||||||||||||||||||||||||||
| Minor Repairs |
3,609,715,078 | 981,434 | 2.09 | 5.00 | 8.3 | 4,830,377,947 | 1,290,165 | 2.32 | 6.24 | 9.2 | ||||||||||||||||||||||||||||||
| Other |
2,343,828,144 | 637,256 | 1.36 | 3.25 | 5.4 | 909,711,320 | 242,978 | 0.44 | 1.18 | 1.7 | ||||||||||||||||||||||||||||||
| Total |
43,681,482,504 | 11,876,423 | 25.34 | 60.49 | 100.0 | 52,692,748,618 | 14,073,918 | 25.30 | 68.09 | 100.0 | ||||||||||||||||||||||||||||||
| Exchange Rate (COP:US$) |
3,678 | 3,744 | ||||||||||||||||||||||||||||||||||||||
| Ore Tonnes |
468,597 | 556,219 | ||||||||||||||||||||||||||||||||||||||
| Au Ounces Produced |
196,329 | 206,693 | ||||||||||||||||||||||||||||||||||||||
Source: GCM, 2022
|
BP/KD |
May 2022 |
| SRK Consulting (U.S.), Inc. NI 43-101 Technical Report – Segovia 2021 PFS Update |
Page 317 |
| 18 | Project Infrastructure |
| 18.1 | Infrastructure and Logistic Requirements |
| 18.1.1 | Access, Airports, and Local Communities |
Segovia is an active mining project with the majority of the infrastructure required for its ongoing operation already in place. The Project is located in north central Colombia approximately 200 km northeast of Medellín. Figure 18-1 shows the general location.
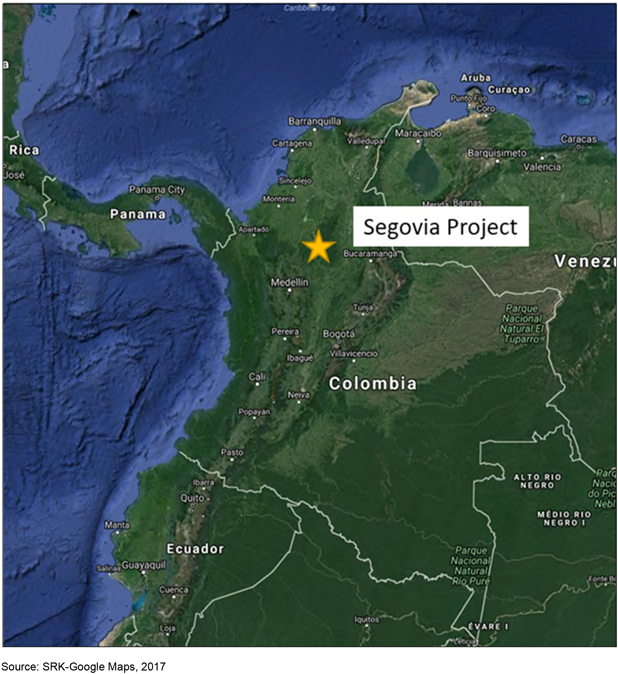
Figure 18-1: General Location
|
BP/KD |
May 2022 |
| SRK Consulting (U.S.), Inc. NI 43-101 Technical Report – Segovia 2021 PFS Update |
Page 318 |
Medellín (population approximately 2.5 million) is the capital of the Department of Antioquia. The Project is close to the communities of Remedios (population approximately 8,100), Segovia (population approximately 40,000), and the small community of La Cruzada (population approximately 2,700). The communities have supported the mining industry in the area for well over 50 years with the history of mining in the area dating back to the mid-1800s. Approximately 1,300 employees live in the area. Some employees live as members of the communities and others in Company supplied housing (approximately 230 houses) in the communities. GCM provides a cafeteria in the area of the Company owned housing. GCM also operates a main camp that includes a restaurant, pool (billiards), and training area. A contractor, Duflo, operates the facilities for GCM.
Access to the Segovia/Remedios area is four hours by paved highway from Medellín. The route can be seen in Figure 18-2. From the communities to the mine, access is by dirt road and the distance is quite short.
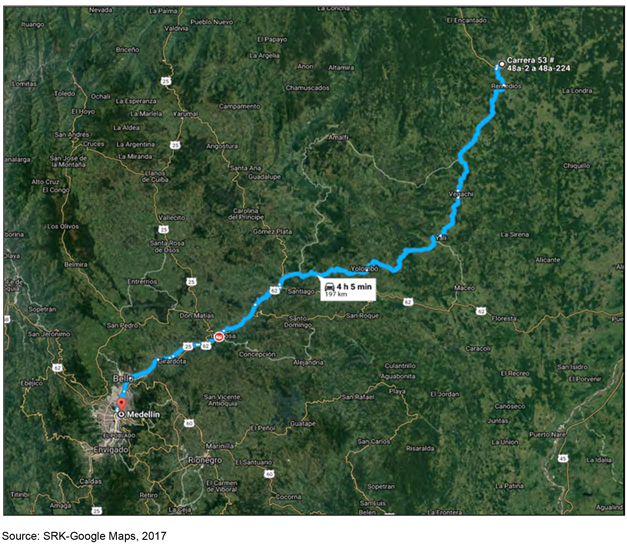
Figure 18-2: Project Access
The shops/facilities are located near the mine portals and the Maria Dama mill site. Figure 18-3 shows the proximity of the mines and mill to the communities.
|
BP/KD |
May 2022 |
| SRK Consulting (U.S.), Inc. NI 43-101 Technical Report – Segovia 2021 PFS Update |
Page 319 |
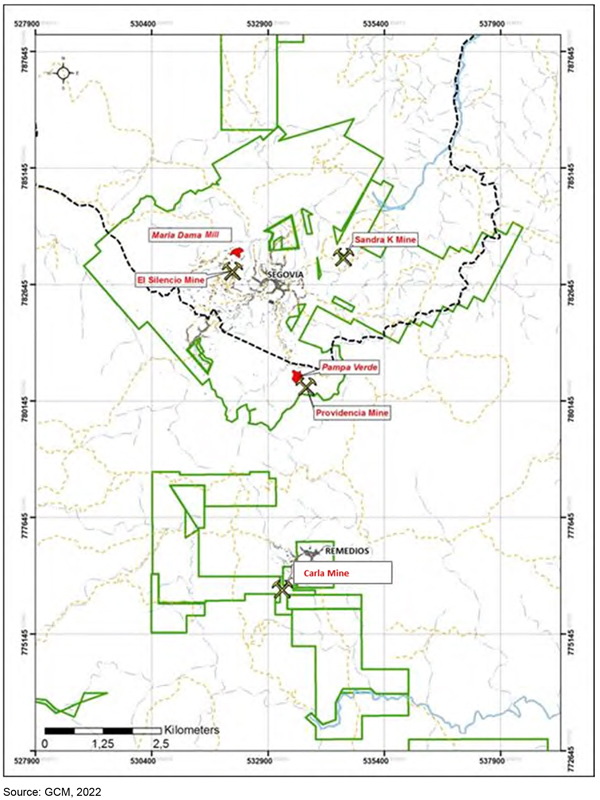
Figure 18-3: Site Map
|
BP/KD |
May 2022 |
| SRK Consulting (U.S.), Inc. NI 43-101 Technical Report – Segovia 2021 PFS Update |
Page 320 |
Air access is by a 30-minute commercial flight from Medellín to Otú, 15 km south of Segovia, which has an asphalt-surfaced airstrip. From Otú, it is a 20-minute drive to Segovia via the towns of Remedios and La Cruzada. A major international airport is located in Medellín.
| 18.1.2 | Facilities |
The primary facilities that are associated with the Segovia site are the Maria Dama plant, the El Silencio Mine, the Providencia Mine, the Sandra K Mine, and the Carla Mine. The Segovia site also has a partially constructed processing facility, Pampa Verde that is not used and not planned for use in the LoM plan. An additional key facility is the El Chocho tailings facility. A general facilities listing is as follows:
| • | Powder and primer magazines storage |
| • | Shops |
| • | Geology core shack and principal geology office near Bolivia apique |
| • | Third-party (SGS) laboratory |
| • | Water treatment plant |
| • | Warehouses |
| • | Compressor buildings |
| • | Welding shops |
| • | Contractor shops (where contract miners are utilized) |
| • | Waste disposal faculties |
| • | Entry guard shack plus multiple guard houses on the perimeter fence line |
| • | Ventilation system surface fans |
| • | Substations and electrical distribution systems |
| • | Backup generators |
| • | Fuel and oil storage tanks |
| • | Water storage tanks (service water) |
| • | Potable water treatment system |
| • | Waste rock storage facilities |
| • | Change houses |
| • | Mine portals and apique headframes by site |
| • | Maintenance and operations offices |
| • | Lamp rooms |
| • | Tailings storage facilities (El Chocho) |
| • | Maria Dama processing plant |
| • | Polymetallic plant (2021 construction) |
| • | Control station and ore truck scales for weighing the trucks entering the processing plant. |
The facility layouts are shown in Figure 18-4 through Figure 18-8.
|
BP/KD |
May 2022 |
| SRK Consulting (U.S.), Inc. NI 43-101 Technical Report – Segovia 2021 PFS Update |
Page 321 |
Figure 18-4: Maria Dama Plant Facilities
|
BP/KD |
May 2022 |
| SRK Consulting (U.S.), Inc. NI 43-101 Technical Report – Segovia 2021 PFS Update |
Page 322 |
Figure 18-5: El Silencio Facilities
|
BP/KD |
May 2022 |
| SRK Consulting (U.S.), Inc. NI 43-101 Technical Report – Segovia 2021 PFS Update |
Page 323 |
Figure 18-6: Providencia Mine Facilities
|
BP/KD |
May 2022 |
| SRK Consulting (U.S.), Inc. NI 43-101 Technical Report – Segovia 2021 PFS Update |
Page 324 |
Figure 18-7: Sandra K Facilities
|
BP/KD |
May 2022 |
| SRK Consulting (U.S.), Inc. NI 43-101 Technical Report – Segovia 2021 PFS Update |
Page 325 |
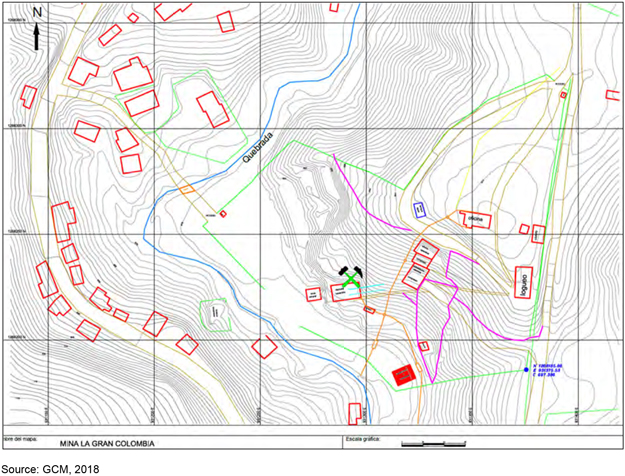
Figure 18-8: Carla Facilities
| 18.1.3 | Compressed Air Systems |
A substantial compressed air system is present at each mine site to support mining activities. A compressed air system is also present at the processing facility.
Table 18-1 provides a summary of the compressors by mine site.
Table 18-1: Compressors Listing for Operating Mines
|
|
Location |
ID |
Compressor Manufacturer |
HP |
CFM |
|||||||||
| 1 |
Ingersoll Rand |
300 | 1,363 | |||||||||||
| 2 |
Ingersoll Rand |
300 | 1,363 | |||||||||||
| 3 |
Atlas Copco |
200 | 987 | |||||||||||
| El Silencio |
4 |
Kaeser |
175 | 850 | ||||||||||
| 5 |
Kaeser |
250 | 1,052 | |||||||||||
| 6 |
Kaeser |
75 | 345 | |||||||||||
| 7 |
Kaeser |
175 | 882 | |||||||||||
| 1 |
Atlas Copco |
125 | 545 | |||||||||||
| Sandra K |
2 |
Atlas Copco |
75 | 320 | ||||||||||
| 3 |
Kaeser |
75 | 345 | |||||||||||
| 4 |
Kaeser |
175 | 882 | |||||||||||
| Providencia |
1 |
Ingersoll Rand |
250 | 1,249 | ||||||||||
| 2 |
Ingersoll Rand |
250 | 1,249 |
|
BP/KD |
May 2022 |
| SRK Consulting (U.S.), Inc. NI 43-101 Technical Report – Segovia 2021 PFS Update |
Page 326 |
| Location | ID | Compressor Manufacturer | HP | CFM | ||||||||||
|
|
3 | Atlas Copco | 125 | 545 | ||||||||||
| 4 | Atlas Copco | 200 | 987 | |||||||||||
| 5 | Kaeser | 175 | 882 | |||||||||||
| 1 | Ingersoll Rand | 250 | 1,249 | |||||||||||
| 2 | Ingersoll Rand | 250 | 1,249 | |||||||||||
| Carla | 3 | Atlas Copco | 125 | 545 | ||||||||||
| 4 | Atlas Copco | 200 | 987 | |||||||||||
| 5 | Kaeser | 175 | 882 |
Sources: SRK/GCM, 2021
Figure 18-9 shows the compressor room at Sandra K and the three compressors and backup generators.
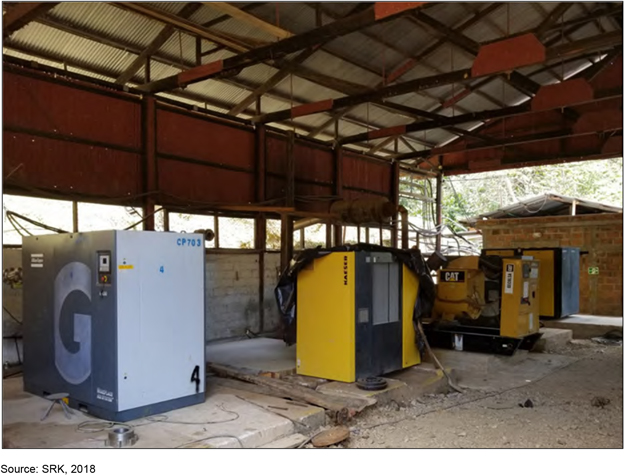
Figure 18-9: Compressor Room at Sandra K
| 18.1.4 | Diesel Supply and Storage |
Fuel is supplied by Terpel, who provides the contracted supply from Medellín directly to the mine and mill where the fuel is stored in tanks at each site. Diesel deliveries are typically in 30,000-liter trucks. There are two tanks that hold a total of 850-gallons at both El Silencio and at Providencia. Diesel tanks are filled every two days at El Silencio and every three days at Providencia. Fuel can be obtained locally through either Terpel or Zeus filling stations.
|
BP/KD |
May 2022 |
| SRK Consulting (U.S.), Inc. NI 43-101 Technical Report – Segovia 2021 PFS Update |
Page 327 |
| 18.1.5 | Natural Gas and Propane Supply |
The site uses propane for miscellaneous heating processes site wide, but primarily at the lab refining furnace. Propane is supplied by Vidagas, a local company that receives propane from Medellín. Natural gas is not used at Segovia.
| 18.1.6 | Power Supply and Distribution |
Power is supplied through two sources. The first power supply is provided from the national grid through a 13.2 kV powerline to the Company substations at the mill location and mine locations. The power is supplied by EPM. EPM is a major utility that in addition to power, supplies natural gas and water. EPM supplies about 20% of Colombia’s power.
The Company also has contracts with a secondary supplier, Proveniente de Central Dona Teresa (PCH), that is a smaller independent producer that operates the 8.5 MW Doña Teresa hydroelectric project approximately 20 km from the Segovia site. Before November 2014, PCH was owned by GCM. The facility was constructed in the 1930s by FGM, with poor performance. The poor performance of the PCH facility provided impetus for GCM to contract with EPM. The power is transmitted through a 44-kV power line to the site. PCH began delivering power in November of 2017 and continues today. PCH delivered 20.5 M kWh in 2019. The consumption was split with 66% at El Silencio, 22% at Providencia, 12% at Sandra K.
Figure 18-10 shows the one-line electrical diagram of the power system at the Segovia mine and the two separate feeds providing power to the Project. GCM plans in the future to create a fully looped system to establish full redundancy. The Company has detailed records on power outages since contracting with EPM in November 2014. The power in the early producing years was very unreliable but has improved over time, although backup generation is still required. The reliability has been much improved in recent years with minimal down time due to electrical power loss. Even with the dual power supply system, backup generation is still required due to transmission lines from both power sources being affected by weather conditions.
The Company has backup generation available to support the main lines if needed. The backup generation includes the following diesel plants:
| • | Two 900 kilowatt (kW) gensets at El Silencio |
| • | One 1200 kW genset and one 750 kW genset at Maria Dama |
| • | One 400 kW genset at Sandra K |
| • | One 1200 kW genset at Providencia |
|
BP/KD |
May 2022 |
| SRK Consulting (U.S.), Inc. NI 43-101 Technical Report – Segovia 2021 PFS Update |
Page 328 |
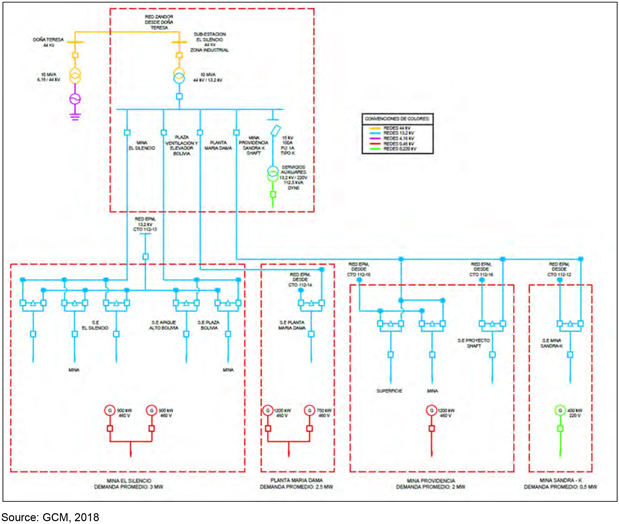
Figure 18-10: Segovia One-Line Electrical Schematic
A more detailed discussion on the power system follows by site.
Providence Mine
| • | The mine has several surface substations including a 1,500 kilovolt ampere (kVA) substation (in three 500 kVA transformers), Transfer equipment is currently being installed for the interconnection with the PCH and EPM systems with which GCM supplies compressors, crushers, hoist equipment and ventilation among other loads. GCM also has another surface substation located near the shaft fan with a 750-kVA transformer. |
| • | Level 4: there are two 500 kVA transformers which feed the pumping systems on Level 4 as well as the mine loads of this level. |
| • | Within Level 6: there is one 500 kVA transformer that feeds the pumping system on level 7 as well as the mine loads on this level. |
| • | Level 8: the main substation has 750 kVA and 500 kVA transformers as this is where power is concentrated to distribute to all the medium voltage loads that supply the smaller substations at locations underground in the mine. Additionally, there is a separate transformer that feeds |
|
BP/KD |
May 2022 |
| SRK Consulting (U.S.), Inc. NI 43-101 Technical Report – Segovia 2021 PFS Update |
Page 329 |
| pumps on Levels 7, 8, 8 1⁄2, and 9, as well as hoists on apique 3660, apique 3860 and mine loads on Level 9 and 10. |
| • | A 500-kVA substation on Level 10 feeds fans, pumps and other equipment on Levels 10 and 11. |
| • | On Level 12 there is a 1,000-kVA system with two 500 kVA transformers. It currently feeds all the electro diesel equipment, pumps, fans and other electrical requirements from the ramp from this level downwards. |
El Silencio Mine
| • | There is a 10 MVA substation installed that takes power from PCH. The substation has a 10 MVA transformer with 44 KV input voltages and 13.2 KV outputs which were taken to all the centers of consumption (Providencia, Sandra K, El Silencio and Maria Dama) for interconnection and use by medium voltage transfer. |
| • | For the surface compressors there is a 2 MVA transformer that feeds all the compressors, ore hoist, personnel and all the peripherals of the industrial area. GCM is currently feeding Level 18 with a 1 MVA transformer also installed in this substation. |
| • | Inside the mine the Navar group has a number of substations: |
| ○ | 500 kVA substations on Levels 10, 17, 19, and 23 |
| ○ | Two 450 kVA transformers on Level 28 |
| ○ | 450 kVA transformers on Levels 32, 38 north and 38 south |
| ○ | 450 kVA transformer on Level 38 north and 38 south |
| ○ | 300 kVA transformer Level 28 |
| ○ | 500 kVA transformer Level 43 |
| ○ | These transformers feed all the pumps, hoisting equipment, and fans along with other equipment |
| • | On the Zandor (GCM) near the Bolivia Apique: |
| ○ | 630 kVA transformer on the surface |
| ○ | 500 kVA transformer in the substation at Level 18-Bolivia Apique. |
| ○ | Two 500 kVA transformers in the substation at Level 23 near ramp 1 |
| ○ | 500 kVA transformer and another 300-kVA transformer on Level 21 with a 500-kVA transformer on Level 38 north which feeds the internal lift, mechanized equipment, fans and other equipment |
Sandra K Mine
At the surface substation there are two 500 kVA transformers that feed the compressors, apique hoists, and other services required. Inside the mine on Level 3 there is a substation with 750 kVA and 500 kVA transformers which feeds the hoist, pumps, fans, and other services required.
Carla Mine
The surface substation has two transformers with installed capacities of 512.2 kVA, that feed the compressors, apique hoists, and other services required. The same substation feeds underground portions of the mine including the mine, pumps, fans, and other services required.
|
BP/KD |
May 2022 |
| SRK Consulting (U.S.), Inc. NI 43-101 Technical Report – Segovia 2021 PFS Update |
Page 330 |
| 18.1.7 | Security |
Security at the Project is primarily provided by a contract security company, Fidelity, that provides 24-hour per day security services for all of the GCM Project sites including the administrative facilities, El Silencio, Providencia, Sandra K, and Maria Dama Plant. The security service includes manned fixed guard stations at the various sites plus a roving service that travels throughout the property and local communities around the Project area. Fidelity has approximately 140 people on staff for 24-hour coverage with approximately 46 people at the sites each shift.
| 18.1.8 | Communications |
The Project has several communications systems that are utilized. Handheld two-way radios are used on the surface and underground at El Silencio, Providencia, and Sandra K where a leaky feeder system has been installed. A hardwire telephone system is in use in the mines and plant as well as the administrative areas. A fiber optic internet system is installed to support the Project needs. Video cameras are utilized in certain locations to monitor key systems and secure zones. A facial recognition system has been installed at the Maria Dama plant and is being implemented at Providencia.
| 18.1.9 | Logistics Requirements |
Supplies, equipment, and materials are trucked to the sites via the paved and dirt road. As this is a gold project there are no concentrate shipping constraints. No material logistic limitations impact the Project other than the typical challenges.
| 18.1.10 | Site Water Management |
The management of wastewater in and around waste management facilities and the plant area has historically been a challenge for the Project. At present, GCM unloads the bulk tailings directly to the El Chocho TSF, and the cyanized tailings are temporarily stored in the Bolivia TSFs to assist in managing the water associated with the cyanized tailings. The liquid portions of the Boliva TSFs is pumped to the María Dama plant, where the liquids comingle with the barren solutions from the plant. The combined liquids are then pumped to the industrial wastewater treatment system (STARI) where they are treated and recirculated in María Dama, or if not required for makeup water, discharged maintaining the Colombian water quality standards. The fluids from the El Chocho TSF are recirculated to the María Dama plant.
The El Chocho TSF site has surface water diversions incorporated into the perimeter roadways that will allow storm water to be diverted around the facility.
| 18.1.11 | Water Management |
Operational water for the Maria Dama plant is provided mainly from a freshwater surface storage pond known as La Tupia and supplemented during the dry season using the dewatering water from the underground mine. With the recent start of operations at El Chocho TSF, the TSF water is recycled from the TSF to the Maria Dama plant. Likewise, the waters from the Bolivia TSFs that store cyanized tailings are reincorporated into the Maria Dama plant after detoxification and treatment process in the STARI System. These systems reduce the use of fresh makeup water. All the infrastructure for surface water management has been added since mid-2017 and includes surface water controls that will limit the amount of incidental runoff added to the water that must be managed by the site.
|
BP/KD |
May 2022 |
| SRK Consulting (U.S.), Inc. NI 43-101 Technical Report – Segovia 2021 PFS Update |
Page 331 |
Recent effort appears to be directed toward storm water management and the prevention of contact with mine equipment and facilities. Some concrete channels and energy dissipation structures for the management of run-off are already constructed, and some others are being considered. SRK has observed that GCM is in the process of implementing improved surface water controls around the new El Chocho TSF.
| 18.1.12 | Water Supply |
According to the available information regarding the water supply requirements and surface water records in the area, water supply for processing and potable water does not present a significant challenge to the Project. There is however no mine water balance or records of water use and little or no site specific or detailed analysis of the water cycle has been undertaken to date.
Water for processing, estimated at approximately 100 m3/hr has historically been provided mainly from the pond known as La Tupia, and secondarily from underground dewatering activities. The water for the Maria Dama processing plant is stored in a small reservoir, La Tupia, shown in Figure 18-11. The water is transported by pipe and open channel for use at the plant. Recycled water from the El Choco TSF reduces the quantity of makeup water required.
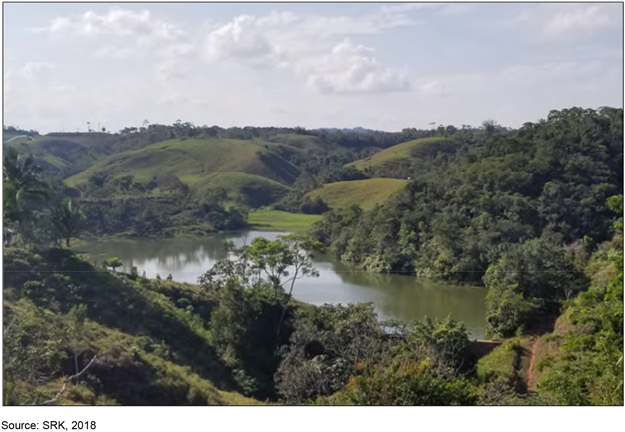
Figure 18-11: Maria Dama Water Storage Pond
|
BP/KD |
May 2022 |
| SRK Consulting (U.S.), Inc. NI 43-101 Technical Report – Segovia 2021 PFS Update |
Page 332 |
| 18.2 | Tailings Management Area |
The following description of the El Chocho dry stack TSF was prepared by SRK for the 2022 update of the PFS and is based on conversations with representatives of Segovia’s operations and engineering staff, and a desktop review of available information regarding existing tailings generation and management.
Due to COVID-19 pandemic travel restrictions, no formal site visit was conducted and this site description is based on previous personal inspections performed of the Segovia El Choco site in accordance with Companion Policy 43-101CP to NI 43-101 by Mr. Sames, as well as interviews with operations staff during online meetings. A desktop review of relevant design and operating reports and available data was conducted by Mr. Sames and focused on information that could affect TSF development or expansion.
This annual update to the PFS included desktop review of the following documents:
| • | El Chocho Tailings Storage Facility, Final Design Report, prepared for Gran Colombia Gold Corp, Segovia Project, Knight Piésold, July 2012 |
| • | Presa El Chocho Para Almacenamiento de Lodos, Optimización del Volumen de Almacenamiento, Revision de Diseno Definitivo, prepared for Gran Colombia Gold Corp. Proyecto Pampa Verde, iConsult, February 2013 |
| • | Revisión Técnica del Informe de Diseńo Final – Deposito de Almacenamiento de Relaves El Chocho, Auditoría de Residuos Sólidos Industriales por Beneficio de Minerales Auríferos, prepared for Gran Colombia Gold Corp., Amec Foster Wheeler, November 2016a |
| • | Análisis del Sistema de Manejo Actual de Relaves – Alterativas de Corto, Mediano, y Largo Plazo, Auditoría de Residuos Sólidos Industriales por Beneficio de Minerales Auríferos, prepared for Gran Colombia Gold Corp., Amec Foster Wheeler, November 2016b |
| • | Construction drawings for Fase IB and Fase 2A of the El Chocho tailings storage facility provided by Gran Colombia Gold Corp prepared by Wood (dated September 2019) |
| • | El Choco Filtered Tailings Storage Facility Detailed Design Report for Phase 1C and 2A provided by Gran Colombia Gold Corp prepared by Wood (dated December 2019) |
| • | Maccaferi Geotub Stacking Drawing and Design Calculation Package provided by Gran Colombia Gold Corp (dated June 2018) |
| • | Manual de Operaciones, Mantenimiento y Supervision, prepared by Wood (dated May 12, 2019) and provided by Gran Colombia Gold Corp |
| • | Resumen Proyecto Chocho, Diciembre 2020, PowerPoint presentation monthly report provided by Gran Colombia Gold Corp |
| • | Data files provided by GCM to SRK in 2021 |
| • | Resumen Proyecto Chocho, Diciembre 2021, PowerPoint presentation monthly report provided by Gran Colombia Gold Corp. |
| • | Data files provided by GCG to SRK in 2022. |
| 18.2.1 | General Description |
The El Chocho TSF has been designed as a filtered tailings dry stack. The current maximum tailings production rate is around 1,800 t/d, an increase from 2021 by 300 t/d with the addition of a second
|
BP/KD |
May 2022 |
| SRK Consulting (U.S.), Inc. NI 43-101 Technical Report – Segovia 2021 PFS Update |
Page 333 |
filter unit in the third quarter of 2021 to alleviate down time for maintenance. The TSF is designed with a total estimated capacity of 3.58 Mt to meet the LoM requirements.
The current storage facility consists of existing phases 1B and 1A and newly constructed phase 1C, which finished in early 2020. The current layout of the El Chocho TSF is shown in Figure 18-12. All TSF phases are constructed on a 0.5 m impermeable clay layer. Construction of phase 2A downstream of Phase 1C began in the first quarter of 2021.
Phase 1B was the first tailings storage area built and was designed to accept slurried tailings. It was constructed as a conventional earth fill embankment with a clay core and upstream chimney drain to prevent the development of excess pore water pressures in the embankment. The upper portion of Phase 1B was reclaimed in 2020 by placing 1 m of growth media over the existing tailings and converted to a community recreational field. The lower eastern portion of phase 1B has an internal rockfill berm dividing the storage area to the north which acts as a filter to decant water to the current operating pool used to recirculate water to and from the filter press. The western half of the storage area is currently being reclaim utilizing the same closure methods as mentioned above.
Phase 1A includes a geotube embankment constructed in 2018 and 2019 by filling geotubes with tailings slurry. The design was prepared by Maccaferri and includes tailings-filled tubes stacked to form an embankment approximately 15 m high. The geotube embankment was designed to provide for interim containment of tailings, while the Phase 1C embankment was under construction. The placement of filtered tailings in Phase 1A finish early in 2020, after which tailings is being stacked at Phase 1C. The Geotube embankment was buttressed during 2021 with a combination of Geotubes and compacted filtered tailings. A geotechnical site investigation of the Geotube embankment and placed tailings was conducted in 2020 to characterize in situ conditions and obtain samples for geotechnical testing. The data was used to establish engineering properties and prepare a stability analysis, (SRK CO-2021).
Phase 1C was designed by Wood Group and was completed in early 2020. Phase 1C includes a 15 m rockfill starter embankment in the valley downstream of the existing Phase 1A geotube embankment. The Phase 1C rockfill starter embankment was designed with an 8 m wide crest and 2H:1V upstream and downstream sideslopes.
Phase 2A was also designed by Wood Group and will be located farther downstream in the same valley as Phase 1C, as illustrated in construction drawings prepared by Wood (dated September 2019) and excerpted in the figures included in this section. Construction methods and elements are the same as those used in Phase 1C. Phase 2A is designed with a 10 m high rockfill starter embankment, 8 m wide crest and 2H:1V upstream and downstream sideslopes.
|
BP/KD |
May 2022 |
| SRK Consulting (U.S.), Inc. NI 43-101 Technical Report – Segovia 2021 PFS Update |
Page 334 |
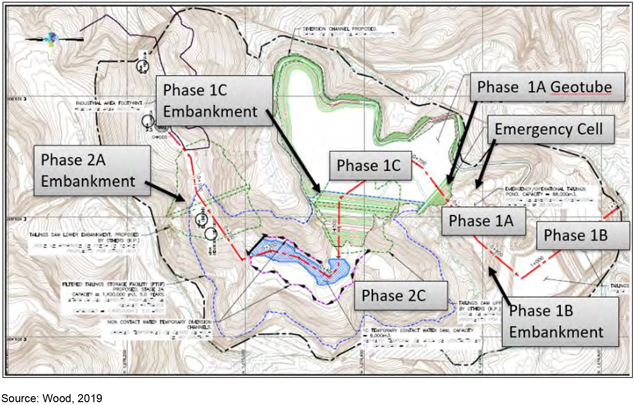
Figure 18-12: General Layout Site Plan
| 18.2.2 | Operation |
The current operation features a filter plant with two plate and frame filter presses and three phases of dehydration cells capable of treating the full tailings load of 1,800 t/d of filter tailings. The original emergency pond used to store tailings when the filter plant is down for maintenance has been backfilled with filtered tailings. Instead, the mine uses geotubes to filter the tailings solids during filter press down times.
Tailings produced by the flotation process are sent through the filter press to achieve a volumetric moisture content of approximately 12% to 18%. The filtered tailings drop out of the elevated filters and are loaded into haul trucks using a front-end loader. The filtered tailings are hauled and dumped at the TSF where a dozer is used to spread the filtered tailings into 30 cm layers. A vibratory smooth drum roller is then used to compact the filtered tailings to the specified compaction. The outer 40 m perimeter of each tailings lift is compacted to a higher relative density than the interior tailings to achieve a higher density, thereby reducing the potential for liquefaction of the tailings material and improving the mass and erosional stability of the stacked tailings.
Quality control on compacted placed tailings is achieved by regular testing of filtered tailings to check maximum dry density. In-place compaction testing is conducted three times a day by a third-party quality assurance testing firm with a nuclear density gauge. The target moisture content is +12% or -3% per Wood in the Engineering Design Report (Wood, 2019). The following elements of Phase 1C design and construction are summarized from Wood (2019).
|
BP/KD |
May 2022 |
| SRK Consulting (U.S.), Inc. NI 43-101 Technical Report – Segovia 2021 PFS Update |
Page 335 |
| • | Phase 1C filtered tailings placement consists of 6 m high lifts with 4.5 m benches stacked to a maximum height of 33 m. The overall outer slope of Phase 1C at closure will be 3H:1V. As constructed, Phase 1C will provide an approximate maximum storage capacity of 1.28 Mt based on design configuration and has approximately 0.7Mt capacity remaining. The general arrangement is shown in Figure 18-13. |
| • | Phase 2A will be constructed downstream of Phase 1C with 6 m height lifts and bench widths of 4.5 m. The overall slope of Phase 2A at closure is 3.2H:1V and provides a maximum storage capacity of 2.3 Mt based on the design configuration. The general arrangement is shown in Figure 18-14. |
Wood conducted a series of stability analyses during the design of Phases 1C and 2A to determine the width of the required outer perimeter compacted structural section assuming the non-structural section was uncompacted tailings. The analyses concluded that a 40 m wide outer structural zone compacted to a specified relative density will achieve the required factor of safety (FoS) for both static and pseudo-static loading conditions. The results of Wood’s stability analyses concluded that minimum FoS for Phase 1C and 2A as designed will satisfy the minimum criteria recommended by Canadian Dam Association (2014) guidelines, assuming the TSF is constructed in accordance with Wood’s design and follows the technical specifications and quality control plan. In the stability analyses, the material properties of the uncompacted and compacted filtered tailings were assumed based on experience and similar projects.
|
BP/KD |
May 2022 |
| SRK Consulting (U.S.), Inc. NI 43-101 Technical Report – Segovia 2021 PFS Update |
Page 336 |
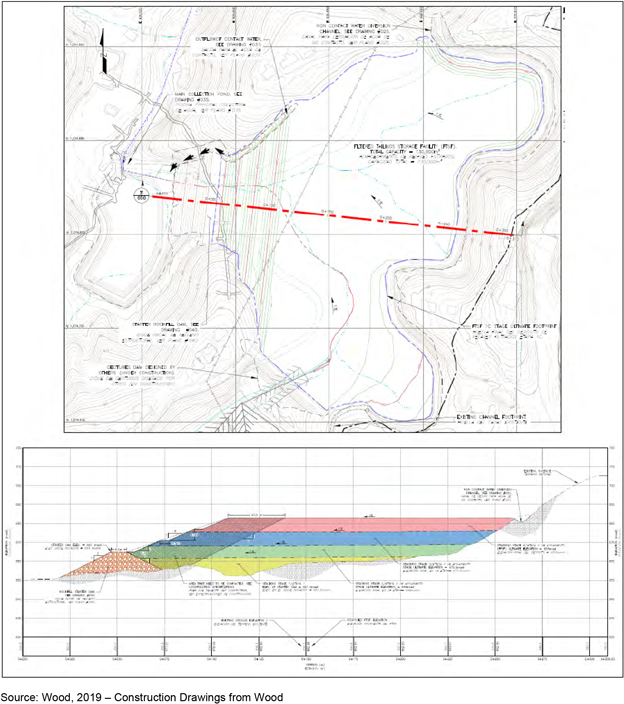
Figure 18-13: General Arrangement and Section View of El Choco Phase 1C
|
BP/KD |
May 2022 |
| SRK Consulting (U.S.), Inc. NI 43-101 Technical Report – Segovia 2021 PFS Update |
Page 337 |
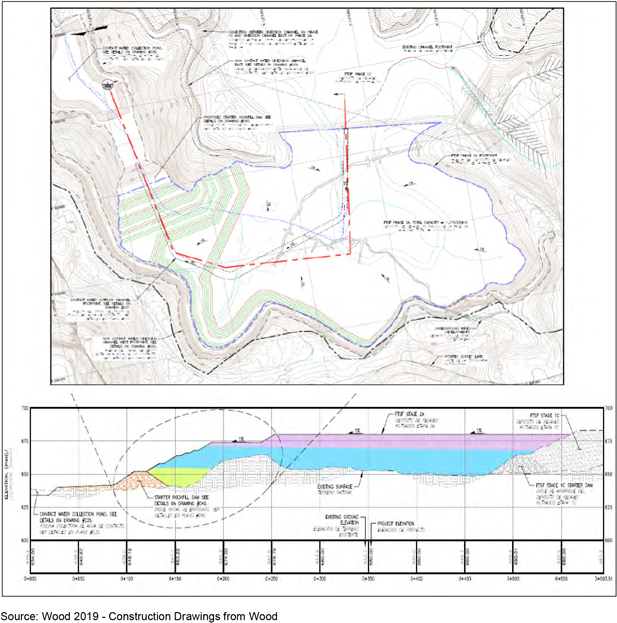
Figure 18-14: General Arrangement and Section View of El Choco’s Phase 1C
| 18.2.3 | Phase 2A Construction Procedures and Design |
Construction of Phase 2A started in the first quarter of 2021 with foundation preparation and construction of water management structures for contact and non-contact water. The stream that flows through the lower part of the valley was diverted by diversion channels located upstream of the TSF that discharges to the Peñitas Valley creek downstream of the contact water ponds. Contact water that is not diverted by the diversion channel is collected and managed through the underdrain system which discharges into the collection pond. Once the underdrain has been covered with filtered tailings, the tailings surface runoff will be managed on the top deck and routed to the collection pond for each phase.
|
BP/KD |
May 2022 |
| SRK Consulting (U.S.), Inc. NI 43-101 Technical Report – Segovia 2021 PFS Update |
Page 338 |
| 18.2.4 | Foundation |
Foundation preparation for Phase 2A is currently being conducted and includes removal of trees, clearing and grubbing of vegetation, and removal of topsoil to stockpiles in designated areas for future use. Pockets of unsuitable subgrade foundation material are being removed, including saturated zones, soft spots, high organic zones and loose soil zones per Wood (2019) is shown in Figure 18-15.
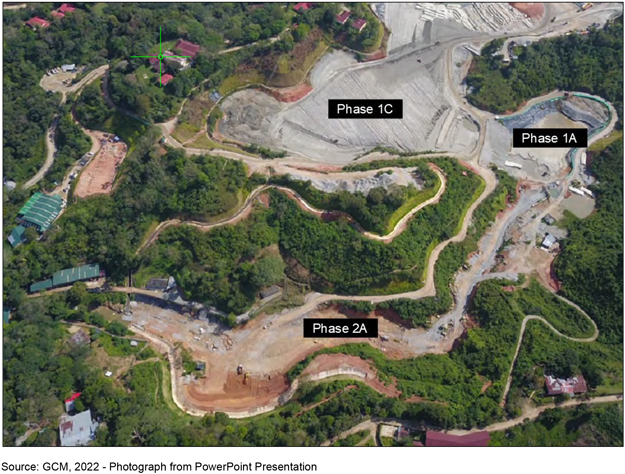
Figure 18-15: Phase 2A Clear and Grub – December 2021
There were some illegal underground mining operation that were encountered within the footprint of the foundation of Phase 2A. These underground workings are planned to be backfill with a slurry grout concrete mixture during foundation preparation.
| 18.2.5 | Water Management |
Based on Wood (2019), the underdrain collection system for Phase 1C was designed and constructed to capture shallow or perched groundwater below the tailings in the north and south natural valleys, to prevent increased pore pressures at the foundation/tailings interface. The underdrain collection system follows the natural drainages and consists of a system of corrugated 24-inch diameter perforated and solid PVC pipes. Water from the underdrain system is piped under the Phase 1C embankment and into the contact water collection pond.
|
BP/KD |
May 2022 |
| SRK Consulting (U.S.), Inc. NI 43-101 Technical Report – Segovia 2021 PFS Update |
Page 339 |
The Phase 2A system will consist of one underdrain following the Penitas Valley main channel which began construction in the third quarter 2021. The Phase 1C underdrain system will be connected to the Phase 2A system once construction of the new Phase 2A collection pond is complete and routed under the Phase 2A rockfill starter embankment into the new collection pond. The Phase 1C and 2A underdrain layout is shown in Figure 18-16.
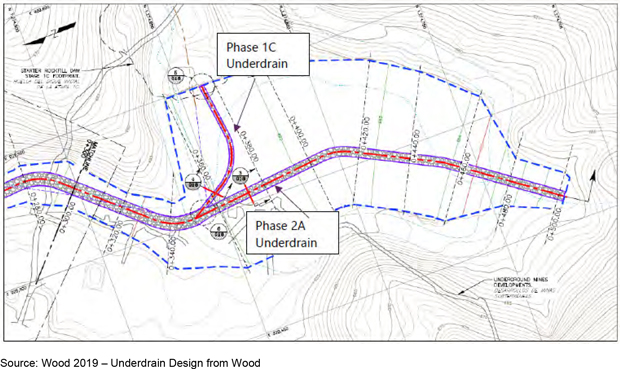
Figure 18-16: Underdrain Collection System
The collection ponds are designed to settle solids and monitor and treat stored water as required before discharge to the natural stream downstream.
The design storage capacity of the Phase 1C collection pond is 5,800 m3 and for Phase 2A is 19,500 m3. The Phase 2A collection pond has been designed with an 80mm HDPE double textured geomembrane on top of a 10 oz/sy non-woven geotextile. Both Phase 1C and Phase 2A ponds were sized to catch the contact run-off from a 10-year return interval storm event.
The Phase 1C stormwater diversion channel was connected to the Phase 1B and 1A existing diversion channel. The combined diversion channel is a concrete lined trapezoidal channel cut into the existing slope above the TSF with a minimum design slope of 2%.
Construction of the eastern diversion channel extension was complete at the end of the second quarter in 2021 and the western diversion channel extension is currently under construction, see Figure 18-17 for diversion channels to the east and west of Phase 2A. The eastern diversion channel extension is anticipated to be completed at the end of the second quarter of 2022. The diversion channel from Phase 1C was connected to the new eastern diversion channel and was designed to manage the Phase 1C top deck runoff once it has been reclaimed.
|
BP/KD |
May 2022 |
| SRK Consulting (U.S.), Inc. NI 43-101 Technical Report – Segovia 2021 PFS Update |
Page 340 |
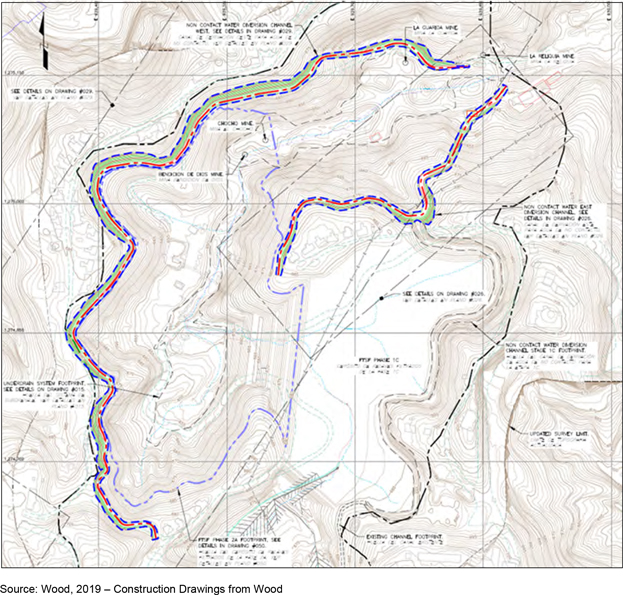
Figure 18-17: Phase 2A East and West Stormwater Diversion Channels
| 18.2.6 | Review of Previous Relevant and Updated Recommendations |
The following is a summary of outstanding recommendations included in the 2019, 2020 and 2021 PFS annual updates with discussion of actions or documentation provided and reviewed since the issuance of the 2020 report.
| • | 2019: Perform additional geotechnical characterization within proposed embankment foundation footprints to confirm design criteria, inputs and assumptions. Confirm embankment footprint foundation design assumptions for grain size distribution, Atterberg limits, soil classification, moisture content, compaction, overburden removal depths and material strength properties: |
| ○ | The original geotechnical investigation was conducted by Knight Piesold (KP) in 2012 and consisted of a program of five boreholes and 22 test pits. Per Wood (2019), the detailed |
|
BP/KD |
May 2022 |
| SRK Consulting (U.S.), Inc. NI 43-101 Technical Report – Segovia 2021 PFS Update |
Page 341 |
| Phase 1C and Phase 2A designs utilized the original KP geotechnical characterization (KP, 2012) in preparing the designs for Phase 1C and 2A. |
| ○ | SRK recommends that site and foundation conditions encountered during preparation for Phase 2A starter embankment and TSF construction be closely inspected by a qualified geotechnical engineer and compared to KP’s 2012 geotechnical characterization and the design adjusted accordingly. |
| • | 2019: Confirm geotechnical properties of filtered tailings including, at a minimum, grain size distribution, Atterberg limits; compacted density, permeability, consolidation, and shear strength: |
| ○ | A geotechnical site investigation specific to the geotube embankment and placed tailings behind the embankment was conducted in 2020 to characterize in situ conditions and obtain samples for geotechnical testing. CPT and in-situ tests (SPT, shear vane) and a laboratory program were completed in compacted tailings areas and upstream of the filtered tailings facility, where conventional tailings are stored. The data will be used to establish engineering properties and prepare a stability analysis, currently anticipated to be completed by the end of the second quarter of 2021. |
| ○ | SRK recommends that the results of the tailings characterization portion of the investigation be utilized in a review of the stability analyses upon which the overall Phase 1C and Phase 2A designs were based. Aside from the site characterization specific to the geotube embankment In Phase 1A, SRK is not aware of any additional tailings characterization work. |
| • | 2019: Confirm tailings containment requirements based on latest update to the mine plan to determine overall size and staging of the TSF: |
| ○ | Wood (2019) included design capacities demonstrating sufficient capacity to accommodate the predicted ore tonnage. Recent changes extending the life of mine have not resulted in an increase in total mined tonnes. |
| • | 2019: Confirm assumptions and criteria related to stability and seismic loading, including but not limited to, interface friction, internal friction and saturated foundation conditions for both rockfill and Geotube embankments: |
| ○ | Site seismicity was addressed by Wood (2019) in their stability analyses, but no geotechnical material characterization was provided. |
| ○ | A geotechnical site investigation specific to the geotube embankment and placed tailings behind the embankment was conducted in 2020 to characterize in situ conditions and obtain samples for geotechnical testing. The data will be used to establish engineering properties and prepare a stability analysis specific to the geotube embankment, currently anticipated to be completed by the end of the second quarter of 2021. |
| ○ | SRK recommends that the results of the tailings characterization portion of the investigation be utilized in a review of the stability analyses upon which the overall Phase 1C and Phase 2A designs were based. |
| • | 2019: Complete liquefaction and seepage analyses on embankments and foundations: |
| ○ | No analyses were performed. Wood (2019) stated that the tailings were assumed to be non-liquefiable. |
| ○ | SRK recommends that the results of the CPT investigation performed for characterization of the tailings behind the geotube embankment be utilized in an assessment of the |
|
BP/KD |
May 2022 |
| SRK Consulting (U.S.), Inc. NI 43-101 Technical Report – Segovia 2021 PFS Update |
Page 342 |
| liquefaction potential of the tailings both within and outside the 40m wide compacted tailings structural zone. |
| • | 2019: Complete a site-specific seismicity assessment, including classification of ground conditions, to provide the seismic design basis for the dam design: |
| ○ | Site seismicity was addressed by Wood (2019) in their stability analyses and reference was made to the probabilistic and deterministic seismic hazard assessment in KP (2012). |
| ○ | SRK recommends that all stability and liquefaction analyses be evaluated for consistency with the recommendations of the ICMM Global Tailings Standard. |
| • | 2020: Conceptual design drawings and preliminary calculations prepared by Macafferi Inc. for the Phase 1A Geotube embankment were reviewed by SRK. While it is possible that the embankment is stable as designed and constructed, the information provided and reviewed was not sufficient to prove the stability of the embankment. Because the proposed placement of filtered tailings in Phase 1C will occur downstream of this embankment, and a failure of this embankment could jeopardize both personnel safety and the stability of the Phase 1C embankment, SRK recommends that a detailed analysis of the stability of the Phase 1A Geotube embankment be completed as soon as possible using currently available data and conservative assumptions of dry-stacked filtered tailings geotechnical properties. Depending on the results of that analysis, additional geotechnical characterization of placed filtered tailings behind the Phase 1A embankment and pore pressures within the tailings mass may be warranted, potentially via the implementation of a Cone Penetrometer Testing (CPT) program and additional laboratory testing. |
| ○ | As described above, a geotechnical site investigation specific to the geotube embankment and placed tailings behind the embankment was conducted in 2020 to characterize in situ conditions and obtain samples for geotechnical testing. The data was used to establish engineering properties and stability analysis was prepared specific to the geotube embankment, (SRK CO-2021). |
| ○ | SRK recommends that the evaluation of the stability of the geotube embankment should be expanded to consider the existing conditions where additional geotubes and tailings have been stacked considerably higher than was observed during SRK’s 2020 site visit. |
| • | 2020: A program for updating and maintaining foundation and tailings geotechnical characterization data should be implemented. The results of the updated characterization should be compared to assumptions used in design and stability analyses performed to date to ensure adequate factors of safety against mass failure and liquefaction for all embankments. |
| ○ | SRK recommends that new characterization data developed through the evaluation of the geotube embankment stability evaluation be combined with additional characterization data collected during construction of Phase 2A, and that these data should be considered as described above and the potential benefits of an ongoing tailings geotechnical characterization program should be evaluated. |
| • | A program of regular geochemical characterization of waste rock and tailings should be developed based on known and predicted variations in ore and waste rock/overburden geology such that potentially adverse impacts to contact water chemistry can be predicted and managed. |
| ○ | SRK reiterates this 2020 recommendation. |
|
BP/KD |
May 2022 |
| SRK Consulting (U.S.), Inc. NI 43-101 Technical Report – Segovia 2021 PFS Update |
Page 343 |
| • | 2020: A dam break analysis and EAP should be prepared in accordance with accepted international standards. |
| ○ | Potential failure mechanisms and indicators are described in summary format in the Manual de Operaciones, Mantenimiento y Supervision (Wood, 2019), however a dam break analysis and potential downstream impacts with a tiered response plan and notification requirements were not provided. |
| ○ | SRK reiterates this 2020 recommendation. A potential cascading failure from the conventional tailings stored upstream of the dry stack facility should be included as a credible failure mode. |
| • | 2020: An Operation, Maintenance and Surveillance (OMS) Plan should be prepared in accordance with accepted international standards. |
| ○ | GCM provided the Manual de Operaciones, Mantenimiento y Supervision (OMS Manual; by Wood, 2019). The document has been prepared consistent with accepted international standards. |
| ○ | SRK recommends that the 2019 OMS Manual be reviewed and updated annually to accurately reflect ongoing operations and changes in management personnel and responsibilities. |
|
BP/KD |
May 2022 |
| SRK Consulting (U.S.), Inc. NI 43-101 Technical Report – Segovia 2021 PFS Update |
Page 344 |
| 19 | Market Studies and Contracts |
| 19.1 | Summary of Information |
Gold markets are mature, global markets with reputable smelters and refiners located throughout the world. Demand is presently high with prices for gold showing an increase during the past year. Markets for doré are readily available. Segovia has a gold room to produce doré. The doré is shipped offsite for final refining.
| 19.2 | Commodity Price Projections |
Assumed prices are based on the long-term outlook for gold. This projection is below the three-year trailing average and current spot price and is in-line with the long-term view of relevant market analysts in the precious metal sector. Table 19-1 presents the price used for the cash flow modeling and reserves estimate.
Table 19-1: Segovia Price Assumptions
| Description | Value | Unit | ||||||
|
Gold |
1,650 | US$ | /oz | |||||
Source: GCM, 2021
Treatment charges and net smelter return (NSR) terms are summarized in Table 19-2.
Table 19-2: Segovia Net Smelter Return Terms
| Doré | Value | Units | ||||||||
| Payable Gold |
100% | |||||||||
|
Doré Smelting & Refining Charges1 |
8.25 | US$ | /oz-Au | |||||||
Source: GCM, 2021
| 1. | Reserves cut-off grade (CoG) used $6/oz smelting and refining charges, based in the previous year PFS report. Costs/prices used in the CoG may differ to those in the final economic model. This is due to the need to make assumptions early on for mine planning prior to finalizing other items and using long term forecasts for the life of mine plan. |
The doré production is sold at the mine gate, therefore, no transportation costs are considered in this analysis.
|
BP/KD |
May 2022 |
| SRK Consulting (U.S.), Inc. NI 43-101 Technical Report – Segovia 2021 PFS Update |
Page 345 |
| 20 | Environmental Studies, Permitting and Social or Community Impact |
| 20.1 | Environmental Studies |
The following is a summary of the results of environmental studies and information, as well as a discussion of any known environmental issues that could materially impact GCM’s ability to extract the mineral resources or mineral reserves of the Segovia Project. It is based exclusively on information provided by GCM and was not developed independently by SRK.
| 20.1.1 | Environmental Setting |
The local topography is characterized by a low-lying plateau at 600 to 850 m altitude, incised by steep valleys. The climate is tropical with an annual average temperature of 24.9°C and average annual rainfall of approximately 2,720 mm/year, predominantly falling between April and November. The drainage pattern across Segovia is dendritic; the northeast and west of the license area drains north into the Nechi River, which is influenced by artisanal mining operations. The Ité River to the south of Segovia flows southeast and then northeast into the Magdalena River. The vegetative cover across the landscape consists of disturbed grassland (used mainly for mining and livestock rearing activities) interspersed with fragmented forest patches, mainly along drainage lines within the incised valleys. Forest patches provide important habitat for wildlife.
The operations are located within the town of Segovia, which has been a center for gold mining for more than 100 years and the environmental and social setting is strongly influenced by this. Mining, both formal and informal, is the main economic activity in both Segovia and the neighboring town of Remedios, which is approximately five kilometers from Segovia. Informal processing operations in these towns using basic technology has resulted in poor health and safety conditions and widespread water contamination from discharge of tailings and waste directly into the environment. This has led to a prevalence of mercury-related health problems in the local populations. Health issues related to population influx are also common.
| 20.1.2 | Baseline Environmental Data |
The Segovia Project predates the regulatory requirements to prepare an environmental impact assessment as part of the overall permitting process. Instead, the operations were authorized through the approval of an Environmental Management Plan (“Plan de Manejo Ambiental” or PMA). The first PMA approval was in 2004, which was subsequently renewed in 2008.
In 2012, a PMA update was provided to the regulators, and included baseline study information and site investigations related to: geology, geomorphology, soils, hydrology, hydrogeology, climate/meteorology, air quality, noise, geotechnical, landscape, flora (vegetation), birds, mammals, herpetofauna, fish, and macro-invertebrates. The 2012 PMA also included information on the socioeconomic situation in the area and potential impacts from legal and illegal mining. This 2012 PMA update, however, was not initially revised by the regional environmental authority, Corantioquia.
At the request of Corantioquia, additional baseline information was developed in 2012, 2013, and 2014, which was consolidated into a single document and resubmitted to Corantioquia in 2015. In 2016, this information was supplemented with additional detail on the small mining operations,
|
BP/KD |
May 2022 |
| SRK Consulting (U.S.), Inc. NI 43-101 Technical Report – Segovia 2021 PFS Update |
Page 346 |
detailing the conditions of the abiotic, biotic and socioeconomic environments. It was also requested that the information on solid waste, mine drains and beneficiation plant conditions (including tailings management), and clarifications on contingency planning and mine closure planning, be expanded and submitted to the agency. This information was provided to Corantioquia in August 2017 for consideration. Corantioquia subsequently visited the operations in October 2018 and prepared a technical report on the findings and acceptance of the information provided to them to date. The amended PMA was formally accepted by Corantioquia through the issuance of Resolución 160ZF-RES1902-967 on February 22, 2019, with a renewal period of five years. GCM appealed several of the terms and conditions of the resolution, which led to the issuance of Resolución 160ZF-RES1911-6813 on November 25, 2019, accepting several of the arguments presented by GCM. As a result, Resolución 160ZF-RES1902-967 (February) and Resolución 160ZF-RES1911-6813 (November) jointly approve the PMA for operations.
In 2021, GCM requested that Corantioquia consider the polymetallic plant as a minor modification within the context of the overall mining operation, and that an amendment to the PMA was unnecessary. According to GCM, Corantioquia communicated acceptance of this request. In addition, a minor modification of Mining Title 6045 for the Carla Mine was also requested in order to the disposal of mining wastes in the shaft deposit to support the closure plan of this site. Here too, Corantioquia agreed to the request, and no modification of the PMA was required.
20.1.3 Geochemistry
GCM conducts quarterly leach testing of solids in the tailings facilities, as well as annual sampling of mine portal discharge water. Additional work is needed, specifically in waste rock characterization, to bring the project geochemical characterization to a level consistent with international best practice.
Tailings
The physical management of tailings is discussed in Section 20.2.2. GCM continues to detoxify cyanide leached tailings using hydrogen peroxide and iron sulfate. Excess water can be discharged to surface water in accordance with the PMA and standards established in Resolución 631 of 2015. The possibility of residual cyanide discharge to the environment still exists, but the current condition represents a significant improvement over the historical discharge of whole tailings to the environment. Environmental protective measures completed or in the works include:
| • | GCM closes tailings facilities as they are decommissioned |
| • | Diversion structures have been constructed to minimize contact water |
| • | TSF construction plan includes a low-permeability soil liner |
GCM analyzes tailings semi-annually for hazardous content using the CRETIP method (Corrosive, Reactive, Explosive, Toxic, Inflammable, Pathogen) as required by Colombian regulation Decreto Número 4741-2005 for the prevention and management of hazardous waste. Included in the CRETIP method are analyses of metals by the U.S. Environmental Protection Agency (EPA) method 1311, the Toxicity Characteristic Leaching Procedure (TCLP). Metals concentrations in recent test leachate are within regulatory limits, and the pH values for tailings leachate are near neutral, indicating low potential for ARD generation in the short term. It is not uncommon for sulfidic ore and waste rock to generate neutral pH values in short term leachate tests such as Method 1311, even on rock that tests net acid-generating. Sulfide minerals rarely oxidize in short-term leach tests. The only reliable means of
|
BP/KD |
May 2022 |
| SRK Consulting (U.S.), Inc. NI 43-101 Technical Report – Segovia 2021 PFS Update |
Page 347 |
assessing the long-term ARD potential of samples is through a long-term leach test such as the humidity cell test (HCT).
HCTs completed on tailings in 2020 provide useful information on the potential environmental performance of the tailings. Tests were completed on one sample of filter press tailings and one sample of cyanide destructed tailings. The filter press tailings maintained circum-neutral pH throughout the test, in agreement with static test data indicating net neutralizing potential. Metals in leachate were low to negligible throughout the test duration. The cyanide destruction tailings leachate started pH-neutral but turned acidic and terminated in week 20 at pH 3.54. Metals released above Maximum Permissible Limits (MPLs) included cadmium, copper, iron, lead, nickel, and zinc, indicating that the tailings facility will need to be managed to prevent the release of ARDML to the environment. Cyanide release was below detection throughout the test duration.
Tailings contact water data from 2019 indicate that pH is circum-neutral, and metal concentrations are remained generally low. Other constituents are, however, locally elevated and represent an environmental risk, including sulfate (1,437 mg /L) and nitrate (171 mg/L).
Waste Rock
As an underground mine, Segovia produces a relatively small quantity of waste rock. Waste rock brought to surface is managed to minimize contact water, and site personnel report that there have been no observations of contact water with adverse quality. However, uncertainties remain regarding the potential ARDML generation from waste rock. The 2019 geochemical static test program included only three samples of unmineralized country rock that might ultimately be designated as waste rock. Two of the three samples are classified as non-PAG with the third classified as “uncertain”, but it must be understood that a data set of three samples is entirely inadequate for drawing broad conclusions regarding the ARDML properties of waste rock. The testing suggests that a portion of waste rock could potentially generate ARDML.
Of the five HCTs conducted on mine rock, only one produced acidic pH at week 20. However, HCT results on mine rock in three of five samples are not in agreement with static test data. Specifically, the static tests indicate that three samples are net acid-generating despite the HCT leachate in the samples being circum-neutral. A 20-week HCT is often inadequate for ascertaining the long-term ARDML potential of sulfidic mine rock (Price, 2009) and the convention in environmental mining geochemistry is to run HCTs for at least one year. The likelihood therefore exists that these three samples could produce acidic leachate in the long term despite the short-term neutral pH performance. The metal leaching potential of waste rock should also be investigated, given the HCT data on ore that indicate potential leaching of metals including arsenic, cadmium, lead, and zinc
Mine Water
Water captured by underground dewatering is used for milling and processing. Analytical data collected from 2011 to 2021 from underground mine inflows indicate that all three mining areas, Sandra K, Providencia, and El Silencio, discharge water with metals that include arsenic, cadmium, iron, lead, mercury, zinc, and local chromium. Sandra K and Providencia inflows exhibit neutral pH, but El Silencio reports isolated areas of acidic discharge as low as 3.94 s.u The underground water quality should not present a significant risk during operations if the water’s use is limited to internal purposes such as milling and processing. However, if a need arises to tap underground water for other uses, then it
|
BP/KD |
May 2022 |
| SRK Consulting (U.S.), Inc. NI 43-101 Technical Report – Segovia 2021 PFS Update |
Page 348 |
will likely be necessary to track the water usage to determine if pre-treatment is necessary so that no discharge occurs to the environment that could adversely impact potable sources or aquatic life.
The hydrogeologic analysis predicts that the post-mining groundwater levels will likely rebound to an elevation above the portals at Providencia and Sandra K, but the prediction for El Silencio is uncertain. If rebound brings groundwater levels to portal levels, management of the discharges will be a necessity, either through plugging of the portals or active management that could include water treatment. Also, the potential for post-closure discharge of mine water from local springs might be a possibility. Discharge from the mine workings may exhibit seasonal variation, and discharge might not occur during the dry season.
| 20.2 | Mine Waste Management |
| 20.2.1 | Waste Rock |
Very little waste rock is generated by the underground operations at Segovia. What little waste rock is generated is used on the surface for the construction and maintenance of roads and the embankments of the various tailings disposal facilities. As noted above, some of this material was used during the construction of a regional/national road project in 2021.
| 20.2.2 | Tailings |
The Maria Dama plant at Segovia is fed with ore which is milled and processed using treated water from the underground operations, filtrate water from the tailings filtration plant, and fresh make-up water from ponds on the surface. Excess treated water not needed in the process circuit is treated through advanced oxidation, sedimentation, and filtration processes before being discharged in accordance with the PMA and standards established in Resolución 631 of 2015.
There are essentially two tailings streams from the Maria Dama process, with the bulk of the flotation tailings being pumped directly to the El Chocho tailings complex for filtration and placement or deposition into Geotubes for embankment construction. A smaller secondary stream of cyanide tailings is first detoxified using H2O2 and FeSO4, then pumped to either the Báscula or one of the three Bolivia settling ponds. Only Bolivia 3, constructed in 2020, was used in 2021. These are geomembrane-lined basins currently being used to store detoxified cyanide tailings; decant water from these ponds is pumped back to the Maria Dama plant for use in the process circuit. The detoxified and dewatered tailings from the settling ponds is treated through a polymetallic plant (a.k.a., cleaning plant) to remove higher levels of lead and zinc before being transferred to the El Chocho TSF. According to GCM, the ‘cleaning plant’ commenced operations during Q3 2021 and has the capacity to treat 120 t/d of detoxified cyanide tailings from the Maria Dama production line + 80 tons/day of stored tailings from the settling ponds.
Monitoring of the residual tailings to determine whether or not they are classifiable as ‘hazardous’ continues to be accomplished through Corrosive, Reactive, Explosive, Toxic, Inflammable, Pathogen [biological] (CRETIP) analyses. Laboratory data sheets provided by GCM through 2021 support the current non-hazardous classification of tailings, though low-level concentrations of some metals are still being detected but are below MPLs. Monitoring of water downgradient of the El Chocho TSF in 2021 indicated no exceedances of MPLs set by Resolución 631 of 2015.
|
BP/KD |
May 2022 |
| SRK Consulting (U.S.), Inc. NI 43-101 Technical Report – Segovia 2021 PFS Update |
Page 349 |
| 20.2.3 | Site Monitoring |
Various mitigation and monitoring programs are discussed in the approved PMA. Monitoring of residual tailings to determine whether or not they are classifiable as ‘hazardous’ is accomplished through CRETIP analyses. Data provided by GCM supports the current non-hazardous classification, though the limited geochemical characterization performed to date suggests that they could be potentially acid generating in the longer term. Additional analysis may be warranted. As noted above, GCM plans to initiate a series of additional HCTs in Q3 of 2022.
| 20.3 | Project Permitting Requirements |
| 20.3.1 | General Mining Authority |
Since 1940, the Ministry of Mines and Energy (MME), formerly the Mines and Petroleum Ministry, has been the main mining authority with the legal capacity to regulate mining activities in accordance with the laws issued by the Colombian Congress. The MME can delegate its mining related powers to other national and departmental authorities. Mining regulations in Colombia follow the principle that (except for limited exceptions) all mineral deposits are the property of the state and, therefore, may only be exploited with the permission of the relevant mining authority, which may include the MME, the National Agency for Mining, or the regional governments designated by law.
In 2001, the Congress issued Law 685 (the Mining Code). This law established that the rights to explore and exploit mining reserves would only be granted through a single mining concession agreement (the 2001 Concession Agreement). This new form of contracting did not affect the pre-existing mining titles (licenses, aportes and concessions) which continue to be in force until their terms expire. The 2001 Concession Agreement includes the exploration, construction, exploitation, and mine closure phases, and are granted for periods of up to 30 years. This term may be extended upon request by the title holder for an additional 30-year term. According to the Mining Code, the initial term was divided into three different phases:
| • | Exploration – During the first three years of the concession agreement, the title holder will have to perform the technical exploration of the concession area. This term may be extended upon request. The maximum term for the Exploration phase is eleven years. |
| • | Construction – Once the exploration term lapses, the title holder may begin the construction of the necessary infrastructure to perform exploitation and related activities. This phase has an initial three-year term which may be extended for one additional year. |
| • | Exploitation – During the remainder of the initial term minus the two previous phases, the title holder will be entitled to perform exploitation activities. |
The RPP 140 mining title owned by GCM has a special regulatory condition in which the subsoil is owned by GCM in perpetuity in accordance with the terms of Law 20 of 1969.
| 20.3.2 | Environmental Authority |
In 1993, Law 99 created the Environmental Ministry and then, in 2011, Decree 3570 modified its objectives and structure and changed the name to Environment and Sustainable Development Ministry. The Ministry is responsible for the management of the environment and renewable natural resources and regulates the environmental order of the territory. Also, the Ministry defines policies and regulations related to rehabilitation, conservation, protection, order, management, use, sustainable
|
BP/KD |
May 2022 |
| SRK Consulting (U.S.), Inc. NI 43-101 Technical Report – Segovia 2021 PFS Update |
Page 350 |
use of natural resources. Article 33 of Law 99 also created the Regional Environmental Authority (Corporaciones Regionales Autónomas or CAR) with the responsibility to manage the environment and renewable natural resources.
In 2011, Decree 3533 created the National Authority of Environmental Licenses (Autoridad Nacional de Licencias Ambientales or ANLA). ANLA is responsible that all project, works or activities subject to licensing, permit or environmental procedures comply with the environmental regulations and contribute to the sustainable development of the country. ANLA will approve or reject licenses, permits or environmental procedures according to the law and regulations, and will enforce compliance with the licenses, permits, and environmental procedures.
Before the licensing process of mining projects, the jurisdiction of either ANLA or CAR is determined by the annual volume of material to be exploited. For projects exploiting more than 2 Mt/y, the responsibility lies with ANLA. Both ANLA and CAR can enforce project compliance with the terms of their licenses or permits. Up to now, based on the annual production and transport of materials in RPP 140, the environmental authority that oversees the Segovia Project is CAR (Corantioquia).
| 20.3.3 | Environmental Regulations and Impact Assessment |
Colombian laws have distinguished between the environmental requirements for exploration activities, and those that have to be fulfilled for construction and exploitation works. During the exploration phase, the concession holder is not required to obtain an environmental license. However, the concession holder requires environmental permits which will be obtained from the CAR. The concession holder has to comply with the mining and environmental guidelines issued by the MME and the Environment and Sustainable Development Ministry.
In order to begin and perform construction and exploitation operations, the concession holder must obtain an environmental license or the approval of an existing environmental management plan (PMA) either from ANLA, if the project exploits more than 2 Mt/y, or from CAR, if the mineral exploitation is less than 2 Mt/y.
The approval process begins with the request for Terms of Reference (ToR) to prepare an Environmental Impact Statement (EIS) or update an existing PMA. The approval of the EIS and/or PMA by the jurisdictional environmental authority includes all environmental permits, authorizations and concessions for the use, exploitation or affectation, or all of the above, of natural resources necessary for the development and operation of the project, work or activity. PMA does not include permits or concessions for renewable natural resources; they are managed independently. Additionally, other permits and requirements (non-environmental) are required in order to begin construction and operation of the project. Projects that started operations before December 1993, and already had the applicable permits in place, must still apply an PMA and apply for the requisite minor environmental permits.
Non-governmental organizations (NGOs) and the local communities have the opportunity to participate in the environmental administrative procedures leading up to the issuance of an environmental license. The environmental process includes participation of, and information to, all communities in the project area, including indigenous communities and Afro-descendant communities.
|
BP/KD |
May 2022 |
| SRK Consulting (U.S.), Inc. NI 43-101 Technical Report – Segovia 2021 PFS Update |
Page 351 |
| 20.3.4 | Water Quality and Water Rights |
The Colombian regulations that principally govern water quality, including discharge permitting and requirements, are Decree 2811 of 1974, Decree 1541 of 1978, Decree 1594 of 1984, Decree 3930 of 2010, and Resolución 631 of 2015 that establishes the enforceable MPLs for discharges to surface water. The Regional Environmental Authority (Corantioquia) enforces compliance with these regulations.
Water rights for mining activities are granted by means of a water concession which is granted by Corantioquia and which is independent to the mining concession or land ownership. The water rights related to mining activities are included in the environmental licenses and are normally granted for terms of five years. The terms and conditions under which a water concession is granted may depend, amongst other things, on the amount of water available in the specific region, the possible environmental impact of the concession, water demand, the ecological flow, and the different users that the water source services. The water concession is typically accompanied by a water discharge permit.
Water concessions granted to the operation are listed in Table 20-1.
Table 20-1: Water Concessions Granted to the Operation
| No. | Authorization | Area | Note: | |||
| 1 |
ZF1-07-3 |
Mina Providencia |
||||
| 2 |
ZF1-07-5 |
P.B. María Dama |
||||
| 3 |
ZF1-07-20 |
Mina Silencio (Exploración) |
||||
| 4 |
ZF1-07-22 |
Mina Sandra K |
||||
| 5 |
ZF1-11-5 |
Manejo de Colas-Mina El Silencio |
||||
| 6 |
ZF1-11-45 |
Mina Sandra K (Exploración) |
||||
| 7 |
ZF1-12-42 |
Las Cristalinas |
||||
| 9 |
ZF1-20-582 |
UPM Mina Vera 1 |
||||
| 10 |
ZF1-20-579 |
UPM El Castillo 1 |
||||
| 11 |
ZF1-20-578 |
UPM El Cañón |
||||
| 12 |
ZF1-21-312 |
UPM Peñitas 1- Tres y Media |
||||
| 13 |
ZF1-18-898 |
Campo Alegre (Exploración) |
Withdrawal requested July 2021 | |||
| 14 |
ZF1-18-905 |
Mina Sandra K (Explotación) |
||||
| 15 |
ZF1-18-906 |
Mina Silencio (Explotación) |
In progress | |||
| 16 |
ZF1-01-10 |
Hacienda Curuná |
Valid until April 2021 | |||
| 17 |
ZF1-11-24 |
Juan Brand, La Innominada (Exploración) |
Valid until January 2021 | |||
| 18 |
ZF1-11-46 |
Mina Silencio (Exploración) |
Valid until March 2021 |
Source: GCM, 2022.
Industrial discharge authorizations are listed in Table 20-2.
|
BP/KD |
May 2022 |
| SRK Consulting (U.S.), Inc. NI 43-101 Technical Report – Segovia 2021 PFS Update |
Page 352 |
Table 20-2: Industrial Discharge Authorizations
| No. | Authorization | Area | Note | |||||
| 1 | ZF7-12-9 |
D.R. El Chocho |
||||||
| 2 | ZF7-17-689 |
Mina Providencia |
||||||
| 3 | ZF7-17-686 |
Mina Sandra K |
||||||
| 4 | ZF7-18-937 |
PTAP Doña Ana |
||||||
| 5 | ZF7-21-448 |
Mina Las Aves - Soc. Las Aves |
||||||
| 6 | ZF7-21-516 |
UPM La Cecilia - Soc. Antioquia Gold |
In progress | |||||
| 7 | ZF7-21-461 |
UPM El Castillo 2 - Soc. STANDARD GOLD |
In progress | |||||
| 8 | ZF7-21-483 |
UPM La Guarida - Soc. La Guarida |
In progress | |||||
| 9 | UPM Sah Gold - Soc. Sah Gold S.A.S |
In progress | ||||||
| 10 | ZF7-20-730 |
Mina El Silencio |
In progress |
Source: GCM, 2022.
Domestic discharge authorizations are listed in Table 20-3.
Table 20-3: Domestic Discharge Authorizations
| No. | Authorization | Area | ||||
| 1 | ZF7-07-5 |
Mina Providencia | ||||
| 2 | ZF7-08-42 |
P. B. María Dama | ||||
| 3 | ZF7-12-10 |
Oficinas Generales | ||||
| 4 | ZF7-15-14 |
Campamento La Salada |
Source: GCM, 2022.
During 2021, several Channel Occupation permits were processed, as indicated in Table 20-4.
Table 20-4: Channel Occupation Permit
| No. | Authorization | Area | ||||
| 1 | ZF8-12-4 |
El Chocho | ||||
| 2 | ZF8-16-13 |
Maria Dama | ||||
| 3 | ZF8-19-98 |
La Playa - Shaft | ||||
| 4 | ZF8-20-5 |
La Gonzalita - Sandra K | ||||
| 5 | ZF8-20-103 |
Las Cristalinas | ||||
| 6 | ZF8-20-123 |
La Iluminada | ||||
| 7 | ZF8-20-61 |
La Tupia |
Source: GCM, 2022.
| 20.3.5 | Air Quality and Ambient Noise |
Decree 948 of 1995, along with the currently applicable standards contained in Resolución 2154 of 2010 (which modified Resolución 650 of 2010 adopting the protocol for air quality monitoring), Resolución 2254 of 2017 (which establishes air quality limits), and Resolución 909 of 2008 (which establishes the allowable limits for Fixed Sources, provide the main regulations on protection and control of air quality. These regulations set forth the general principles and regulations for the atmospheric protection, prevention mechanisms, control, and attention of pollution episodes from fixed, mobile or diffused sources. These regulations also provide emission levels or standards. Among the emission sources regulated are: controlled open burnings, discharge of fumes, gases, vapors, dust or particles through stacks or chimneys; fugitive emissions or dispersion of contaminants by open pit mining exploitation activities; solid, liquid and gas waste incineration; operation of boilers or incinerators by commercial or industrial establishments, etc. The parameters regulated are: SO2, NO2, CO, PM10, PM2.5, and O3. The Regional Environmental Authority (Corantioquia) enforces compliance
|
BP/KD |
May 2022 |
| SRK Consulting (U.S.), Inc. NI 43-101 Technical Report – Segovia 2021 PFS Update |
Page 353 |
with these regulations. Data provided by GCM for 2020 indicates that all parameters were within permissible limits set under Resolución 2254 of 2017 at all monitoring locations.
Resolution 627 of 2006 establishes the maximum permissible standards for noise emission and environmental noise, where the limits are differentiated by sectors, subsectors, daytime broadcast and night broadcast.
| 20.3.6 | Fauna and Flora Protection |
The main regulations for the protection of fauna and flora are contained in the Natural Resources Code and the Agreement about Biological Diversity entered into in Rio de Janeiro on June 5, 1992, within the framework of the Rio Convention. Also, forest management and use is regulated by Decree 1791 of 1996, and the compensation of the biotic component is regulated by Resolución 256 of 2018. In addition, there are other important regulations on the matter of fauna and flora protection, such as the Cartagena Protocol on Biotechnology Security of the Agreement about Biological Diversity entered into in Montreal on January 29, 2000, and the Convention on International Trade of Threatened Wild Fauna and Flora Species (CITES). Endangered species are protected by environmental and criminal law.
In order to perform biodiversity studies, a permit for scientific investigation must first be obtained from the Regional Environmental Authority (Corantioquia). In 2021, an audit was conducted to evaluate the progress of reforestation efforts in order to establish compensation amounts. This information is currently being used to create a map of the current status of flora and fauna within RPP 140.
| 20.3.7 | Protection of Cultural Heritage or Archaeology |
Cultural and natural heritage protection in Colombia is stated in the political constitution and developed through several international treaties and laws of the state. There are strict legal provisions, such as Law 397 of 1997 and Decree 763 of 2009, whereby the heritage is safeguarded and protected. For example, if a citizen finds an archeological specimen, he or she must inform the Ministry of Culture of the discovery within 24 hours; otherwise he or she could be sanctioned by the competent authority.
| 20.3.8 | Segovia Concession and Permit Status |
The Segovia Project operates under three different types of mining titles: RPP, Licenses and Concession Contracts. The first and main title is the private property R14011 (more commonly referred to as RPP 140), which gives GCM ownership of the surface and underground mineralized deposits. This title, covering 2871.4524 ha, existed before the enactment of Law 685, and continues to be valid under the terms and the applicable legislation at the time the title was granted. RPP 140 is, therefore, exempt from posting an Environmental Mining Insurance Policy and obtaining an Environmental License (discussed above). From an environmental perspective, however, developments within RPP 140 are permitted through the approval of the PMA and secondary permits for water abstraction, forest use, air emissions, discharges, and construction within river courses and drainages. The Regional Environmental Authority responsible for approving the PMA and issuing permits for the Segovia Project is the Corporación Autónoma Regional de Antioquia (Corantioquia).
Concession title 6045, which was the consolidation of Concession contracts 6000, 5995, 7367, and 6045 due to proximity and reporting requirements, is valid and in effect until 2035. This title covers 567.5869 ha in area of Remedios. GCM is currently attempting to combine Concession Contract 6038
|
BP/KD |
May 2022 |
| SRK Consulting (U.S.), Inc. NI 43-101 Technical Report – Segovia 2021 PFS Update |
Page 354 |
(710.2053 ha) and Concession Contract 6046 (226.24 ha) in Segovia. As of March 2021, this has not occurred. These remain independently valid until 2035 and 2034, and each concession continues with its own obligations independently. The 4998 Contract was issued under decree 2655 of 1988 and covers 12.00 ha. Finally, Concession Contract 6048 (291.37 ha) is co-owned with Nugget S.A.S and is valid until 2035.
Exploration Licenses (3854 and 3855), in the jurisdiction of the municipality of Remedios and Segovia, were issued under decree 2655 of 1988, and covers 35.5206 ha. As of October 29 and March 26, 2021, Concession Contracts were signed that perfected the change of this licenses to a concession, which are good for 10 and 30 years respectively. Exploration License (1358) is also located in Remedios and Segovia and covers 106.95 ha. All exploration licenses (now concession contracts) appear to be in good standing. License 1358 is pending conversion to concession contracts.
The original PMA for the Segovia Project was submitted to Corantioquia by the previous owners, FGM, in 2004 (2004 PMA). When Zandor acquired the assets of FGM, it commissioned an updated PMA that was submitted in June 2012 (2012 PMA). In 2013 and 2014, the operation was updated again, and in 2015, Corantioquia requested a summary of all the information into a single document. After its review by the authority in September 2016, supplemental information was requested by Corantioquia. This information was delivered on August 1, 2017. In October 2019, Corantioquia inspected the site, and, after the respective administrative procedure, approved the PMA for five more years. The amended PMA was formally accepted by Corantioquia through the issuance of Resolución 160ZF-RES1902-967 on February 22, 2019, with a renewal period of five years. GCM appealed several of the terms and conditions of the resolution, which led to the issuance of Resolución 160ZF-RES1911-6813 on November 25, 2019, accepting several of the arguments presented by GCM. As a result, Resolución 160ZF-RES1902-967 (February) and Resolución 160ZF-RES1911-6813 (November) jointly approve the PMA for operations.
Based on a review of the permit register for Segovia and information from Zandor/GCM, the necessary secondary permits for water abstraction, forest use, air emissions, discharges and river course construction for the operating mines (El Silencio, Sandra K, Providencia, and Carla) appear to be in place or are addressed by the PMA update. The Carla Mine has gradually increased production during November and December 2020 to reach 30 t/d but is not yet requiring additional renewable natural resources.
According to GCM, a modification of the Carla´s existing environmental license was submitted to Corantioquia in August 2021, seeking approval of additional permits and the increasing of production. This approval is still pending. Environmental permits for the Pampa Verde processing plant were obtained in October 2013, though this site remains inactive.
The permits for the El Chocho TSF have also been obtained: Channel Occupation Permit (Resolución 130ZF-1501-6959 File ZF8-12-4), Forestry Permit (Resolución 130ZF-1310-6201 File ZF5-12 -14), and the Discharge Permit (Resolución 130ZF-1311-6218 File ZF7-12-9). The Discharge Permit is valid until 2023. Phase 1 has received authorization for forest harvesting, which was granted by Corantioquia through Resolución 160ZF-RES1811-6282 of November 15, 2018 (ZF5-18-169), and phase 2 obtained permission under Resolución 160ZF-RES2002-975 (ZF5-19-417). The Channel Occupation Permit has not had any modifications and remains in effect until 2025. According to GCM, the Chocho mine has been secured in its entirety and is under administrative protection from continued artisanal mining.
|
BP/KD |
May 2022 |
| SRK Consulting (U.S.), Inc. NI 43-101 Technical Report – Segovia 2021 PFS Update |
Page 355 |
A tailings filtration process was installed in the El Chocho TSF area and had been operational since early 2019. A second filter press was brought online in 2021. This enables GCM to dry-stack tailings on surface in the multiple phase locations. While this area has a naturally occurring silt-clay base, an additional saprolitic clay layer (30 cm thick) was placed to mitigate subsurface seepage. Constructed bunds are used to contain the stacked tailings on top of geofabric.
Corantioquia has issued invoices for environmental charges to the former owner of the Segovia Project, FGM, associated with the direct discharge of tailings from the Maria Dama beneficiation plant to a nearby stream. SRK understands that no environmental liabilities have been transferred to GCM from the actions that occurred prior to Zandor’s ownership in August 2010. GCM is potentially responsible for the payment of charges for discharges after August 2010. According to GCM, they have not received any invoices from Corantioquia for environmental damages in the past several years. The environmental sanctioning process against GCM regarding wastewater discharge from the María Dama plant was solved under Resolution 160ZF-RES2108-5411 August 26, 2021. The appeal was submitted before Corantioquia on October 1, 2021, and its decision is still pending.
| 20.3.9 | Performance and Reclamation Bonding |
The termination of a mining concession can happen for several reasons: resignation, mutual agreement, and expiration of the term, the concession holder’s death, free revocation and reversion. In all cases, the concession holder is obliged to comply or guarantee the environmental obligations payable at the time the termination becomes effective.
The 2001 Mining Code requires the concession holder to obtain an Insurance Policy to guarantee compliance with mining and environmental obligations which must be approved by the relevant authority, annually renewed, and remain in effect during the life of the project and for three years from the date of termination of the concession contract. The value to be insured will be calculated as follows:
| • | During the exploration phase of the project, the insured value under the policy must be 5% of the value of the planned annual exploration expenditures |
| • | During the construction phase, the insured value under the policy must be 5% of the planned annual investment for assembly and construction |
| • | During the exploitation phase, the insured value under the policy must be 10% of the value resulting from the estimated annual production multiplied by the pithead price established annually by the vigor Government |
According to the Law, the concession holder is during the term of the contract liable for environmental remediation and other liabilities based on actions and or omissions during the mining contract period, even if those actions or omissions are held by an authorized third-party operator. However, the owner is not responsible for environmental liabilities which occurred before the mining contract, from activities done in the past, or from those which result from non-regulated mining activity, as has occurred on and around Segovia´s Project site.
As noted above, given the tenure of Mining title RPP 140, the Environmental Insurance Policy is not required.
|
BP/KD |
May 2022 |
| SRK Consulting (U.S.), Inc. NI 43-101 Technical Report – Segovia 2021 PFS Update |
Page 356 |
| 20.4 | Environmental and Social Management |
The Segovia Project has a Health, Safety and Environmental Quality (HSEQ) system designed to comply with ISO 9001, ISO 14000, and OHSAS 18000, though no compliance audits against these certification programs have been conducted. The system includes a HSEQ policy, integration of the plan-do-check-act cycle, and comprehensive risk matrices defining the health, safety and environmental risks with actions required to mitigate these risks. The CGC Health and Safety Management System complies with Colombian legal requirements, and the Company is currently implementing a 2020-2025 plan, which seeks to strengthen the management system and improve the level of health and safety culture of all workers (direct, temporary and contractors).
Environmental and social issues are managed in accordance with the approved PMA. Annual reports are submitted to Corantioquia to demonstrate compliance with the PMA. GCM has also implemented plans for solid and hazardous waste management, domestic wastewater management, noise monitoring, and establishment of a plant nursery for revegetation activities.
GCM has developed a model, entitled Best Practice in Sustainability (BPS), which is a process built around eight Guiding Principles to analyze and measure the effectiveness and efficiency of interactions and engagement with internal and external stakeholders and communities at large. These Guiding Principles are intended to help make corporate citizenship activities consistent and more effective by focusing on the right things to do and then doing them well. The BPS is a strategic planning and management tool for Corporate Affairs practitioners to optimize community outreach programs that support the objectives of GCM’ global operations. It is part of the GCM PMA and supports the GCM Leadership Framework. The BPS helps tailor GCM decisions regarding external affairs to the unique and varied business, country and community contexts in which they operate, and is designed to advance GCM’ business objectives and those of its key external stakeholders through a process of consultation and collaboration and guided by rational, reasonable and attainable Action Plans with the following principles:
| • | LEADERSHIP: Demonstrate management leadership commitment to proactive external relationships through personal involvement and encouragement of active participation in outside activities throughout the organization. |
| • | WORKFORCE INVOLVEMENT: Provide opportunities to create mutual understanding and respect through workforce volunteer involvement in the community. |
| • | TEAMWORK: Demonstrate Sustainable performance as a team worker. |
| • | COMMUNICATIONS: Engage a variety of internal and external audiences on an ongoing basis in open, forthright, and proactive dialogue and communication. |
| • | COMMUNITY RELATIONS: Create realistic expectations by consulting with communities in the design and implementation of strategic community investments, sponsorships, and other external affairs outreach programs. |
| • | GOVERNMENT RELATIONS: Engage regularly with opinion formers and elected and appointed government officials to gain insights, build relationships and promote the Corporation’s business and general interests. |
| • | MEDIA RELATIONS: Build and maintain positive relationships with the media to maximize the opportunity for communicating our messages with fairness, balance and accuracy. |
| • | CRISIS MANAGEMENT: Prepare in advance to address the needs of the community and the media during crises to maintain public trust and credibility. |
|
BP/KD |
May 2022 |
| SRK Consulting (U.S.), Inc. NI 43-101 Technical Report – Segovia 2021 PFS Update |
Page 357 |
GCM has aligned the BPS initiatives with: the United Nations Sustainable Development Goals; needs and issues of the communities; local governments plans; Global Compact principals, IDB in Corporate Social Strategy; and IFC guidelines, all of which line up with the PMA social file cards to improve health and well-being of local communities surrounding the operation, attending to education, intervention in the construction and improvement of roads, promote leadership and entrepreneurship for women, and develop partnerships with small-scale miners.
The BPS assessment process is accomplished on at least an annual basis following a series of procedural steps that result in the required output. Although there are a variety of ways to achieve the output, recommended tools for accomplishing them are included in Figure 20-1.
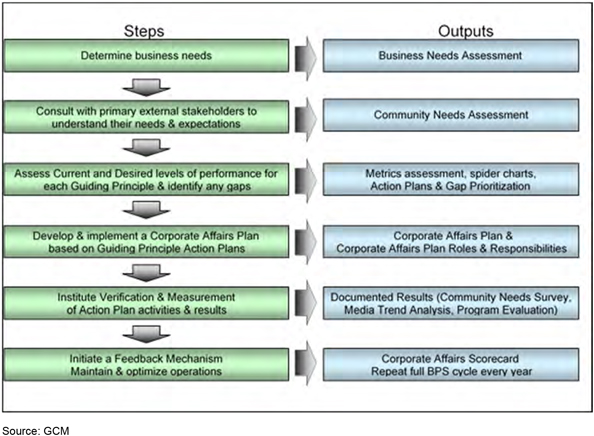
Figure 20-1: BPS Initiative Work-Flow Diagram
A revised impact assessment was prepared during the PMA modification and approval process, and management measures were defined and organized into a suite of 24 management plans covering the eight initiatives:
| • | Small Miners Supply Chain Initiative |
| • | Biodiversity and Water for the Future |
| • | Education for development and Eradication of Child Labor |
| • | Health and Well-being |
| • | Entrepreneurial Women Leaders |
| • | Infrastructure for Development |
|
BP/KD |
May 2022 |
| SRK Consulting (U.S.), Inc. NI 43-101 Technical Report – Segovia 2021 PFS Update |
Page 358 |
| 20.4.1 | Stakeholder Engagement |
Following acquisition, GCM conducted stakeholder analyses every two years for the Segovia Project, identifying the individual stakeholder groups and their potential influence on the project, their needs, and their expectations. GCM has had a formal stakeholder engagement plan, and an integrated communication plan that defines who should be given specific information, when that information should be delivered, and what communication channels will be used to deliver the information.
This engagement can take many forms: open dialogues, such as discussions (both internally and externally); emails; publications; internet web sites; media; and even social media. GCM also wants to hear from stakeholders of all types: from governments to customers, employees to suppliers, shareholders to communities, and even NGOs. A series of workshops have been held in Segovia and Remedios through 2020, to discuss engagement objectives with stakeholders.
GCM has a complaints and petitions handling procedure to record grievances both at the company offices and two community offices, located in Segovia and Remedios. According to GCM, the grievance recording, and response procedures follow international good practice.
| 20.4.2 | Artisanal and Small-Scale Mining Operations |
Colombia’s mining sector is characterized by widespread informality. A census conducted in 2014 revealed that 72 per cent of all mining operations in Colombia are classed as ‘artisanal and small-scale mining’ (ASM), and 63 per cent are ‘informal’, lacking a legal mining concession or title. Large-scale mining (LSM) only accounts for one per cent of operations. Over 340,000 Colombians depend directly on ASM and medium-scale mining (MSM) for their income. This informality deprives the state of important financial resources, while the current poor conditions (environmental, social, health and safety, labor, technical and trading) prevent the sector from delivering on important social objectives, such as generating formal employment and improving the quality of life in mining communities (Echavarria, 2014).
The situation at Segovia is much the same, with ASM alongside the formal concession operation. As an added complication, however, there are illegal armed groups in the area (i.e., Revolutionary Armed Forces of Colombia or FARC, and National Liberation Army or ELN) as well as armed criminal groups (i.e., “bandas criminales” or BACRIM) who are tied to the ASM and MSM operations in the area, primarily through criminal extortion, robbery, and even in the trafficking of explosives. Note: FARC signed an historic peace deal with the Colombian government in November 2016, and the official disarmament of the rebel army was completed in August 2017; however, a small number of illegal FARC “Dissidents” still remain a threat, though no known FARC dissident criminal activity has been documented in the area of Segovia and Remedios since the signing of the 2016 peace agreement. Despite the continued presence of these organizations in certain rural areas, security forces have established relative territorial control in Antioquia, mitigating the effect of these groups on populated areas. It is, however, still difficult to differentiate between legitimate ASM and MSM that have not been legalized or formalized and those controlled by illegal organizations.
In 2013, a decree (933) was enacted to address the legal void for almost 4,000 requests for formalization from Law 1382 of 2010, which was promulgated, in part, with the objective of combating illegal mining, while recognizing the traditional nature of informal ASM. This decree redefined traditional mining as a form of informal mining. It set out formalization procedures for ASM in LSM
|
BP/KD |
May 2022 |
| SRK Consulting (U.S.), Inc. NI 43-101 Technical Report – Segovia 2021 PFS Update |
Page 359 |
mining concessions and titles, notably including procedures for concession-owners to cede areas to ASM and included tax incentives. For the first time, it also provided options for areas returned to the state to be reserved for ASM formalization. In addition, Mercury Law No. 1658 of 2013, introduced incentives for the formalization of ASM such as: granting of soft credits and financing programs to facilitate access to resources; and created a sub-contract intended to formalize illegal mining activities with the registered license-holder. Under Article 11 of Law 1658, concession owners can sign subcontracts with ASM operating in their concessions without the liability associated with normal operating contracts. These subcontracts will legally allow these ASM to operate in an agreed upon area with no oversight by the concession owner. Instead, these ASM will be under the control of the Colombian mining and environmental authorities.
According to the social baseline assessment conducted by GCM in 2012:
| • | More than 195 illegal mines occurred within the Segovia concession area |
| • | There is an unsustainable use of natural resources |
| • | ASM processing recovers only between 50% and 65% of the gold |
| • | Approximately 7 kg of mercury are discharged to the environment per kg of gold produced by ASMs and MSMs |
| • | The operations support child labor and child prostitution |
| • | There is no connection to the social security system in health, pensions and occupational risks |
| • | There is no compliance with labor laws |
| • | Safety practices are substandard if existent at all |
| • | The operations pay no taxes or royalties |
| • | Illegal explosives are generally used |
At the end of 2021, there were approximately 124 non-formalized mines operating illegally in GCM’ Segovia mining title. To address this issue, and to ensure that all miners operating in GCM’ mining titles are working under Colombian legislation and environmental and social security guidelines, GCM created the Small Miners Supply Chain initiative. Through this initiative, GCM aided in formalizing 61 of the original ASMs. They seek to implement an operating model that works with communities and ASM to improve the quality of their lives, eliminate mercury, contribute to legalize their jobs, improve the security and the economic and social development of the country. The ASM formalization statistics are shown in Figure 20-2.
Some accomplishments associated with this initiative include:
| • | Up to 61 operating contracts signed with ASMs |
| • | Up to 2,600 small formalized miners |
| • | More than 165 tons of mercury removed |
| • | More than 665,000 oz of gold produced by small mining |
| • | 240,000 million pesos of profit for small miners |
| • | 60,000 million pesos in taxes and royalties paid |
| • | 12,000 people benefited from the social security system |
| • | 3,000 new bank accounts opened |
| • | Partnerships with Sena and Comfama training in key mining issues |
| • | Compliance with the requirements of occupational health, safety and health regulations |
| • | Compliance with the regulations indicated in the environmental management plans |
|
BP/KD |
May 2022 |
| SRK Consulting (U.S.), Inc. NI 43-101 Technical Report – Segovia 2021 PFS Update |
Page 360 |
| • | Purchase of legal explosives |
| • | More than 4,170 jobs created |
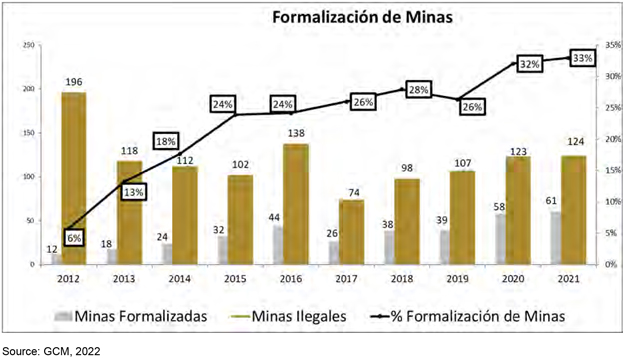
Figure 20-2: Formalization of ASM at Segovia
GCM has partnered with the United Nations Industrial Development Organization (UNIDO) through their Global Mercury Project that seeks the reduction of mercury throughout the world. This is a high impact initiative in Colombia, given that Segovia, Antioquia was the first municipality contaminated by mercury in 2012 and currently is the third-largest contaminator in the world with this chemical element. Annual mercury reduction is summarized in Figure 20-3.
|
BP/KD |
May 2022 |
| SRK Consulting (U.S.), Inc. NI 43-101 Technical Report – Segovia 2021 PFS Update |
Page 361 |
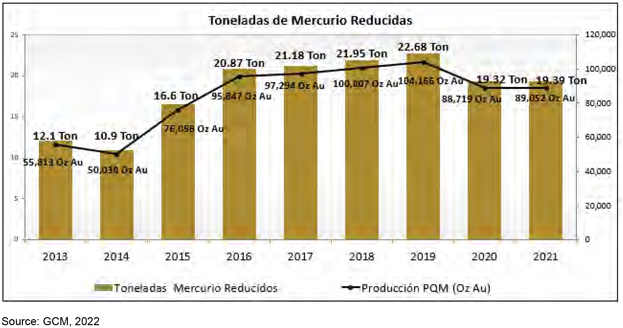
Figure 20-3: Reduction in Tons of Mercury per Year
| 20.5 | Mine Closure and Reclamation |
Chapter XX, Article 209 of Law 685 of 2001 requires that the concession holder, upon termination of the agreement, shall undertake the necessary environmental measures for the proper closure and abandonment of the operation. To ensure that these activities are carried out, the Environmental Insurance Policy shall remain in effect for three years from the date of termination of the contract. Little else regarding the specifics of mine closure is provided in the Law. Decree 2820 of 2010 specifically indicates that the concession holder must submit a plan for dismantling and abandonment of the project.
GCM (Zandor Capital S.A.) submitted a plan for closure and abandonment of the RPP 140 mining operations (2017 Plan de Cierre y Abandono) on August 1, 2017 in response to specific requirements set forth in Article 1 of the Administrative Act 160ZF - 1610 - 9107, issued by Corantioquia on October 5, 2016. The 2017 closure plan (like its 2014 predecessor) is still conceptual and will require more specificity in the future as the end of mine life approaches.
Based on site documents and closure assumptions, an updated conceptual closure plan was prepared by SRK as an accompaniment to the 2020 PFS. The following is a general discussion consistent with the closure planning.
GCM has practiced concurrent reclamation and closure over the course of operations. The Pomarrosa Tailings Facility has been closed as well as sections of the El Chocho and Shaft tailings facilities. Current facilities will be progressively closed over the duration of the mine site operations. Progressive closure will reduce the costs of reclamation since closure will be integrated with the production operations. In addition, progressive closure will result in the development of expertise on the most appropriate reclamation methods.[JP1] Progressive closure will be undertaken, however without posing impediments to day-to-day operations of the site. Final closure of the mine site will be undertaken
|
BP/KD |
May 2022 |
| SRK Consulting (U.S.), Inc. NI 43-101 Technical Report – Segovia 2021 PFS Update |
Page 362 |
following completion of all mining operations, once treatment of site waters is no longer required, and indications that further mining of the Segovia Project is not warranted.
Final closure of the facility will occur in two stages. The first stage will entail the following activities, if not undertaken during progressive closure phases:
| • | All fuel, chemicals, waste hydrocarbon products and any potentially hazardous materials will be removed from this site. |
| • | Excess materials and inventory, except for those used in closure, will be removed from the site. |
| • | Equipment, machinery, and tanks, not needed for closure will be removed from the site for reuse, recycle, or disposed. |
| • | Structures not suitable for use will be demolished and disposed. |
| • | Earthworks will commence to recontour and revegetate the landscape. |
| • | Underground openings will be closed. |
During the second stage of the final closure will include:
| • | Removal of all equipment, machinery, and storage tanks for reuse, recycle, or disposal. |
| • | Final building demolition and earthwork. |
| • | The Tailing Management Areas (TMA) and other water/tailings management ponds will be closed. |
| • | Water treatment will cease once runoff water no longer requires treatment. |
| • | After the major closure activities are complete, a monitoring program may be implemented, including the site water quality monitoring and dam inspections. |
After the major closure activities are complete, a monitoring program may be implemented, including the site water quality monitoring and dam inspections.
The conceptual closure plan is intended to ensure the area is returned to suitable post-mining land use. At the conclusion of the closure process, no buildings or supporting infrastructure or facilities would remain at the site spoil piles, stockpiles, borrow areas, etc. would be vegetated with general sustainable grass as well as emerging forest (primarily early stages in forest succession are expected to dominate the period immediately following closure). The site will be monitored for success of the closure plan. A few routes will be left for access to points of interest for the monitoring program. These routes will be closed after successful reclamation.
At this time, GCM has not completed an assessment of the socioeconomic impacts of closure or prepared a socioeconomic transitioning plan for the site.
| 20.5.1 | Closure Costs |
Basic closure actions are contained within the PMA and conceptual closure plan, as outlined above, and focus primarily on the concurrent closure of the tailings disposal areas/phases as they reach their LoM capacities. More detailed, site-wide closure actions and costs have not yet been defined, as these will be developed closer to the end of operations. SRK is not aware of on-going financial provisioning for closure.
|
BP/KD |
May 2022 |
| SRK Consulting (U.S.), Inc. NI 43-101 Technical Report – Segovia 2021 PFS Update |
Page 363 |
A Standardized Reclamation Cost Estimator (SRCE) model was used to determine closure costs. Labor and equipment costs used in the model consistent with rates used in the PFS. The following general estimates and assumptions were used in the SRCE model.
| • | Water treatment associated with the overflow of Sandra K and Providencia mines at closure is estimated to occur for five years post-closure. Current site infrastructure and operating rates were used to calculate water treatment costs based on anticipated flow. Further studies are needed to determine the actual extent and duration of post closure water treatment. |
| • | Roads, foundations and yards hectares were calculated based on GIS footprints and Google Earth imagery. |
| • | Waste disposal costs are based on off-site disposal and transport to Medellin. |
| • | TSF closure costs associated with the Shaft and El Chocho are based on estimates obtained from CBMM personnel and costs incurred during the closure of Pomarrosa. |
| • | Portal closure and underground equipment removal were estimated based on experience with similar portfolios. |
| • | Equipment and labor rates were obtained from the site staff and augmented by SRK’s database where needed. |
While SRK recognizes that a formal closure plan is not legally required at this stage of the operation, the development of such a plan with more detail than has previously been provided, would support the calculation of a more accurate closure cost and would help identify the potential closure risks that GCM may need to manage in the coming years.
Based on costs and assumptions included the SRCE model, SRK considers the cost to close the Segovia Project could be on the order of ±US$14 million. US$14M has been used in the technical economic model, work is on-going to improve the design effort to reduce the costs which may result in savings of +/- $2M. This estimate is based on very limited information, particularly regarding hydrogeological and geochemical conditions, and further studies would be required to accurately understand the financial liabilities of closure. This is particularly true with respect to the potential for long-term, post-closure water treatment which could substantially increase the overall closure liability.
As noted above, a requirement for long-term post-closure water treatment would significantly increase both of these estimates.
|
BP/KD |
May 2022 |
| SRK Consulting (U.S.), Inc. NI 43-101 Technical Report – Segovia 2021 PFS Update |
Page 364 |
| 21 | Capital and Operating Costs |
SRK visited the GCM office in 2022 and conducted various meetings to review both capital and operating costs, related to the production supported by the reserves disclosed herein, which give a Project LoM from 2022 to 2028.
Capital and operating costs are based on a specific budget prepared by GCM and reviewed by SRK for each month of production. The mine currently operates through owner mining and contractor mining operations. The plant feed is provided by these mining operations within Segovia’s mineral titles and material sourced from neighboring mineral titles. The costs and revenue associated with processing third-party material from neighboring areas were removed from the estimate, as these are not supported by the reserves disclosed in this report.
This section presents the assumptions used in the preparation of the capital and operating cost estimates and its results.
| 21.1 | Capital Cost Estimates |
The Segovia Project is a currently operating underground mine, the estimate of capital includes only sustaining capital to maintain the equipment and all supporting infrastructure necessary to continue operations until the end of the projected production schedule.
The capital cost estimates developed for this study include the costs associated with engineering, procurement, acquisition, construction, and commissioning. The cost estimate is based on budgetary estimates prepared by Segovia and reviewed by SRK. All estimates are prepared from first principles based on site specific recent actuals. The budget and estimates indicate that the Project requires sustaining capital of US$151.5 million (M) throughout the LoM based on the current production schedule/reserves. Table 21-1 summarizes the sustaining capital estimate.
|
BP/KD |
May 2022 |
| SRK Consulting (U.S.), Inc. NI 43-101 Technical Report – Segovia 2021 PFS Update |
Page 365 |
Table 21-1: Segovia Sustaining Capital Cost Estimate Summary
| Description | LoM (US$000s) | |||
|
|
Development |
35,833 | ||
|
Exploration |
24,324 | |||
|
Providencia Mine |
6,895 | |||
| El Silencio Mine |
22,090 | |||
| Sandra K |
7,356 | |||
|
Carla |
4,647 | |||
| Mine Engineering Costs |
1,917 | |||
| Geology Exploration Drilling |
2,853 | |||
| Small Mining |
84 | |||
|
Mill |
3,978 | |||
|
Laboratory |
969 | |||
|
Maintenance |
1,314 | |||
|
Civils |
134 | |||
|
Logistics & Weighing |
166 | |||
|
Environment |
17,866 | |||
|
O&H |
2,353 | |||
|
Administration |
1,475 | |||
|
IT |
1,916 | |||
|
Security |
1,334 | |||
|
Finance |
0 | |||
| Mine Closure |
10,852 | |||
| TSF Closure |
3,098 | |||
| Carry Over (2021 Projects) |
0 | |||
|
Total Capital |
$151,453 |
Sources: GCM, 2022
| 21.1.1 | Basis for the Capital Cost Estimates |
The cost associated with mining area access development was based on the reserves production schedule that included meters of development. The development unit cost by type and by mine is shown in Table 21-2.
|
BP/KD |
May 2022 |
| SRK Consulting (U.S.), Inc. NI 43-101 Technical Report – Segovia 2021 PFS Update |
Page 366 |
Table 21-2: Development Unit Costs
| Description | US$/m | |||||
| Providencia |
||||||
|
|
GL - Galeria (3x3.5) |
2,200 | ||||
| C H- Cruzada ( x ) |
3,200 | |||||
| Sandra K |
||||||
|
Gl_Conv_meters (2.5x2.5) |
1,500 | |||||
|
Gl_Mec_meters (3.5x3.5) |
1,960 | |||||
|
Rai_meters (3m dia) |
3,200 | |||||
|
Ap_meters (3.7x3.0) |
3,150 | |||||
|
Rp_meters (3.5x3.5) |
1,960 | |||||
|
Xc_meters (2.5x2.5 to 3.5x3.5) |
1,500 | |||||
| Carla |
||||||
|
Galeria |
1,650 | |||||
|
Crucero |
1,650 | |||||
|
Chimenea |
3,350 | |||||
|
|
1,850 | |||||
|
Apique |
4,200 | |||||
| El Silencio |
||||||
|
Metros_RP |
2,071 | |||||
| Metros Gl Mec |
1,750 | |||||
| Metros XC 3.5_3.5 |
1,750 | |||||
| Metros XC 2.2_2.3 |
1,650 | |||||
| Metros AP 2.5x2.5 |
2,800 | |||||
| Metros AP 3.7_3.0 |
4,200 | |||||
| Metros CH 2_2 |
3,000 | |||||
| Metros CH 3.5_3.5 |
3,200 | |||||
| Metros GL 2.2_2.3 |
1,650 | |||||
| Metros PKT |
1,530 | |||||
Source: GCM, 2022
The unit costs used to estimate the development costs are based on historic unit costs for Providencia, Sandra K, El Silencio and Carla.
The production schedule development meters by area are summarized in Table 21-3 to Table 21-6.
Table 21-3: Providencia Annual Development Meters
| Description | LoM (m) | 2022 (m) | 2023 (m) | 2024 (m) | ||||||||||||||
|
|
GL - Galeria (3x3.5) |
618 | 556 | 62 | 0 | |||||||||||||
| C H- Cruzada ( x ) |
1,006 | 550 | 428 | 28 | ||||||||||||||
|
Total |
2,665 | 1,824 | 813 | 28 | ||||||||||||||
Source: GCM, 2022
Table 21-4: Sandra K Annual Development Meters
| Description | LoM (m) | 2022 (m) | 2023 (m) | 2024 (m) | 2025 (m) | |||||||||||||||||
|
Gl_Conv_meters (2.5x2.5) |
1,243 | 639 | 557 | 47 | 0 | |||||||||||||||||
|
Gl_Mec_meters (3.5x3.5) |
3,240 | 517 | 1,369 | 1,299 | 55 | |||||||||||||||||
|
Rai_meters (3m dia) |
442 | 36 | 258 | 148 | 0 | |||||||||||||||||
|
Ap_meters (3.7x3.0) |
165 | 81 | 84 | 0 | 0 | |||||||||||||||||
|
Rp_meters (3.5x3.5) |
1,313 | 813 | 500 | 0 | 0 | |||||||||||||||||
|
Xc_meters (2.5x2.5 to 3.5x3.5) |
985 | 607 | 353 | 25 | 0 | |||||||||||||||||
|
Total |
10,869 | 3,821 | 4,322 | 2,568 | 158 | |||||||||||||||||
Source: GCM, 2022
|
BP/KD |
May 2022 |
| SRK Consulting (U.S.), Inc. NI 43-101 Technical Report – Segovia 2021 PFS Update |
Page 367 |
Table 21-5: Carla Annual Development Meters
| Description | LoM (m) | 2022 (m) | 2023 (m) | 2024 (m) | 2025 (m) | |||||||||||||||||
| Galeria |
808 | 576 | 45 | 187 | 0 | |||||||||||||||||
| Crucero |
416 | 191 | 120 | 105 | 0 | |||||||||||||||||
|
|
Chimenea |
195 | 195 | 0 | 0 | 0 | ||||||||||||||||
| |
219 | 37 | 44 | 109 | 28 | |||||||||||||||||
| Apique |
413 | 73 | 155 | 180 | 5 | |||||||||||||||||
|
Total |
3,153 | 1,529 | 594 | 928 | 103 | |||||||||||||||||
Source: GCM, 2022
Table 21-6: El Silencio Annual Development Meters
| Description | LoM (m) | 2022 (m) | 2023 (m) | 2024 (m) | 2025 (m) | |||||||||||||||||
| Metros_RP |
536 | 536 | 0 | 0 | 0 | |||||||||||||||||
|
|
Metros Gl Mec |
1,027 | 761 | 266 | 0 | 0 | ||||||||||||||||
| Metros XC 3.5_3.5 |
131 | 131 | 0 | 0 | 0 | |||||||||||||||||
| Metros XC 2.2_2.3 |
987 | 298 | 268 | 421 | 0 | |||||||||||||||||
| Metros AP 2.5x2.5 |
37 | 37 | 0 | 0 | 0 | |||||||||||||||||
| Metros AP 3.7_3.0 |
400 | 181 | 218 | 0 | 0 | |||||||||||||||||
| Metros CH 2_2 |
172 | 172 | 0 | 0 | 0 | |||||||||||||||||
| Metros CH 3.5_3.5 |
1,006 | 318 | 346 | 342 | 0 | |||||||||||||||||
| Metros GL 2.2_2.3 |
1,188 | 152 | 659 | 331 | 46 | |||||||||||||||||
| Metros PKT |
0 | 0 | 0 | 0 | 0 | |||||||||||||||||
|
Total |
7,721 | 3,492 | 2,604 | 1,515 | 109 | |||||||||||||||||
Source: GCM/SRK, 2022
The schedule of development meters was factored by the presented unit costs and the resulting development capital cost estimate is presented in Table 21-7.
Table 21-7: Development Capital Costs
| Description | LoM (US$000s) | 2022 (US$000s) | 2023 (US$000s) | 2024 (US$000s) | 2025 (US$000s) | |||||||||||||||||
| Providencia | 4,578 | 2,982 | 1,505 | 91 | 0 | |||||||||||||||||
| Sandra K | 14,200 | 4,846 | 6,118 | 3,128 | 108 | |||||||||||||||||
| Carla | 4,812 | 2,295 | 1,004 | 1,441 | 72 | |||||||||||||||||
| El Silencio | 12,242 | 5,812 | 4,018 | 2,336 | 77 | |||||||||||||||||
|
Total |
35,833 | 15,935 | 12,646 | 6,996 | 256 | |||||||||||||||||
Sources: GCM/SRK, 2022
All other costs are budgetary estimates prepared for the production plan. These estimates are based on historic site-specific figures or accounting balances and were calculated as yearly provisions.
The total yearly capital costs are summarized in Table 21-8.
|
BP/KD |
May 2022 |
| SRK Consulting (U.S.), Inc. NI 43-101 Technical Report – Segovia 2021 PFS Update |
Page 368 |
Table 21-8: Total Yearly Capital Costs ($000’s)
|
|
Description |
LoM | 2022 | 2023 | 2024 | 2025 | 2026 | 2027 | 2028 | 2029 | 2030 | |||||||||||
|
Development |
35,833 | 15,935 | 12,646 | 6,996 | 256 | 0 | 0 | 0 | 0 | 0 | ||||||||||||
|
Exploration |
24,324 | 7,224 | 7,405 | 5,166 | 2,460 | 1,260 | 660 | 150 | 0 | 0 | ||||||||||||
|
Providencia Mine |
6,895 | 2,204 | 4,690 | 0 | 0 | 0 | 0 | 0 | 0 | 0 | ||||||||||||
| El Silencio Mine |
22,090 | 6,439 | 6,971 | 5,259 | 2,421 | 500 | 250 | 250 | 0 | 0 | ||||||||||||
| Sandra K |
7,356 | 3,810 | 2,567 | 979 | 0 | 0 | 0 | 0 | 0 | 0 | ||||||||||||
|
Carla |
4,647 | 2,049 | 2,534 | 64 | 0 | 0 | 0 | 0 | 0 | 0 | ||||||||||||
| Mine Engineering |
1,917 | 590 | 531 | 265 | 265 | 133 | 133 | 0 | 0 | 0 | ||||||||||||
| Geology Expl. |
2,853 | 2,853 | 0 | 0 | 0 | 0 | 0 | 0 | 0 | 0 | ||||||||||||
| Small Mining |
84 | 84 | 0 | 0 | 0 | 0 | 0 | 0 | 0 | 0 | ||||||||||||
|
Mill |
3,978 | 1,312 | 950 | 660 | 420 | 360 | 190 | 86 | 0 | 0 | ||||||||||||
|
Laboratory |
969 | 404 | 200 | 140 | 100 | 70 | 35 | 20 | 0 | 0 | ||||||||||||
|
Maintenance |
1,314 | 314 | 320 | 240 | 180 | 140 | 80 | 40 | 0 | 0 | ||||||||||||
|
Civils |
134 | 19 | 40 | 20 | 20 | 15 | 10 | 10 | 0 | 0 | ||||||||||||
|
Logistics |
166 | 61 | 30 | 22 | 18 | 15 | 10 | 10 | 0 | 0 | ||||||||||||
|
Environment |
17,866 | 3,626 | 4,090 | 2,800 | 4,950 | 1,200 | 1,200 | 0 | 0 | 0 | ||||||||||||
|
O&H |
2,353 | 1,039 | 580 | 230 | 155 | 171 | 158 | 20 | 0 | 0 | ||||||||||||
|
Administration |
1,475 | 654 | 293 | 165 | 165 | 145 | 53 | 0 | 0 | 0 | ||||||||||||
|
IT |
1,916 | 1,610 | 112 | 74 | 45 | 47 | 29 | 0 | 0 | 0 | ||||||||||||
|
Security |
1,334 | 992 | 120 | 60 | 40 | 70 | 52 | 0 | 0 | 0 | ||||||||||||
| Mine Closure |
10,852 | 0 | 0 | 0 | 3,018 | 1,274 | 749 | 749 | 4,827 | 235 | ||||||||||||
| TSF Closure |
3,098 | 60 | 0 | 828 | 828 | 276 | 276 | 830 | 0 | 0 | ||||||||||||
| Total | 151,453 | 51,278 | 44,078 | 23,968 | 15,342 | 5,675 | 3,885 | 2,165 | 4,827 | 235 |
Source: GCM/SRK, 2022
| 21.2 | Operating Cost Estimates |
SRK and GCM prepared the estimate of operating costs for the reserves production schedule. These costs were subdivided into the following operating expenditure categories:
| • | Mining |
| • | Processing |
| • | Site G&A |
The resulting LoM cost estimate is presented in Table 21-9.
Table 21-9: Segovia Operating Costs Summary
| Description | LoM (US$000s) | LoM (US$/t-Ore) | LoM (US$/oz-Au) | |||||||||||
|
Mining |
365,010 | 159.36 | 541.62 | |||||||||||
|
Process |
76,489 | 33.39 | 113.50 | |||||||||||
|
G&A |
57,917 | 25.29 | 85.94 | |||||||||||
|
Total Operating |
499,416 | 218.04 | 741.06 | |||||||||||
Source: GCM, 2022
| 21.2.1 | Basis for the Operating Cost Estimate |
The operating cost is based on budgetary estimates from GCM, reviewed by SRK, and modeled as variable costs.
The prepared estimates that compose the operating costs consist of domestic and international services, equipment, labor, etc. Where required, the following were included:
|
BP/KD |
May 2022 |
| SRK Consulting (U.S.), Inc. NI 43-101 Technical Report – Segovia 2021 PFS Update |
Page 369 |
| • | Value added tax |
| • | Freight |
| • | Duty |
The mill operates an average of 340 days per year under a daily schedule of three shifts of eight hours.
The operating cost estimates are based on the quantities associated with the production schedule, including the following:
| • | Waste removal |
| • | RoM |
| • | Contract Miner |
All operating costs include supervision staff, operations labor, maintenance labor, consumables, electricity, fuels, lubricants, maintenance parts and any other operating expenditure identified by contributing engineers.
Site-specific budget estimates were used to estimate the LoM operating costs for Providencia, Sandra K, El Silencio and Carla. The mine production is also supported by contract miner operations, which operate in areas of Providencia (Masora) and El Silencio (Navar). These contractors are paid based on a cost per recovered (Mine and Plant Recovery) gold ounces, which LoM average is estimated at US$677/recovered Au-oz. Note that LoM/yearly variable operating costs vary due to this.
Table 21-10 and Table 21-11show the variable budget estimates for each mining area.
Table 21-10: Segovia Mining Costs
|
|
Description | |
LoM (US/t) |
|
|
2022 (US$/t- ore) |
|
|
2023 (US$/t- ore) |
|
|
2024 (US$/t- ore) |
|
|
2025 (US$/t- ore) |
|
|
2026 (US$/t- ore) |
|
|
2027 (US$/t- ore) |
|
|
2028 (US$/t- ore) |
| |||||||||
| Providencia |
128.51 | 127.73 | 128.24 | 130.00 | 0.00 | 0.00 | 0.00 | 0.00 | ||||||||||||||||||||||||||
| Sandra K |
107.25 | 109.08 | 101.17 | 108.69 | 117.16 | 116.90 | 0.00 | 0.00 | ||||||||||||||||||||||||||
| Carla |
141.90 | 139.84 | 130.48 | 151.30 | 156.59 | 0.00 | 0.00 | 0.00 | ||||||||||||||||||||||||||
| El Silencio |
136.96 | 125.01 | 125.46 | 131.94 | 138.30 | 148.35 | 149.77 | 140.47 |
Source: GCM, 2022
Table 21-11: Segovia Processing and G&A Costs
|
|
Description | |
LoM (US/t) |
|
2022 (US$/ t- ore) |
2023 (US$/t- ore) |
|
2024 (US$/t- ore) |
|
2025 (US$/t- ore) |
|
2026 (US$/t- ore) |
|
|
2027 (US$/t- ore) |
|
|
2028 (US$/t- ore) |
| |||||||||
| Process |
29.19 | 28.01 | 28.50 | 29.88 | 29.92 | 30.38 | 30.86 | 29.89 | ||||||||||||||||||||
| Lab |
4.20 | 4.00 | 4.00 | 4.56 | 3.91 | 5.09 | 4.07 | 4.22 | ||||||||||||||||||||
| Other |
25.29 | 23.86 | 22.43 | 26.00 | 29.05 | 33.08 | 25.73 | 20.62 |
Source: GCM, 2022
The unit costs presented above are used in combination with the reserves production schedule to estimate the operating costs. The resulting operating costs are presented in Table 21-12.
|
BP/KD |
May 2022 |
| SRK Consulting (U.S.), Inc. NI 43-101 Technical Report – Segovia 2021 PFS Update |
Page 370 |
Table 21-12: Segovia Operating Costs ($000’s)
| LoM | 2022 | 2023 | 2024 | 2025 | 2026 | 2027 | 2028 | |||||||||
| Description | ($000s) | ($000s) | ($000s) | ($000s) | ($000s) | ($000s) | ($000s) | ($000s) | ||||||||
| Providencia |
41,987 | 15,436 | 15,503 | 11,048 | 0 | 0 | 0 | 0 | ||||||||
| Sandra K |
42,798 | 14,441 | 13,340 | 9,909 | 4,322 | 786 | 0 | 0 | ||||||||
| Carla |
10,244 | 3,288 | 2,808 | 3,005 | 1,143 | 0 | 0 | 0 | ||||||||
| El Silencio |
140,358 | 19,286 | 18,264 | 20,761 | 21,356 | 24,835 | 21,472 | 14,384 | ||||||||
| Masora |
13,395 | 9,209 | 4,186 | 0 | 0 | 0 | 0 | 0 | ||||||||
| Navar |
109,716 | 41,544 | 31,159 | 21,906 | 15,107 | 0 | 0 | 0 | ||||||||
| Process |
66,869 | 15,958 | 15,486 | 14,002 | 8,648 | 5,290 | 4,424 | 3,061 | ||||||||
| Lab |
9,620 | 2,279 | 2,173 | 2,136 | 1,131 | 886 | 584 | 432 | ||||||||
|
Other |
57,917 | 13,591 | 12,185 | 12,185 | 8,394 | 5,761 | 3,689 | 2,112 |
Source: GCM, 2022
|
BP/KD |
May 2022 |
| SRK Consulting (U.S.), Inc. NI 43-101 Technical Report – Segovia 2021 PFS Update |
Page 371 |
| 22 | Economic Analysis |
The financial results presented here are based on monthly inputs from the production schedule prepared by GCM and reviewed by SRK. All financial data is fourth quarter 2021 and currency is in U.S. dollars (US$), unless otherwise stated.
| 22.1 | External Factors |
GCM currently has a long-term supply agreement for the sale of its products. The costs and discounts associated with the sales of the products are based on this agreement. This study was prepared under the assumption that the Project will sell doré containing gold.
Table 22-1 presents the prices used in the cashflow model, which were also used for reserves calculations. SRK did not include silver in this analysis, even though silver production has regularly and consistently been reported as a small by-product in gold produced in the Maria Dama plant, which has been operating for decades. There are no silver assays and this metal is not included in the resources nor the reserves.
Table 22-1: Segovia Price Assumptions
| Description | Value | Unit | ||||
|
Gold |
1,650 | US$/oz |
Source: GCM, 2021
Treatment charges and net smelter return (NSR) terms are summarized in Table 22-2.
Table 22-2: Segovia Net Smelter Return Terms
| Description | Value | Units | ||||
|
Doré |
||||||
| Payable Gold |
100% | |||||
|
Doré Smelting & Refining Charges 1 |
8.25 | US$/oz-Au |
Source: GCM, 2022
Notes:
| 1. | Reserves cut-off grade (CoG) used $6/oz smelting and refining charges, based in the previous year PFS report. Costs/prices used in the CoG may differ to those in the final economic model. This is due to the need to make assumptions early on for mine planning prior to finalizing other items and using long term forecasts for the life of mine plan. |
The doré production is sold at the mine gate, therefore, no transportation costs are considered in this analysis.
| 22.2 | Principal Assumptions and Input Parameters |
Common prices for consumables, labor, fuel, lubricants and explosives were used by all engineering disciplines to derive capital and operating costs. Included in the labor costs are shift differentials, vacation rotations, all taxes and the payroll burdens. All currency is in 2021 U.S. dollars (US$) unless otherwise stated.
No pre-production has been considered, as this a currently operating mine. RoM production is based on an average assumed LoM mine material movement of 1,534t/d (365 days/yr basis). The mine schedule does not include stockpiling as all blending of RoM is done in the mine.
Table 22-3 presents the yearly LoM mine production assumptions by area.
|
BP/KD |
May 2022 |
| SRK Consulting (U.S.), Inc. NI 43-101 Technical Report – Segovia 2021 PFS Update |
Page 372 |
Table 22-3: Segovia Yearly Mine Production Assumptions
| Total | 2022 | 2023 | 2024 | 2025 | 2026 | 2027 | 2028 | |||||||||||||||||||||||||
| Providencia |
||||||||||||||||||||||||||||||||
| Own Production Ore |
326,724 | 120,846 | 120,892 | 84,987 | - | - | - | - | ||||||||||||||||||||||||
| Masora Ore |
31,657 | 22,059 | 9,598 | - | - | - | - | - | ||||||||||||||||||||||||
| Ore Tonnes (t) |
358,381 | 142,905 | 130,490 | 84,987 | - | - | - | - | ||||||||||||||||||||||||
| Head Grade (g/t) |
11.10 | 13.44 | 11.37 | 6.76 | - | - | - | - | ||||||||||||||||||||||||
| Contained Gold (oz) |
127,927 | 61,747 | 47,717 | 18,463 | - | - | - | - | ||||||||||||||||||||||||
|
Sandra K |
| |||||||||||||||||||||||||||||||
| Ore Tonnes (t) |
399,036 | 132,392 | 131,861 | 91,170 | 36,889 | 6,724 | - | - | ||||||||||||||||||||||||
| Head Grade (g/t) |
8.01 | 8.03 | 8.72 | 6.69 | 9.24 | 4.68 | - | - | ||||||||||||||||||||||||
| Contained Gold (oz) |
102,754 | 34,201 | 36,966 | 19,620 | 10,955 | 1,012 | - | - | ||||||||||||||||||||||||
|
Carla |
| |||||||||||||||||||||||||||||||
| Ore Tonnes (t) |
72,193 | 23,512 | 21,521 | 19,861 | 7,299 | - | - | - | ||||||||||||||||||||||||
| Head Grade (g/t) |
9.55 | 7.82 | 13.29 | 8.45 | 7.06 | - | - | - | ||||||||||||||||||||||||
| Contained Gold (oz) |
22,157 | 5,911 | 9,197 | 5,393 | 1,656 | - | - | - | ||||||||||||||||||||||||
|
El Silencio |
| |||||||||||||||||||||||||||||||
| Own Production Ore |
1,024,797 | 154,282 | 145,577 | 157,349 | 154,419 | 167,405 | 143,362 | 102,402 | ||||||||||||||||||||||||
| Navar Ore |
436,067 | 116,558 | 113,892 | 115,231 | 90,386 | - | - | - | ||||||||||||||||||||||||
| Ore Tonnes (t) |
1,460,863 | 270,839 | 259,469 | 272,581 | 244,805 | 167,405 | 143,362 | 102,402 | ||||||||||||||||||||||||
| Head Grade (g/t) |
10.47 | 13.99 | 12.39 | 10.67 | 9.65 | 9.15 | 7.02 | 4.74 | ||||||||||||||||||||||||
| Contained Gold (oz) |
491,824 | 121,799 | 103,398 | 93,509 | 75,935 | 49,226 | 32,366 | 15,591 | ||||||||||||||||||||||||
|
TOTAL |
| |||||||||||||||||||||||||||||||
| Ore Tonnes (t) |
2,290,473 | 569,648 | 543,341 | 468,598 | 288,994 | 174,128 | 143,362 | 102,402 | ||||||||||||||||||||||||
| Head Grade (g/t) |
10.11 | 12.21 | 11.29 | 9.09 | 9.53 | 8.97 | 7.02 | 4.74 | ||||||||||||||||||||||||
| Contained Gold (oz) |
744,662 | 223,658 | 197,279 | 136,985 | 88,546 | 50,238 | 32,366 | 15,591 | ||||||||||||||||||||||||
Source: GCM/SRK, 2022
Figure 22-1 shows the yearly production profile of the Project. RoM ore production varies from 362 t/d to 1,747 t/d, with a higher waste extraction in the first two years and a declining gold head grade over the LoM.
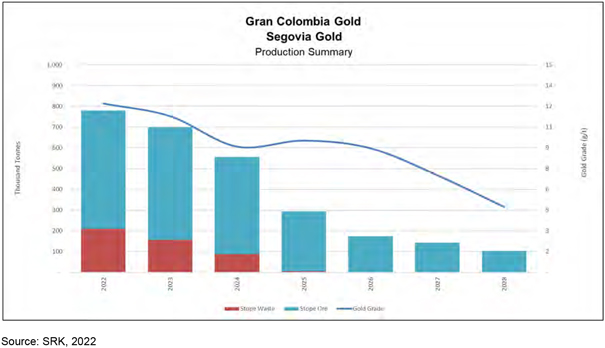
Figure 22-1: Segovia Mine Production Profile
|
BP/KD |
May 2022 |
| SRK Consulting (U.S.), Inc. NI 43-101 Technical Report – Segovia 2021 PFS Update |
Page 373 |
The average mill feed is 996 t/d (based on 340 days per year of mill operation and availability) over the LoM. The current process feed capacity is approximately 1,750 t/d. The processing circuit is designed to recover doré containing gold. Table 22-4 presents the projected LoM combined plant production.
Table 22-4: Segovia LoM Mill Production Assumptions
| Description | Value | Units | ||||
|
RoM Ore Milled |
2,290 | kt | ||||
|
Avg. Daily Capacity |
996 | t per day | ||||
|
Doré | ||||||
|
Moisture Content |
0% | |||||
| Gold Content |
673.9 | koz | ||||
|
Recovery | ||||||
|
Gold |
90.5% | |||||
|
Doré Yield |
673.9 | koz | ||||
| Source: SRK, 2022 |
||||||
All figures presented are based on the production derived from the reserves disclosed in this report. The mine currently has a third-party ore tolling program that is not supported by the reserves, and hence these quantities were not included in the production schedule. SRK is also aware that the mineral processing recovers silver in the doré product, but as silver was not included in the resources/reserves, and it is not included in the economics.
| 22.3 | Taxes, Royalties and Other Interests |
Analysis of the Segovia Project includes an effective corporate income tax rate of 35, resulting in a LoM average rate of 35% for income taxes on taxable income. Value Added Tax (VAT) is included in the capital costs estimate and a part of it can be directly deducted from the corporate income tax. Approximately US$3.8M of VAT credits were deducted from the income tax, bringing the effective LoM income tax rate to an average of 34.2%.
A depreciation schedule was calculated by SRK assuming an eight-and-a-half-year straight-line depreciation.
Taxable income is discounted by future and installed asset depreciation. The Project currently holds US$14.3M of undepreciated assets that are projected to be completely depreciated by December 2024. Approximately 0.2% of the revenues were considered as non-deducible costs and removed from the depreciation schedule.
Royalties are also deducted from taxable income. The Project includes payment of a governmental royalty on both gold and silver sales. The royalty due is calculated as 80% of 4.4% of gross metal sales, not including the costs of transportation and metal refining.
| 22.4 | Results |
The valuation results of the Segovia Project indicate that the Project has an after-tax Net Present Value (NPV) of approximately US$241.6M, based on a 5% discount rate. The operation is cash flow positive except in the last two years and this is related to closure cost. Revenue generation steadily decreases year over year due to a decline of the gold grade. The annual free cash flow profile of the Project is presented in Figure 22-2. The full annual TEM is located in Appendix E.
|
BP/KD |
May 2022 |
| SRK Consulting (U.S.), Inc. NI 43-101 Technical Report – Segovia 2021 PFS Update |
Page 374 |

Figure 22-2: Segovia After-Tax Free Cash Flow, Capital and Metal Production
Indicative economic results are presented in Table 22-5. The Project is a gold operation, with gold representing 100% of the total projected revenue. The underground mining cost is the heaviest burden on the operation, followed by the sustaining capital as a distant second.
Table 22-5: Segovia Indicative Economic Results
| Description | Value | Units | ||||
|
|
Market Prices | |||||
| Gold (US$/oz) |
1,650 | US$/oz | ||||
|
Estimate of Cash Flow (all values in $000s) | ||||||
|
Concentrate Net Return | ||||||
| Gold Sales |
1,111,966 | $000s | ||||
| Silver Sales |
0 | $000s | ||||
| Total Revenue |
1,111,966 | $000s | ||||
|
Smelting and Refining Charges |
(5,560) | $000s | ||||
|
Freight & Impurities |
0 | $000s | ||||
| Net Smelter Return |
1,106,406 | $000s | ||||
|
Royalties |
(39,141) | $000s | ||||
| Net Revenue |
1,067,265 | $000s | ||||
|
Operating Costs | ||||||
|
Underground Mining |
(365,010) | $000s | ||||
|
Process |
(76,489) | $000s | ||||
|
G&A |
(57,917) | $000s | ||||
|
Total Operating |
(499,416) | $000s | ||||
|
Operating Margin (EBITDA) |
567,850 | $000s | ||||
| Initial Capital |
0 | $000s | ||||
| LoM Sustaining Capital |
(151,453) | $000s | ||||
| Working Capital |
3,770 | $000s | ||||
| Income Tax |
(156,149) | $000s | ||||
| After Tax Free Cash Flow |
264,017 | $000s | ||||
| NPV @: 5% |
241,584 | $000s | ||||
Source: SRK, 2022
|
BP/KD |
May 2022 |
| SRK Consulting (U.S.), Inc. NI 43-101 Technical Report – Segovia 2021 PFS Update |
Page 375 |
Table 22-6 shows annual production and revenue forecasts for the life of the Project. All production forecasts, material grades, plant recoveries and other productivity measures were developed by SRK and GCM.
Table 22-6: Segovia LoM Annual Production and Revenues
| Period | RoM (kt) | Plant Feed (kt) | Doré (koz) | Free Cash Flow (US$000s) |
Discounted Cash Flow (US$000s) |
|||||||||||||||||
| 2022 | 569.65 | 569.65 | 202.41 | 81,149 | 79,193 | |||||||||||||||||
| 2023 | 543.34 | 543.34 | 178.54 | 74,388 | 69,351 | |||||||||||||||||
| 2024 | 468.60 | 468.60 | 123.97 | 50,108 | 44,581 | |||||||||||||||||
| 2025 | 288.99 | 288.99 | 80.13 | 31,805 | 26,894 | |||||||||||||||||
| 2026 | 174.13 | 174.13 | 45.47 | 20,722 | 16,680 | |||||||||||||||||
| 2027 | 143.36 | 143.36 | 29.29 | 10,455 | 8,064 | |||||||||||||||||
| 2028 | 102.40 | 102.40 | 14.11 | 464 | 331 | |||||||||||||||||
| 2029 | 0.00 | 0.00 | 0.00 | (4,827 | ) | (3,355 | ) | |||||||||||||||
| 2030 | 0.00 | 0.00 | 0.00 | (235 | ) | (156 | ) | |||||||||||||||
| Total | 2,290.47 | 2,290.47 | 673.92 | $ | 264,030 | $ | 241,584 | |||||||||||||||
Source: SRK, 2022
The estimated cash cost, including direct and indirect production costs, is US$807/Au-oz, while All-in Sustaining Costs (AISC), including sustaining capital, is US$1,032/Au-oz, Table 22-7 presents the make-up of the Segovia cash costs.
Table 22-7: Segovia Cash Costs1
| Cash Costs | $000’s | |||
| Direct Cash Cost |
||||
| Mining Cost |
365,010 | |||
| Process Cost |
76,489 | |||
| Site G&A Cost |
57,917 | |||
|
Smelting & Refining Charges |
5,560 | |||
| C1 Direct Cash Costs |
504,975 | |||
| $/t-ore |
220.47 | |||
| $/Au-oz |
749.31 | |||
| Indirect Cash Cost |
||||
|
Royalties |
39,141 | |||
|
Indirect Cash Costs |
39,141 | |||
| $/t-ore |
17.09 | |||
| $/Au-oz |
58.08 | |||
| Total Direct + Indirects Cash Costs |
544,117 | |||
| $/t-ore |
237.56 | |||
| $/Au-oz |
807.39 | |||
|
Sustaining Capital Cash Cost (US$/Au-oz) |
224.74 | |||
| All-In Sustaining Costs (US$/Au-oz) |
$1,032.13 |
Source: SRK, 2022
Notes:
| 1. | SRK’s standard Cash Cost reporting methodology for NI 43-101 reports includes smelting/refining costs; whereas GCM’ basis of reporting treats these costs as a reduction of realized gold price (the refinery discounts the selling price by a factor to cover these charges) and excludes them from its reported “total cash cost per ounce” |
| 22.5 | Sensitivity Analysis |
Sensitivity to discount rates and different metal price scenarios were conducted.
The following metal price scenarios were considered:
|
BP/KD |
May 2022 |
| SRK Consulting (U.S.), Inc. NI 43-101 Technical Report – Segovia 2021 PFS Update |
Page 376 |
| • | Distressed metal prices are 20% lower than neutral prices (US$1,280/oz Au) |
| • | Neutral metal prices as presented in this section (US$1,600/oz Au) |
| • | Robust metal prices are 20% higher than neutral prices (US$1,920/oz Au) |
The results are presented in Figure 22-3 and Figure 22-4
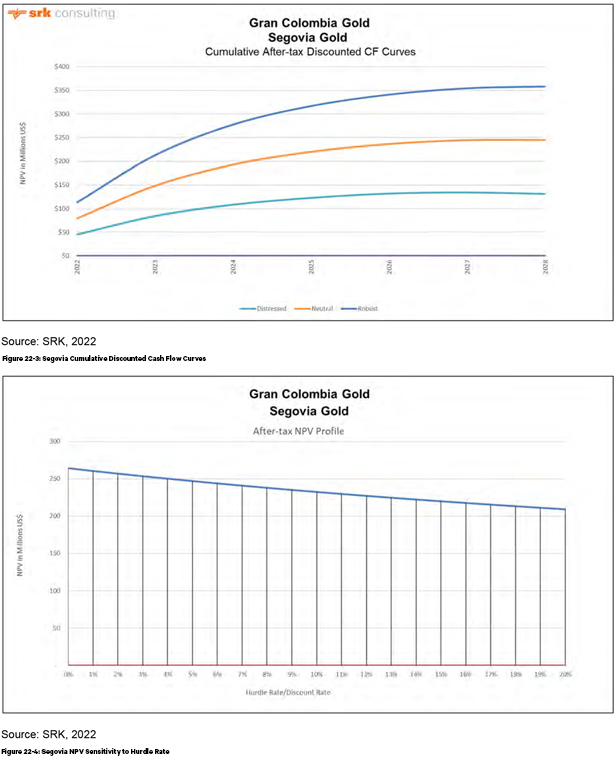
|
BP/KD |
May 2022 |
| SRK Consulting (U.S.), Inc. NI 43-101 Technical Report – Segovia 2021 PFS Update |
Page 377 |
A sensitivity analysis on variation of Project costs, both capital and operating, and metal prices indicated that the cash generation is most sensitive to reduction in metal prices, or possibly loss on metal recovery, and secondly to an increase in capital cost. Figure 22-5 shows net present value sensitivity.
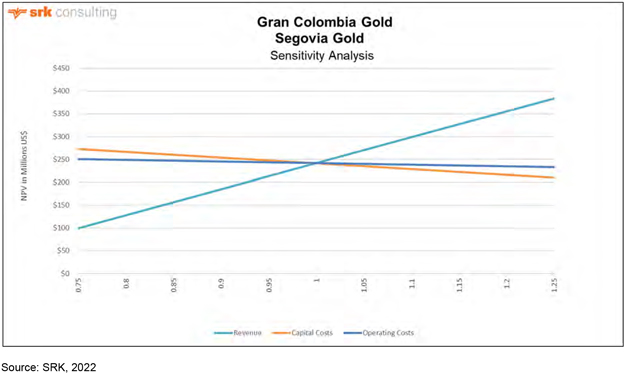
Figure 22-5: Segovia NPV Sensitivity (US$000’s)
|
BP/KD |
May 2022 |
| SRK Consulting (U.S.), Inc. NI 43-101 Technical Report – Segovia 2021 PFS Update |
Page 378 |
| 23 | Adjacent Properties |
There are no properties adjacent to the Project with NI 43-101 compliant Mineral Resources. There are however other properties adjacent to the Project currently being mined by others.
|
BP/KD |
May 2022 |
| SRK Consulting (U.S.), Inc. NI 43-101 Technical Report – Segovia 2021 PFS Update |
Page 379 |
| 24 | Other Relevant Data and Information |
In addition to the PFS mine plan described in this report, there are a few items to note which would have an effect on the mining operations and economics presented herein. These items include:
| • | Mining in additional areas, currently classified as Inferred - There is Inferred material at all four mining areas discussed in this PFS. This material is located near existing/planned infrastructure which require minimal development to mine. If this Inferred material is further drilled and converts to reserves, particularly in the Providencia and El Silencio areas, then mining can continue longer in the existing mining areas. This would allow for deferring development capital to later years (i.e., ramp not necessary as quickly). Also, if some of the Inferred material is higher grade, it can displace lower grade material and increase the ounces produced. Historically, GCM has been mining this additional Inferred material as they are able to access it. |
| • | Additional material, mined by others, going to the Maria Dama process facility – Some additional plant capacity is available at times and is used to process third-party material. Table 24-1 shows the tonnages and grades of the additional material processed since 2017. This material is not included in the economics shown in this report. |
Table 24-1: Additional Material at the Maria Dama Process Facility (2017 to 2021)
| Processed at Maria Dama Plant | ||||||||||||||||||||||
| 2017 | 2018 | 2019 | 2020 | 2021 | ||||||||||||||||||
| Tonnes (t) | 84,058 | 67,897 | 84,313 | 93,179 | 103,516 | |||||||||||||||||
| Grade (g/t) | 4.61 | 5.74 | 6.82 | 8.46 | 11.34 | |||||||||||||||||
| Recovery (%) | 90.40 | % | 89.46 | % | 90.02 | % | 90.02 | % | 89.86 | % | ||||||||||||
| Recovered Au oz (oz) | 11,254 | 11,219 | 16,646 | 22,817 | 33,957 | |||||||||||||||||
Source: GCM, 2021
GCM has a history of mining/converting Inferred material and receiving third-party material at the process facility.
| • | Recovered Silver – There is a history of recovering silver at the process facility. Currently silver is not included in the resource nor the reserve. Table 24-2 shows the recent silver recovery by year. Overall this gives approximately 1% to 2% additional revenue. |
|
BP/KD |
May 2022 |
| SRK Consulting (U.S.), Inc. NI 43-101 Technical Report – Segovia 2021 PFS Update |
Page 380 |
Table 24-2: Segovia Historical Gold and Silver Production 2007 to 2020
| Year | Au production (oz) | Ag production (oz) | Ag as % of Au | |||||||||||
| 2007 | 38,244 | 45,821 | 119.80 | % | ||||||||||
| 2008 | 33,460 | 44,426 | 132.80 | % | ||||||||||
| 2009 | 55,216 | 41,868 | 75.80 | % | ||||||||||
| 2010 | 50,313 | 51,780 | 102.90 | % | ||||||||||
| 2011 | 69,176 | 64,633 | 93.40 | % | ||||||||||
| 2012 | 79,178 | 88,856 | 112.20 | % | ||||||||||
| 2013 | 80,226 | 113,734 | 141.80 | % | ||||||||||
| 2014 | 74,506 | 91,109 | 122.30 | % | ||||||||||
| 2015 1 | 92,539 | 82,910 | 89.60 | % | ||||||||||
| 2016 1 | 126,022 | 111,053 | 88.10 | % | ||||||||||
| 2017 1 | 148,594 | 121,843 | 82.00 | % | ||||||||||
| 2018 | 193,050 | 160,955 | 83.37 | % | ||||||||||
| 2019 | 214,241 | 187,820 | 87.67 | % | ||||||||||
| 2020 | 196,362 | 186,122 | 94.79 | % | ||||||||||
| 20211 | 207,362 | 253,597 | 122.30 | % | ||||||||||
Source: GCM, 2021
Notes:
1. Adjusted to exclude Au and Ag (1) sourced from third-party not processed at Maria Dama and (2) produced in the polymetallic recovery plant which commenced operations in the fourth quarter of 2021
| • | Increasing process facility capacity - GCM processes ore in its Maria Dama process plant which has been expanded to 1,500-metric ton per day capacity in 2020. A potential further process facility expansion to 2,000 t/d is being contemplated, if proven to be necessary, for some time in the future. This is not included in this report/economics. It is envisioned the additional mill feed would come from either an increase in GCM production as a result of further exploration or from third-party miners in its title. The estimated time to upgrade the facility is approximately one year, at a cost of approximately US$5 to US$6 million. This capital estimate is not included in this report/economics at this time. |
| • | Las Verticales - The Las Verticales area is located adjacent to Providencia and requires little development to access. The area would need additional drilling and could be a source of additional material close to existing infrastructure. Las Verticales has not been included in the PFS reserve analysis, but is an Inferred resource included in the resource summary in the PFS. This area is currently being mined near surface by third party miners and this material has been sent to the Maria Dama plant for the last 10 years. |
|
BP/KD |
May 2022 |
| SRK Consulting (U.S.), Inc. NI 43-101 Technical Report – Segovia 2021 PFS Update |
Page 381 |
| 25 | Interpretation and Conclusions |
| 25.1 | Geology and Resources |
SRK considers the exploration data accumulated by GCM is generally reliable, and suitable for this MRE. SRK undertook a laboratory audit of the mine laboratory during previous site inspections and has previously visited the SGS sample preparation and fire assay facilities in Medellin and found it to be clean, organized, with the correct equipment and procedures in place to ensure quality is maintained.
Infill drilling along with the on-going validation work of the historical database, and surveying of the underground mine works has resulted in an increase in the Mineral Resources at Segovia. It is SRK’s opinion that improvements have been made from previous models but that further improvements can still be made to the geological database (namely elevations).
There are zones in all four mines where the vein coding requires detailed review to improve the geological interpretation. Correction of the vein coding will enable an improved geological model which can aid exploration planning and identifying possible areas where parallel veins exist, which would provide additional feed material within the existing infrastructure.
Improvements in this integration has resulted in improved modelling of the structures at El Silencio, which has helped to increase the Mineral Resources within the mine, and present new exploration potential within splays of the main veins. At El Silencio the geological team has advanced the current geological interpretation to account for a number of splays or sub-parallel structures. In 2021, further work has been completed to integrate local mine geology and mine planning into the current estimates on a number of smaller high-grade structures. These areas have resulted in a significant growth in the Mineral Resource (namely v1040) and show the potential to add further Resources within continued work within the deposit.
Additional validation work on the historical datasets at Sandra K within the PAT and JUL veins in the Cogote area of the mine, have resulted in a significant increase in the Mineral Resources. The Exploration team of GCM completed the verification of the historic information (historical reports, paper maps, etc.), including the validation of information and digitizing of the UG working and sampling data. The database was generated for the Vera project which included the transformation of the information to the current coordinate system and the units of length and weight to the metric system. SRK currently considers the current levels of confidence within these areas to only be sufficient to define Inferred Mineral Resources.
Further to this in relation to the required improvements to data quality, SRK recommends the following:
| • | Creation of a 3D interpretation of all mining development and stoped areas will help guide exploration |
| • | Continued infill drilling using underground drill-rigs ahead of the planned mining faces to a minimum of 20 m by 20 m pattern |
| • | SRK recommends that GCM look towards the use of localized short-term planning models to improve the understanding of the short scale variation in grade and improve the potential to monitor the current estimates. These short-term models should include results from the infill underground drilling areas and adjustments to the high-grade domain boundaries. The mine |
|
BP/KD |
May 2022 |
| SRK Consulting (U.S.), Inc. NI 43-101 Technical Report – Segovia 2021 PFS Update |
Page 382 |
geology team of GCM has recently generated some short-term models for some veins and locations. This should be implemented for all the mines including the design and apply a reconciliation protocol.
SRK has reviewed the current exploration potential at Segovia which can be summarized as follows:
| • | Continuation of drilling at depth targeting high-grade shoots within VEM and NAL veins, drilling during 2020 indicates there are potentially two shoots with a portion of lower grades in between, these will require additional drilling where possible from the current fan drilling, or via a new parent hole. |
| • | At Providencia there is potential shown on the eastern fault block which represents an uplift in the location of the vein due to faulting. Initial drilling has encouraging results in an area where the vein has previously been considered to feather out into more discontinuous structures. |
| • | Brownfields exploration in the proximity to Providencia exists within the Cristales, San Nicolas veins to the north of the El Silencio and Sandra K mines respectively, and the Mamajito vein which exists in the hangingwall to the current Providencia mine. These veins has been historically mined and represent further opportunity to increase the Mineral Resource basis in the future similar to the Vera additions in 2021. |
| • | At Sandra K the potential areas to increase the current Mineral Reserves and potentially add additional material to future mine plans, include: |
| o | Further verification channel samplings and drilling down-drip of the historical PAT and JUL veins. These veins are known to extend to depth based on the 2019 drilling programs and 2020 – 2021 validation work. The results of the 2021 work indicate these veins have higher than the average grades at Sandra K. If the dip extension of the existing mines is targeted this could provide additional Mineral Resources. |
| o | Data capture continued on the Vera [VER] vein to the south east of the current Sandra K. SRK recommends continuing the surveying of mined areas, which to date have been sterilized by SRK, and further verification of the underground channel sampling by twin sampling and continue the diamond drilling down-dip of known mineralization. |
| • | Additional data capture not currently considered for Mineral Resources exists north at the Cristales vein to the north of the El Silencio mine, and the San Nicolas veins to the north Sandra K. |
| 25.2 | Mineral Processing and Metallurgical Testing |
GCM is now planning to mine and process ore from the Carla vein, which is part of the Segovia complex and has conducted metallurgical testwork at SGS on a single test composite that was formulated from selected drillholes and intervals from the Carla vein. The metallurgical program included rougher flotation followed by cyanidation of the reground rougher concentrate using process conditions currently practiced at GCM Maria Dama process plant. In addition, whole-ore cyanidation and BWI tests were conducted. The results of this testwork demonstrated that the gold contained in ore from the Carla vein is highly recoverable using the process conditions currently in use at the Maria Dama process plant. Gold and silver recoveries were reported at about 95% and 77%, respectively. SRK has reduced the reported laboratory recoveries by 2% in order to account for inherent plant inefficiencies. As such, overall gold and silver recoveries from Carla ore are projected at 93% and 75%, respectively.
|
BP/KD |
May 2022 |
| SRK Consulting (U.S.), Inc. NI 43-101 Technical Report – Segovia 2021 PFS Update |
Page 383 |
| 25.3 | Mining & Reserves |
| 25.3.1 | Geotechnical |
The rock mass characterization and design methods are acceptable at a PFS level and comply with industrial standards and the mine designs are suitable for PFS reserve estimation. SRK considers the geotechnical information and stability analysis suitable for a PFS project level.
Due to similarities in rock mass parameters, all four mines (Providencia, El Silencio, Sandra-K and Carla) can be treated as similar for mine design parameters, even though mining heights, rooms and pillars are different sizes. The use of timber packs helps to increase the extraction ratios. However, the timber pillars must follow the recommendations provided in this report. GCM should also implement a monitoring system to identify any excessive pillar deformation that could produce room instability. SRK recommends performing first pass mining and additional pillar recovery using timber and/or cemented pillars to give an overall extraction ratio of approximately 90%.The pillar recovery proposed in this study are feasible to implement.
SRK considers that pillar recoveries proposed in the mining plan is archivable. Pillar recovery is among the most complex operations in underground mining and can place workers at risk if not performed correctly. The appropriated ground support needs to be implemented as is described in this report. The implementation is a key component to the mine plan success. Although the Segovia geotechnical team has demonstrated good pillar recovery practices, it is important to continue reviewing and updating the existing short term mining plan.
| 25.3.2 | Mine Design |
Room and pillar and cut and fill mining methods are seen as appropriate selective mining methods for the deposits. Cut and fill requires off-ore development but yields a higher extraction. A CoG has been used for identifying economic mining areas. The PFS mine life over six years. The underground mines are accessed via existing apique systems with ventilation raises to surface as necessary.
Tonnages and grades presented in the reserve include dilution and recovery and are comparable to what is currently being mined. Productivities used are based on current estimates and include some improvement over the life of the mine. A monthly production schedule was generated using Vulcan Gantt software for each mine by site personnel. The production schedule targeted the current mill capacity of approximately 502,000 t/yr.
| 25.4 | Recovery Methods |
GCM processes ore from the Providencia, El Silencio, Sandra K and Carla mines at its 1,500 t/d Maria Dama process plant which includes crushing, grinding, gravity concentration, gold flotation, cyanidation of the flotation concentrate, Merrill-Crowe zinc precipitation and refining of both the zinc precipitate and gravity concentrate to produce a final gold/silver doré product. SRK makes the following conclusions regarding GCM’s processing facilities:
| • | During the period 2019 - 2021 ore tonnes processed increased from 451,450 t at an average gold grade of 15.48 g/t Au in 2019 to 556,219 t at an average gold grade of 12.21 g/t Au in 2021. |
|
BP/KD |
May 2022 |
| SRK Consulting (U.S.), Inc. NI 43-101 Technical Report – Segovia 2021 PFS Update |
Page 384 |
| • | Gold production decreased from 214,036 oz to 206,693 oz during the period 2019 - 2021 with gold recoveries ranging from 94.7 to 95.6% over this period. |
| • | Silver recovery is not monitored but is a relatively minor contributor to overall project economics. |
| • | Process plant cash operating costs were reported at US$25.34/t during 2020 and US$25.30/t during 2021. |
| • | GCM is currently expanding the capacity of the Maria Dama process plant to 2,000 t/d. |
| 25.5 | Project Infrastructure |
The infrastructure for the Project is installed and fully functional. Ongoing work is ongoing to improve the power system and underground mine infrastructure. All major facilities are in place and have been in use for a number of years.
The El Chocho TSF have been designed with adequate capacity to manage planned compacted filter tailings deposition for the PFS LoM production schedule.
| 25.6 | Water Management |
Water supply at the site does not appear to be an issue for operations. Water is supplied from the underground mine dewatering and freshwater reservoirs adjacent to the processing areas, supplying sufficient water to meet the processing demands. No water balance was provided for the Project, so the amount of water sourced from the mine and surface water could not be determined with certainty.
Historically, water management at the tailings facilities has been problematic with surface water run-on entering the TSFs and regular releases of tailings materials and tailings decant water from the TSFs. SRK has observed increased awareness of surface water management in the operations of the TSF with new surface water diversion structures being put into place and a concerted effort to limit the discharge of tailings and untreated tailings decant water. The addition of robust water treatment system and plans for a tailing filter press will further improve water management at the site.
Closed tailings facilities are being aggressively reclaimed and incorporating surface water controls to manage the run-off from the closed facilities.
| 25.7 | Environmental Studies and Permitting |
The following interpretations and conclusions have been drawn with respect to the currently available information provided for the Segovia Project:
| • | Permitting: Developments within RPP 140 are permitted through the posting and approval of an Environmental Management Plan (PMA) and secondary permits for use of water abstraction, forest use, air emissions, discharges and river course (channel) construction. The original PMA was approved in 2004 and renewed in 2008. In 2011, environmental rights and obligations were granted to Zandor. From 2012 through 2015, updates to the operations prompted Corantioquia to request a summary of all the information into a single document. The PMA was formally accepted by Corantioquia on February 22, 2019; however, GCM successfully appealed several of the terms and conditions of the resolution, which led to the final issuance of PMA approval on November 25, 2019. |
|
BP/KD |
May 2022 |
| SRK Consulting (U.S.), Inc. NI 43-101 Technical Report – Segovia 2021 PFS Update |
Page 385 |
| • | Environmental and Social Management: Environmental and social issues are managed in accordance with the PMA. Substantial financial resources and technical specialist support are required to implement the environmental monitoring and mitigation measures presented in the PMA. |
| • | Water Management: Water management at the site has improved significantly since the introduction of the new process water treatment facility and the discontinued practice of discharging untreated mine effluents, which were contributing to contamination of local surface water courses. There is a risk that changes to the groundwater regime through underground dewatering activities of the mines may lead to geotechnical instabilities in underground workings, though ongoing hydrogeological modeling work is helping to predict and enable the development of management measures to address this risk. Post-closure water management in the underground workings has not yet been adequately evaluated or addressed. |
| • | Health and Safety of Contract Miners: GCM employs groups of contract miners to extract high grade RoM from the pillars in the operating mines. Although each mining group is required to meet contractual health, safety, and environmental standards set by GCM, there has historically been poor compliance with these standards. GCM has improved the auditing of compliance of the contract miners, but health and safety risks may be associated with uncontrolled and potentially illegal mining of support pillars, which may potentially lead to ground collapse and loss of life. |
| • | Stakeholder Engagement: Zandor/GCM has conducted a stakeholder identification and analysis program and has set stakeholder engagement objectives and goals to develop communications plans with government, community, media and small miners. A strike by mine workers in 2017 effectively shut down the local communities for over one month; GCM continues to activity engage all relevant stakeholders to try and prevent this from occurring again in the future. |
| • | Closure: The lack of detailed closure planning information and financial provisioning for the Segovia Project at present poses a risk that at the end of the mine life, insufficient funds will be available to close the site in a safe, environmentally, and socially appropriate manner. The largest uncertainty regarding closure cost is associated with the potential need for long-term treatment of water from the disused mine workings. Since GCM has not completed an assessment of the socioeconomic impacts of closure or prepared a socioeconomic transition plan for the site, there is a risk without a clear plan for transitioning the local community from a mining context to a post-mining one that there could be both socioeconomic and environmental impacts that have yet to be identified and quantified. |
There do not appear to be any other known environmental issues that could materially impact GCM’s ability to conduct mining and milling activities at the site. Preliminary mitigation strategies have been developed to reduce environmental impacts to meet regulatory requirements and the conditions of the environmental permits.
Ongoing negotiations and relationships with the artisanal and small-miner communities always remains a risk to the operation and could affect production from time to time, potentially impacting GCM’ ability to conduct mining and milling activities at the site.
|
BP/KD |
May 2022 |
| SRK Consulting (U.S.), Inc. NI 43-101 Technical Report – Segovia 2021 PFS Update |
Page 386 |
| 25.7.1 | Geochemistry |
The data acquisition program for geochemical characterization is not adequate, nor consistent with international best practice, for a project of this scale in an ore deposit possessing demonstrated potential for ARDML. The limited data collected to date indicate a risk of ARDML production from ore and waste rock, but additional characterization work is needed. Cyanide destructed tailings are acid-generating with elevated metals, whereas filter press tailings are presently net acid-neutralizing. Underground mine water is locally acidic with elevated metals, but the spatial distribution is not well characterized. Frequent monitoring of tailings chemistry should continue for the life of mine and into closure. Additional test work is recommended to better characterize the ARDML conditions for future waste rock, as well as waste rock previously extracted and used for surface fill. The mine water quality monitoring program should be expanded and should continue for the life of mine.
| 25.8 | Economic Analysis |
The estimated cash cost, including direct and indirect production cost, is US$807/Au-oz, while AISC, including sustaining capital, is US$1,032/Au-oz. Figure 25-1 presents the breakdown of the estimated all-in sustaining cash costs associated with the reserves. Direct cash costs are the clear majority of the AISC cash cost, while the sustaining capital is a distant second.

Figure 25-1: All-In Sustaining Cash Cost Breakdown
|
BP/KD |
May 2022 |
| SRK Consulting (U.S.), Inc. NI 43-101 Technical Report – Segovia 2021 PFS Update |
Page 387 |
Figure 25-2 presents the breakdown of the estimated direct cash costs associated with the reserves. Mining costs represent the clear majority of the direct costs, followed by processing and general and administrative costs.

Figure 25-2: Direct Cash Costs
The valuation results of the Segovia Project indicate that the Project has an after-tax NPV of approximately US$241.6M, based on a 5% discount rate. The operation is projected to only have negative annual cash within the closure periods. Revenue generation steadily decreases year over year, due to a decline of the gold grade. The Project is a gold operation, with gold representing 100% of the total projected revenue. The underground mining cost is the heaviest burden on the operation, followed by the sustaining capital as a distant second. Silver was not included in the analysis, as it is not included in the resources nor the reserves. It should be noted, however, that past production indicates the production of silver in the doré and its revenue could represent an addition of about 1% to 2% to the revenue presented above.
The Mineral Reserves disclosed herein are sufficient to feed the Maria Dama plant for about 6.75 years of operation.
| 25.9 | Foreseeable Impacts of Risks |
No issues of substance are currently anticipated.
|
BP/KD |
May 2022 |
| SRK Consulting (U.S.), Inc. NI 43-101 Technical Report – Segovia 2021 PFS Update |
Page 388 |
| 26 | Recommended Work Programs |
| 26.1 | Geology and Resources |
The 2021 near mine and brownfield exploration programs returned positive results, with an increase in the combined Measured and Indicated Resources of +172 thousand ounces (koz) and increases in the Inferred of +494 koz. It is recommended that GCM continues to develop additional Mineral Resources via drilling following similar procedures, which has split the program into two clear phases:
| • | Near Mines/Infill drilling totaling 44,300 m, with a focus on replacing the mined reserves from 2022, by increasing confidence via infill drilling of the current Inferred Mineral Resource, and the organic growth of Inferred Resources through the existing mines and increased geological knowledge of the vein systems. GCM has broken the program down per mine as follows: |
| o | Providencia (2,200 m) – drilling aimed to further test the deposit to the west of the deepest underground development. |
| o | El Silencio (21,500 m) – Utilizing directional drilling to extend and improve delineation of the southern high-grade shoots within Veta Manto and Veta Nacional, and to test for further continuity of the high-grade 450 vein. The 450 Vein is also tested by conventional drilling close to Level 39. Additional conventional drilling from three purpose-built stations installed off the exploration ramp starting from Level 15 of the Providencia. This drilling is aimed to test the entire Lejania sector, from the southern high-grade shoots to the southernmost end of the El Silencio Mine. |
| o | Sandra K (16,600 m) – Surface drilling to test the down plunge extension of the current high-grade shoots within the mine (southern end) |
| o | Carla (4,000 m) – Underground drilling to test the southern extension of the vein system, and to infill the current projected high-grade intersections from the 2021 resource model. The drilling program is still on standby as the station is not ready yet. More meters will depend on the results achieved. Attached images |
| • | Brownfields/Validation drilling of know historical mine areas, 21,000 m. GCM has generated a total of 10 targets within the main Segovia License, which include 3 near mine targets, and 7 distal targets. Based on internal review GCM have prioritized four targets (listed in order of priority) for the 2022 drilling program which include: |
| o | Cristales (11,300 m of which 5,000 m already drilled) – Considered as a first priority target due to historical mining in the area reported to have grades over 60 g/t Au and located to the north of the current El Silencio mine. The drilling will focus on testing for continuity of high-grade channel sampling shown on maps, following the regional trend, plus testing of a potential vein swarm within the Puerta de Sion mining sector |
| o | Marmajito (5,000 m of which 1,600 m already drilled) – It became a first priority target due to some high-grade intercepts from drilling in late 2021. Located in the hanging- wall of the Providencia mine and mined previously over numerous levels, requiring follow-up drilling to enable the definition of Mineral Resources in 2022. |
|
BP/KD |
May 2022 |
| SRK Consulting (U.S.), Inc. NI 43-101 Technical Report – Segovia 2021 PFS Update |
Page 389 |
| o | Manzanillo (3,700 m of which 700 m already drilled) – located in the footwall of the El Silencio vein with initial intersections during 2021, requiring follow-up drilling to enable the definition of Mineral Resources in 2022. |
| o | San Nicolas: A high-priority target, which has/is in production by small scale local mining, with step-out drilling planned from the current mine following the regional high- grade trends and orientation. Program on standby due to problems in reaching an agreement with the owners of the land that covers the project. |
| o | Vera: A total of 1,100 m has been drilled in 2022 at the time of reporting. |
SRK has reviewed the targets proposed by GCM for the 2022 program and considers them reasonable to potentially develop future resources. There is no guarantee that additional drilling will result in an increase in the Mineral Resources. Table 26-1 summarizes the costs for recommended work programs, based on the current approved 2022 exploration budgets, which SRK has reviewed and considers appropriate.
Table 26-1: Summary of 2020 Segovia Project in Mine and Exploration Budget
| Discipline | Program Description | Cost (US$) | ||||||
|
|
2021 Drilling Program (In Mine and Infill) | Surface and UG locations – 44,300 m total including 21,500 m @ El Silencio, 16,600 m @ Sandra K, 2,200 m @ Providencia and 4,000 m at Carla | $8,750,000 |
|||||
| 2021 Drilling Program (Brownfields) |
Brownfields from surface and UG locations (Estimate 21,000 m) |
$ | 4,200,000 | |||||
|
Total US$ |
Total 65,300 m |
$ | 12,950,000 | |||||
Source: GCM, 2022
Total cost estimated for this work is approximately US$12,950,000, which has already been included in the current 2022 budget.
| 26.2 | Mining and Mineral Reserve Estimate |
| 26.2.1 | Mining |
To continue to gain confidence in existing information, survey work should continue at all the mines. Continual improvement of the reconciliation methodologies to give quick feedback for short and long term mine planning (US$250,000).
Continue ventilation audit and modeling to increase ventilation flow rates and capacity where necessary. Fans have been installed at Providencia, El Silencio and Sandra K, the remaining fan system for Carla remains outstanding. There are also upgrades to the lower El Silencio area still outstanding (US$75,000).
| 26.2.2 | Geotechnical |
SRK recommends the following actions be implemented at the mines. Some of the actions are ongoing work and are part of the ground control management plan implemented by the Segovia geotechnical team). The following recommendations are described in priority order:
| • | Continue implementing monitoring stations at each mine, with special focus on mine access and critical infrastructure monitoring for stability. |
|
BP/KD |
May 2022 |
| SRK Consulting (U.S.), Inc. NI 43-101 Technical Report – Segovia 2021 PFS Update |
Page 390 |
| • | A stress measurement plan should be implemented to estimate the current mine induced stress conditions. |
| • | Continue collecting geotechnical data through window mapping, and increases the laboratory tests data bases, Elastic modules are recommended |
| • | Continue updating the geotechnical block model on an annual basis. |
| • | A 3D mine-scale numerical model should be prepared to simulate stress conditions due to the current mining. The model should have strength properties estimated from the geotechnical block model and the geometry should be from the current mine layout. The objective of this stress analysis is to determine stress levels in different areas of the mine from which local pillar and room stability of new mine designs can be determined. |
| • | A detailed site visit by an external specialist should be implemented at least two times a year to conduct an internal audit and ensure the proposed recommendations are in place. |
| • | Assess the pillar performance though stress measurements |
| • | After completing the Timber pack performance examine the potential for pillar replacement optimization. |
| • | SRK considers valuable for the company explore other type of pillars to reduce the uses of timber packs. |
| • | SRK estimated a total cost of US$450,000, which includes laboratory testing, stress measurement, consulting and mine scale numerical simulations. |
26.3 Recovery Methods
SRK recommends that an optimization study be performed around the Maria Dama plant to truly understand the plant limitations as well as identify areas to improve plant recovery. Total cost for this work is estimated at about US$50,000.
26.4 Project Infrastructure
26.4.1 General Infrastructure
There are no recommended work plans of substance noted at this time as the basic infrastructure is in place and functioning. The electrical system already has planning in place to allow sourcing of power more fully from both power suppliers.
26.4.2 Tailings
Based on SRK’s review of available documentation, and review of SRK’s 2019 and 2020 recommendations, the following recommendations are carried through to this 2021 PFS update:
| • | SRK recommends that site and foundation conditions encountered during preparation for Phase 2A starter embankment and TSF construction be closely inspected by a qualified geotechnical engineer and compared to KP’s 2012 geotechnical characterization and the design adjusted accordingly. |
| • | SRK recommends that the results of the tailings characterization portion of the investigation be utilized in a review of the stability analyses upon which the overall Phase 1C and Phase 2A designs were based. Aside from the site characterization specific to the geotube embankment In Phase 1A, SRK is not aware of any additional tailings characterization work. |
|
BP/KD |
May 2022 |
| SRK Consulting (U.S.), Inc. NI 43-101 Technical Report – Segovia 2021 PFS Update |
Page 391 |
| • | SRK recommends that the results of the tailings characterization portion of the geotube embankment investigation be utilized in a review of the stability analyses upon which the overall Phase 1C and Phase 2A designs were based. |
| • | SRK recommends that the results of the CPT investigation performed for characterization of the tailings behind the geotube embankment be utilized in an assessment of the liquefaction potential of the tailings both within and outside the 40 m wide compacted tailings structural zone. |
| • | SRK recommends that all stability and liquefaction analyses be evaluated for consistency with the recommendations of the ICMM Global Tailings Standard. |
| • | SRK recommends that the evaluation of the stability of the geotube embankment should be expanded to consider the existing conditions where additional geotubes and tailings have been stacked considerably higher than was observed during SRK’s 2020 site visit. |
| • | SRK recommends that new characterization data developed through the evaluation of the geotube embankment stability evaluation be combined with additional characterization data collected during construction of Phase 2A, and that these data should be considered as described above and the potential benefits of an ongoing tailings geotechnical characterization program should be evaluated. |
| • | A program of regular geochemical characterization of waste rock and tailings should be developed based on known and predicted variations in ore and waste rock or overburden geology such that potentially adverse impacts to contact water chemistry can be predicted and managed. |
| • | A dam break analysis and EAP should be prepared in accordance with accepted international standards. |
| • | SRK recommends that the 2019 OMS Manual (Wood, 2019) be reviewed and updated annually to accurately reflect ongoing operations and changes in management personnel and responsibilities. |
26.5 Water
26.5.1 Geochemistry
There are gaps that should be addressed:
| • | Contact water with waste rock on surface should be analyzed regularly |
| • | Waste rock specifically targeted for extraction and deposition on ground surface should be characterized |
| • | Future tailings should be characterized in advance of deposition |
Specific recommendations include:
| • | Sample and conduct ARDML characterization for any areas where waste rock has been deposited above ground in the project area |
| • | Initiate waste rock sampling in the underground in advance of removing the rock for surface disposal |
| • | Future humidity cell tests should be run for at least 40 weeks, and preferably one year. The data from these tests will be useful for understanding hydrochemical impacts from mining wastes |
|
BP/KD |
May 2022 |
| SRK Consulting (U.S.), Inc. NI 43-101 Technical Report – Segovia 2021 PFS Update |
Page 392 |
| • | Continue the underground water quality monitoring. Acidic water has been reported in El Silencio, and elevated metals (arsenic, cadmium, lead, zinc) have been detected in all four sampled areas. The analyses are not comprehensive and should be expanded to include a more complete suite of metals in accordance with WHO guidelines |
| • | Continue periodic sampling (e.g., quarterly) and ARDML characterization of deposited tailings; |
| • | Add environmental geochemistry testing to all future metallurgical testing |
| • | Implement/continue contact water management for all mining wastes deposited on the property |
| • | Proceed with a monitoring well installation program, with locations that should include: |
| o | Hydrologically upgradient and downgradient from the mine project area |
| o | Upgradient and downgradient from the TSF |
| o | Upgradient and downgradient from the process plant |
26.5.2 Surface Water
Studies of the hydrological setting need to be performed to establish the level of risk associated with pluvial (rainfall) derived water.
Flow monitoring on key drainages around the site should be performed to quantify the rainfall run-off relationship and establish baseline flows in the drainages impacted by the site.
A mine water balance should be developed to improve the understanding of water use, both from pluvial sources and mine dewatering water sources, in the plant and how much water is discharged to the surface water environment.
Total cost estimated for this work is approximately US$275,000.
26.5.3 Groundwater
The last hydrogeological information was the conceptual hydrogeological model developed by DHI (DHI, 2021). Currently, GCM is developing a hydrogeological study to collect hydraulic heads and hydraulic properties data. It includes five piezometers and hydraulic tests. This campaign will help with the lack of monitoring wells to evaluate the drawdown outside of the mine, the gaps on the physical parameters of the rock (hydraulic conductivity and storage) and little information on where water enters the mine (from which geologic units or structures). More field data and studies are needed to further refine knowledge on mine hydrogeology. SRK recommends the following hydrogeologic program which is designed to develop a basic understanding of the head distribution (water levels) around the mine. The existing groundwater numerical model could be updated and calibrated against the existing conditions and mine inflows which would provide large-scale information on rock properties. The program would involve four work phases and a reporting phase as described below:
| • | Complete annual mine reconnaissance, documentation of mine inflows, and estimation of direct vertical recharge into the mine. This should include a hydrogeological analysis of the main structures and fractured zones. |
| • | Update the conceptual hydrogeologic model (DHI, 2021), when new data is available. |
| • | Drill core holes into the hangingwall and footwall of the mines and equip the holes with shut- in instrumentation to allow the measurement of hydraulic head beyond the mine face. SRK recommends an additional 8 drillholes between the four primary mines that make up the |
|
BP/KD |
May 2022 |
| SRK Consulting (U.S.), Inc. NI 43-101 Technical Report – Segovia 2021 PFS Update |
Page 393 |
Segovia mine complex. Each hole would extend approximately 100 m laterally beyond the mine face and would be concentrated near the bottom of the mine, or in areas where expansion is planned. The holes will be grouted and shut in at the mine face and equipped with continuous-read transducers to record head measurements. This would require of approximately 800 m of horizontal core drilling (NG or HQ).
| • | Drill approximately six deep wells beyond the immediate mine workings to a depth of approximately 700 m. Three of these would be drilled distal and three proximal to the mine workings to allow characterization of the horizontal gradient. The result of this would be a small network of wells that would provide enough information to develop an understanding of the drawdown cone around the Segovia mines. This approach assumes that the mines collectively create a sub-regional drawdown cone formed from the cumulative effect of dewatering the primary underground mines. |
| • | Using data from previous phases to update the current groundwater numerical flow model and calibrate to existing conditions. Those conditions include water levels near and away from the mine face, and inflows to the various mines. The modeling effort will help develop an understanding of the system as a whole and will support a PFS level evaluation. Additionally, the model can be used to predict future inflows based on changing mine plans. |
| • | The work scope should include reporting and documentation. |
| • | Implement a reliable control and monitoring system of the dewatering rates in each mine and levels. Daily flowrates and monthly volumes records are recommended. |
The total cost estimated for this recommended work program is approximately US$1,000,000.
26.6 Environmental Studies and Permitting
The following recommendations are made with respect to environmental, permitting and social issues, as well as geochemistry regarding the Segovia Project:
| • | In conjunction with the mine water discharge characterization program described in Section 26.5.3, prepare a comprehensive plan to meet Colombian effluent discharge requirements by focusing on the following areas: |
| o | Complete hydrogeological investigations and modeling efforts required for underground geotechnical stability and conduct an impact analysis with respect to dewatering operations and the potential to affect surface water sources (i.e., springs). The program was initiated in 2019 but has been delayed due to COVID-19 pandemic. |
| • | To upgrade the data and knowledge pertaining to tailings geochemical characterization, the following actions are recommended: |
| o | Continue routine monitoring program of tailings and supernatant chemistry. |
| o | Although the TCLP is not recommended for use at mining sites, GCM must continue to use the method for hazardous waste assessment due to regulatory requirements. For a more comprehensive assessment consistent with mining best practices, SRK recommends parallel usage of the MEND shake flask extraction described in Price (2009). |
| o | Colombian regulations are not as environmentally protective as those of the World Health Organization (WHO). For international best practice, the more stringent regulatory criteria should be referenced. |
|
BP/KD |
May 2022 |
| SRK Consulting (U.S.), Inc. NI 43-101 Technical Report – Segovia 2021 PFS Update |
Page 394 |
| • | To upgrade the data and knowledge pertaining to waste rock geochemistry, the following actions are recommended: |
| o | The data set on waste rock is limited, so additional geochemical characterization is recommended as follows: |
| - | Conduct sampling and analysis on waste rock in advance of it being excavated |
| - | Map and conduct geochemical characterization of waste rock occurrences on ground surface |
| o | Continue to manage surface occurrences of waste rock to minimize contact water |
| • | To upgrade the data and knowledge pertaining to mine water, the following actions are recommended: |
| o | Underground water discharges should be mapped and more thoroughly characterized |
| o | Discharges should be monitored twice yearly to capture seasonal variation so that current and future actions regarding closure, treatment and other mitigation are fully informed |
| o | Monitoring wells should be installed at the following locations: |
| - | upgradient of mining facilities to characterize baseline groundwater quality |
| - | downgradient of all mine facilities (e.g., tailings, processing facilities) to monitor impacts from mining and mining-related activities |
| o | A water balance is needed to understand the quantities and management requirements for contact water. Areas of risk include mine water (e.g., dewatering effluent) and contact water associated with tailings and waste rock dumps |
| o | Water re-use and recycling are recommended to the extent possible |
| o | GCM should follow through with the commitment to plug historic and decommissioned mine portals |
| o | If possible, use the same laboratory for all analyses |
| • | In order to prepare a detailed, albeit conceptual closure plan needed to refine the closure cost estimate the following work and information would be required: |
| o | A site visit by a closure specialist or specialists to confirm conditions on the ground |
| o | Preparation of a hydrogeochemical model to predict post-closure water chemistry in the underground mine and that of any potential post-closure discharges |
| o | Creation of a hydrogeological model suitable to: |
| - | Determine post-mining water levels in the underground workings |
| - | Determine if any of the surface openings will discharge water after closure |
| - | Be used as input to the hydrogeochemical model |
| o | Updated, detailed topography at a scale suitable for estimating regrading volumes |
| o | Current aerial photography of each site |
| o | As-built drawings of all buildings and structures, if available |
| o | Compilation of current labor and equipment rates from site and any local contractors |
| o | Preparation of a socioeconomic impact assessment for closure |
| o | Preparation of a socioeconomic transitioning plan to inform the closure plan |
26.7 Recommended Work Program Costs
Costs for recommended work programs are summarized in Table 26-1.
|
BP/KD |
May 2022 |
| SRK Consulting (U.S.), Inc. NI 43-101 Technical Report – Segovia 2021 PFS Update |
Page 395 |
Table 26-1: Summary of Costs for Recommended Work
| Discipline |
Program Description |
Cost (US$) |
No Further Work is Recommende d Reason: | |||||
| *Geology and Resources |
Drilling Program (65,300 m) |
12,950,000 | Included in current budgets | |||||
| Mining & Reserves |
Additional Surveying/COG/Mining method costs |
250,000 | ||||||
| Mine Geotechnical |
Additional geotechnical programs as described in 26.2.2. |
450,000 | ||||||
| Ventilation |
Continue ventilation audit and modeling to increase ventilation flow rates and capacity where necessary. |
75,000 | Including capital installation of fans | |||||
| Infrastructure |
There are no recommended work plans of substance noted at this time as the basic infrastructure is in place and functioning | |||||||
| Tailings |
Dam Break Analysis and Emergency Action Plan |
100,000 | ||||||
| Surface Water Management |
Flow Monitoring + Mine Water Balance |
275,000 | ||||||
| Hydrogeologic Program |
Field Program + Modeling to understand water levels around the mines. |
1,000,000 | ||||||
| Recovery Method |
Plant optimization study, tailings filtration plant trade-off study. |
50,000 | ||||||
| Environmental & Permitting |
Comprehensive Water Management Plan (incl. UG dewatering impacts and post closure water quality assessment; TSF surface water seepage plan) |
0 | See hydrogeological and surface water management costs | |||||
| Geochemistry |
Tailings solids and supernatant monitoring |
10,000 | ||||||
| UG wallrock sampling & analysis |
8,000 | |||||||
|
Surface waste rock characterization |
3,500 | |||||||
|
Contact water management |
20,000 | |||||||
| Mine water monitoring |
29,000 | |||||||
|
Monitoring well installation |
112,000 | |||||||
|
Groundwater monitoring |
11,000 | |||||||
|
Tailings solids and supernatant monitoring |
10,000 | |||||||
| Mine Closure | Update conceptual mine closure plan including
socioeconomic |
80,000 | ||||||
| Total US$ | $2,483,500* | |||||||
Source: SRK, 2022
The geology and resource cost estimate is not included in the total as it is included in the current company budgets
|
BP/KD |
May 2022 |
| SRK Consulting (U.S.), Inc. NI 43-101 Technical Report – Segovia 2021 PFS Update |
Page 396 |
27 References
Amec Foster Wheeler, (2016a) Revisión Técnica del Informe de Diseńo Final – Deposito de Almacenamiento de Relaves El Chocho, Auditoría de Residuos Sólidos Industriales por Beneficio de Minerales Auríferos, prepared for Gran Colombia Gold Corp., Amec Foster Wheeler, November 2016
Amec Foster Wheeler, (2016b) Análisis del Sistema de Manejo Actual de Relaves – Alterativas de Corto, Mediano, y Largo Plazo, Auditoría de Residuos Sólidos Industriales por Beneficio de Minerales Auríferos, prepared for Gran Colombia Gold Corp., Amec Foster Wheeler, November 2016
Bonoli, (1960). Photogeological Study of the Segovia-Remedios Mining District. Maps for Frontino Gold Mines Limited, Bonoli, F 1960, large format book of 10 maps at 1:17,000 scale.
CIM (2014). Canadian Institute of Mining, Metallurgy and Petroleum Standards on Mineral Resources and Reserves: Definitions and Guidelines, May 10, 2014.
Echeverry et al., (2009). Aspectos estructurales y relaciones de algunos sistemas vetiformes del Distrito Minero Segovia-Remedios. Boletín de Ciencias de la Tierra, 26, 19-28.
González and Londoño, (2002). Instituto Colombiano de Geologia y Mineria (INGEOMINAS), 2002; pg. 68-106
Gonzalez, (2001). Mapa Geológico del Departamento de Antioquia, Memoria Explicativa. Bogota, INGEOMINAS, Gonzalez, H 241 p.
Gran Colombia, (2018). Layout drawings and design information provided in correspondence with Gran Colombia Gold Corp for Fase IA of the El Chocho tailings storage facility which is currently being constructed by Gran Colombia Gold Corp.
Haeberlin et al., (2002). Paleozoic orogenic gold deposits in the eastern Central Andes and its foreland, South America. Ore Geology Reviews, vol. 22, p. 41-59. Haeberlin, Y., Moritz, R. & Fontboté, L.,
Haeberlin et al., (2004). Carboniferous Orogenic Gold Deposits at Pataz, Eastern Cordillera, Peru: Geological and Structural Framework, Paragenesis, Alteration, and 40Ar/39Ar Geochronology. Economic Geology, vol. 99, p. 73-112. Haeberlin, Y., Moritz, R., Fontboté, L. & Cosca, M.,
Haeberlin, (2002). Geological and Structural Setting, Age, and Geochemistry of the Orogenic Gold Deposits at the Pataz Province, Eastern Andean Cordillera, Peru. PhD thesis, University of Geneva. http://www.unige.ch/cyberdocuments/theses2001/HaeberlinY/these.html.
iConsult, (2013). Presa El Chocho Para Almacenamiento de Lodos, Optimización del Volumen de Almacenamiento, Revision de Diseno Definitivo, prepared for Gran Colombia Gold Corp. Proyecto Pampa Verde, iConsult, February 2013;
IDEAM, (2013). Aguas Subterraneas en Colombia: Una Vision General, Instituto de Hidrología, Meteorología y Estudios Ambientales de Colombia, Bogota D.C., 2013.
Knight Piésold, (2012). El Chocho Tailings Storage Facility, Final Design Report, prepared for Gran Colombia Gold Corp, Segovia Project, Knight Piésold, July 2012;
|
BP/KD |
May 2022 |
| SRK Consulting (U.S.), Inc. NI 43-101 Technical Report – Segovia 2021 PFS Update |
Page 397 |
Price WA. 2009. Prediction Manual for Drainage Chemistry from Sulphidic Geologic Materials. CANMET Mining and Mineral Sciences Laboratories, Smithers, British Columbia, V0J 2N0. MEND Report 1.20.1. Canada. 579 pp.
SEWC, (2010). Medoro Resources Ltd., Gran Colombia Gold, S.A., Tapestry Resource Corp, NI43-101 Technical Report Frontino Gold Mines Ltd. Antioquia Colombia June 9, 2010 (SEWC)
Sillitoe, (2008). Major Gold Deposits and Belts of the North and South American Cordillera: Distribution, Tectonomagmatic Settings, and Metallogenic Considerations. Sillitoe, R.H., Economic Geology, vol. 103, p. 663-687.
SRK, (2012). NI 43-101 Technical Report on Zandor Capital S.A. Providencia, Las Verticales, Sandra K and El Silencio Veins at the Segovia Gold Project, Antioquia, Colombia; Prepared for Zandor Capital S.A. by SRK Consulting (UK) Ltd., Dated April 15, 2012.
SRK, (2014). NI-43-101 Technical Repot on a Preliminary Economic Assessment on the Segovia and Carla Operations, Department of Antioquia, Colombia, February 2014, 242 pp.
SRK, (2016). Technical Memorandum—Providencia Ramp Geotech Review; Prepared for Gran Colombia Gold Corp. by SRK Consulting (U.S.) Inc., Dated October 4, 2016
SRK, (2017). Technical Memorandum – Segovia PFS Gap Analysis; Prepared for Gran Colombia Gold Corp. by SRK Consulting (U.S.) Inc., Dated April 26, 2017.
SRK, (2018a). Review of Existing Ventilation Systems for the Providencia, El Silencio, and Sandra K Mines prepared by SRK Consulting (U.S.), Inc. for Gran Colombia Gold May 2, 2018.
SRK, (2018b). NI-43-101 Technical Report Prefeasibility Study Segovia Project, Colombia; Prepared for Gran Colombia Gold Corp. by SRK Consulting (U.S.) (nc., Dated May 10, 2018.
SRK, (2019). Geotechnical Engineering, Prefeasibility Study Report Segovia Mine Segovia, Colombia by SRK Consulting (U.S.) (nc., Dated April 24, 2019.
Wieselmann, et al., (1982). Informe de Evaluación Geológica Preliminar Area de Frontino Gold Mines Ltd. Report for Texasgulf Panama Inc., Wieselmann, E.A. & Galay, I., 7 April 1982. Translation into Spanish by A. D’Amato, 42 p.
Wood, (2019),El Chcoco Filtered Tailings Storage Facility Detailed Design Report for Phase 1C and 2A, prepared for Gran Colombia Gold Corp. By Wood, Dated December 5th, 2019.
Zandor, (2015). ESTUDIO AMBIENTAL ACTUALIZADO AL AÑO 2015 PARA LA OPERACIÓN MINERA EN EL RPP 140 DE PROPIEDAD DE ZANDOR CAPITAL S.A. (Remedios & Segovia Antioquia)”, Zandor Capital S.A., August 2015.
|
BP/KD |
May 2022 |
| SRK Consulting (U.S.), Inc. NI 43-101 Technical Report – Segovia 2021 PFS Update |
Page 398 |
28 Glossary
The Mineral Resources and Mineral Reserves have been classified according to CIM (CIM, 2014). Accordingly, the Resources have been classified as Measured, Indicated or Inferred, the Reserves have been classified as Proven, and Probable based on the Measured and Indicated Resources as defined below.
28.1 Mineral Resources
A Mineral Resource is a concentration or occurrence of solid material of economic interest in or on the Earth’s crust in such form, grade or quality and quantity that there are reasonable prospects for eventual economic extraction. The location, quantity, grade or quality, continuity and other geological characteristics of a Mineral Resource are known, estimated or interpreted from specific geological evidence and knowledge, including sampling.
An Inferred Mineral Resource is that part of a Mineral Resource for which quantity and grade or quality are estimated on the basis of limited geological evidence and sampling. Geological evidence is sufficient to imply but not verify geological and grade or quality continuity. An Inferred Mineral Resource has a lower level of confidence than that applying to an Indicated Mineral Resource and must not be converted to a Mineral Reserve. It is reasonably expected that the majority of Inferred Mineral Resources could be upgraded to Indicated Mineral Resources with continued exploration. An Indicated Mineral Resource is that part of a Mineral Resource for which quantity, grade or quality, densities, shape and physical characteristics are estimated with sufficient confidence to allow the application of Modifying Factors in sufficient detail to support mine planning and evaluation of the economic viability of the deposit. Geological evidence is derived from adequately detailed and reliable exploration, sampling and testing and is sufficient to assume geological and grade or quality continuity between points of observation. An Indicated Mineral Resource has a lower level of confidence than that applying to a Measured Mineral Resource and may only be converted to a Probable Mineral Reserve.
A Measured Mineral Resource is that part of a Mineral Resource for which quantity, grade or quality, densities, shape, and physical characteristics are estimated with confidence sufficient to allow the application of Modifying Factors to support detailed mine planning and final evaluation of the economic viability of the deposit. Geological evidence is derived from detailed and reliable exploration, sampling and testing and is sufficient to confirm geological and grade or quality continuity between points of observation. A Measured Mineral Resource has a higher level of confidence than that applying to either an Indicated Mineral Resource or an Inferred Mineral Resource. It may be converted to a Proven Mineral Reserve or to a Probable Mineral Reserve.
28.2 Mineral Reserves
A Mineral Reserve is the economically mineable part of a Measured and/or Indicated Mineral Resource. It includes diluting materials and allowances for losses, which may occur when the material is mined or extracted and is defined by studies at Pre-Feasibility or Feasibility level as appropriate that include application of Modifying Factors. Such studies demonstrate that, at the time of reporting, extraction could reasonably be justified.
|
BP/KD |
May 2022 |
| SRK Consulting (U.S.), Inc. NI 43-101 Technical Report – Segovia 2021 PFS Update |
Page 399 |
The reference point at which Mineral Reserves are defined, usually the point where the ore is delivered to the processing plant, must be stated. It is important that, in all situations where the reference point is different, such as for a saleable product, a clarifying statement is included to ensure that the reader is fully informed as to what is being reported. The public disclosure of a Mineral Reserve must be demonstrated by a Pre-Feasibility Study or Feasibility Study.
A Probable Mineral Reserve is the economically mineable part of an Indicated, and in some circumstances, a Measured Mineral Resource. The confidence in the Modifying Factors applying to a Probable Mineral Reserve is lower than that applying to a Proven Mineral Reserve.
A Proven Mineral Reserve is the economically mineable part of a Measured Mineral Resource. A Proven Mineral Reserve implies a high degree of confidence in the Modifying Factors.
28.3 Definition of Terms
The following general mining terms may be used in this report.
Table 28-1: Definition of Terms
| Term | Definition | |
| Assay | The chemical analysis of mineral samples to determine the metal content. | |
| Capital Expenditure | All other expenditures not classified as operating costs. | |
| Composite | Combining more than one sample result to give an average result over a larger distance. | |
| Concentrate | A metal-rich product resulting from a mineral enrichment process such as gravity concentration or flotation, in which most of the desired mineral has been separated from the waste material in the ore. | |
| Crushing | Initial process of reducing ore particle size to render it more amenable for further processing. | |
| Cut-off Grade (CoG) | The grade of mineralized rock, which determines as to whether or not it is economic to recover its gold content by further concentration. | |
| Dilution | Waste, which is unavoidably mined with ore. | |
| Dip | Angle of inclination of a geological feature/rock from the horizontal. | |
| Fault | The surface of a fracture along which movement has occurred. | |
| Footwall | The underlying side of an orebody or stope. | |
| Gangue | Non-valuable components of the ore. | |
| Grade | The measure of concentration of gold within mineralized rock. | |
| Hangingwall | The overlying side of an orebody or slope. | |
| Haulage | A horizontal underground excavation which is used to transport mined ore. | |
| Hydrocyclone | A process whereby material is graded according to size by exploiting centrifugal forces of particulate materials. | |
| Igneous | Primary crystalline rock formed by the solidification of magma. | |
| Kriging | An interpolation method of assigning values from samples to blocks that minimizes the estimation error. | |
| Level | Horizontal tunnel the primary purpose is the transportation of personnel and materials. | |
| Lithological | Geological description pertaining to different rock types. | |
| LoM Plans | Life-of-Mine plans. | |
| LRP | Long Range Plan. | |
| Material Properties | Mine properties. | |
| Milling | A general term used to describe the process in which the ore is crushed and ground and subjected to physical or chemical treatment to extract the valuable metals to a concentrate or finished product. | |
| Mineral/Mining Lease | A lease area for which mineral rights are held. | |
| Mining Assets | The Material Properties and Significant Exploration Properties. | |
| Ongoing Capital | Capital estimates of a routine nature, which is necessary for sustaining operations. | |
| Ore Reserve | See Mineral Reserve. |
|
BP/KD |
May 2022 |
| SRK Consulting (U.S.), Inc. NI 43-101 Technical Report – Segovia 2021 PFS Update |
Page 400 |
| Term | Definition | |
| Pillar | Rock left behind to help support the excavations in an underground mine. | |
| RoM | Run-of-Mine. | |
| Sedimentary | Pertaining to rocks formed by the accumulation of sediments, formed by the erosion of other rocks. | |
| Shaft | An opening cut downwards from the surface for transporting personnel, equipment, supplies, ore and waste. | |
| Sill | A thin, tabular, horizontal to sub-horizontal body of igneous rock formed by the injection of magma into planar zones of weakness. | |
| Smelting | A high temperature pyrometallurgical operation conducted in a furnace, in which the valuable metal is collected to a molten matte or doré phase and separated from the gangue components that accumulate in a less dense molten slag phase. | |
| Stope | Underground void created by mining. | |
| Stratigraphy | The study of stratified rocks in terms of time and space. | |
| Strike | Direction of line formed by the intersection of strata surfaces with the horizontal plane, always perpendicular to the dip direction. | |
| Sulfide | A sulfur bearing mineral. | |
| Tailings | Finely ground waste rock from which valuable minerals or metals have been extracted. | |
| Thickening | The process of concentrating solid particles in suspension. | |
| Total Expenditure | All expenditures including those of an operating and capital nature. | |
| Variogram | A statistical representation of the characteristics (usually grade). |
28.4 Abbreviations
The following abbreviations may be used in this report.
Table 28-2: Abbreviations
| Abbreviation | Unit or Term | |
| A | ampere | |
| AA | atomic absorption | |
| A/m2 | amperes per square meter | |
| ANFO | ammonium nitrate fuel oil | |
| Ag | silver | |
| Au | gold | |
| AuEq | gold equivalent grade | |
| °C | degrees Centigrade | |
| CCD | counter-current decantation | |
| CIL | carbon-in-leach | |
| CoG | cut-off grade | |
| cm | centimeter | |
| cm2 | square centimeter | |
| cm3 | cubic centimeter | |
| cfm | cubic feet per minute | |
| ConfC | confidence code | |
| CRec | core recovery | |
| CSS | closed-side setting | |
| CTW | calculated true width | |
| ° | degree (degrees) | |
| dia. | diameter | |
| EIS | Environmental Impact Statement | |
| EMP | Environmental Management Plan | |
| FA | fire assay | |
| ft | foot (feet) | |
| ft2 | square foot (feet) | |
| ft3 | cubic foot (feet) | |
| g | gram |
|
BP/KD |
May 2022 |
| SRK Consulting (U.S.), Inc. NI 43-101 Technical Report – Segovia 2021 PFS Update |
Page 401 |
| Abbreviation | Unit or Term | |
| gal | gallon | |
| g/L | gram per liter | |
| g-mol | gram-mole | |
| gpm | gallons per minute | |
| g/t | grams per tonne | |
| ha | hectares | |
| HDPE | Height Density Polyethylene | |
| hp | horsepower | |
| HTW | horizontal true width | |
| ICP | induced couple plasma | |
| ID2 | inverse-distance squared | |
| ID3 | inverse-distance cubed | |
| IFC | International Finance Corporation | |
| ILS | Intermediate Leach Solution | |
| kA | kiloamperes | |
| kg | kilograms | |
| km | kilometer | |
| km2 | square kilometer | |
| koz | thousand troy ounce | |
| kt | thousand tonnes | |
| kt/d | thousand tonnes per day | |
| kt/y | thousand tonnes per year | |
| kV | kilovolt | |
| kW | kilowatt | |
| kWh | kilowatt-hour | |
| kWh/t | kilowatt-hour per metric tonne | |
| L | liter | |
| L/sec | liters per second | |
| L/sec/m | liters per second per meter | |
| lb | pound | |
| LHD | Long-Haul Dump truck | |
| LLDDP | Linear Low Density Polyethylene Plastic | |
| LOI | Loss On Ignition | |
| LoM | Life-of-Mine | |
| m | meter | |
| m2 | square meter | |
| m3 | cubic meter | |
| masl | meters above sea level | |
| MARN | Ministry of the Environment and Natural Resources | |
| MDA | Mine Development Associates | |
| mg/L | milligrams/liter | |
| mm | millimeter | |
| mm2 | square millimeter | |
| mm3 | cubic millimeter | |
| MME | Mine & Mill Engineering | |
| Moz | million troy ounces | |
| Mt | million tonnes | |
| MTW | measured true width | |
| MW | million watts | |
| m.y. | million years | |
| NGO | non-governmental organization | |
| NI 43-101 | Canadian National Instrument 43-101 | |
| OSC | Ontario Securities Commission | |
| oz | troy ounce | |
| % | percent | |
| PLC | Programmable Logic Controller | |
| PLS | Pregnant Leach Solution | |
| PMF | probable maximum flood |
|
BP/KD |
May 2022 |
| SRK Consulting (U.S.), Inc. NI 43-101 Technical Report – Segovia 2021 PFS Update |
Page 402 |
| Abbreviation | Unit or Term | |
| ppb | parts per billion | |
| ppm | parts per million | |
| QA/QC | Quality Assurance/Quality Control | |
| RC | rotary circulation drilling | |
| RoM | Run-of-Mine | |
| RQD | Rock Quality Description | |
| SEC | U.S. Securities & Exchange Commission | |
| sec | second | |
| SG | specific gravity | |
| SPT | standard penetration testing | |
| st | short ton (2,000 pounds) | |
| t | tonne (metric ton) (2,204.6 pounds) | |
| t/h | tonnes per hour | |
| t/d | tonnes per day | |
| t/y | tonnes per year | |
| TSF | tailings storage facility | |
| TSP | total suspended particulates | |
| µm | micron or microns | |
| V | volts | |
| VFD | variable frequency drive | |
| W | watt | |
| XRD | x-ray diffraction | |
| y | year |
|
BP/KD |
May 2022 |
| SRK Consulting (U.S.), Inc. NI 43-101 Technical Report – Segovia 2021 PFS Update |
Appendices |
Appendices
|
BP/KD |
May 2022 |
| SRK Consulting (U.S.), Inc. NI 43-101 Technical Report – Segovia 2021 PFS Update |
Appendices |
Appendix A: Certificates of Qualified Persons
|
BP/KD |
May 2022 |
| SRK Consulting (U.S.), Inc. 999 Seventeenth Street Suite 400 Denver, CO 80202 | ||||
| T:303.985.1333 F:303.985.9947 | ||||
| denver@srk.com www.srk.com | ||||
CERTIFICATE OF QUALIFIED PERSON
I, David Bird, MSc., PG, RM-SME, do hereby certify that:
| 1. | I am an Associate Principal Consultant (Geochemistry) of SRK Consulting (U.S.), Inc., 999 17th St. Ste: 400, Denver, CO, 80202. |
| 2. | This certificate applies to the technical report titled “NI 43-101 Technical Report, Prefeasibility Study, Segovia Project, Antioquia, Colombia” with an Effective Date of December 31, 2021 (the “Technical Report”). |
| 3. | I graduated with Bachelor’s Degrees in Geology and Business Administration Management from Oregon State University in 1983. In addition, I obtained a Master’s Degree in Geochemistry/Hydrogeology from the University of Nevada-Reno in 1993. I am a Registered Member of the Society for Mining, Metallurgy, and Exploration (SME). I am a certified Professional Geologist in the State of Oregon (G1438). I have worked full time as a Geologist and Geochemist for a total of 32 years. My relevant experience includes design, execution, and interpretation of mine waste geochemical characterization programs in support of open pit and underground mine planning and environmental impact assessments, design and supervision of water quality sampling and monitoring programs, geochemical modeling, and management of the geochemistry portion of numerous PEA, PFS and FS-level mine projects in the US and abroad. |
| 4. | I have read the definition of “qualified person” set out in National Instrument 43-101 (NI 43-101) and certify that by reason of my education, affiliation with a professional association (as defined in NI 43-101) and past relevant work experience, I fulfill the requirements to be a “qualified person” for the purposes of NI 43-101. |
| 5. | I have not visited the Segovia property. |
| 6. | I am responsible for Geochemistry Sections 1.10.1, 16.8, 20.1.3, 25.7.1 and 26.5.1. |
| 7. | I am independent of the issuer applying all of the tests in section 1.5 of NI 43-101. |
| 8. | I have had prior involvement with the property that is the subject of the Technical Report. The nature of my prior involvement is acting as QP for the technical reports titled “NI 43-101 Technical Report, Prefeasibility Study Update, Segovia Project, Department of Antioquia, Colombia” with an effective date of December 31, 2020; “NI 43-101 Technical Report, Prefeasibility Study Update, Segovia Project, Department of Antioquia, Colombia” with an effective date of December 31, 2019; “NI 43-101 Technical Report, Prefeasibility Study, Segovia Project, Colombia” with an effective date of December 31, 2017. |
| 9. | I have read NI 43-101 and Form 43-101F1 and the sections of the Technical Report I am responsible for have been prepared in compliance with that instrument and form. |
| 10. | As of the aforementioned Effective Date, to the best of my knowledge, information and belief, the sections of the Technical Report I am responsible for contains all scientific and technical information that is required to be disclosed to make the Technical Report not misleading. |
| U.S. Offices: | Canadian Offices: | Group Offices: | ||||||||
| Anchorage Clovis Denver Elko Reno Tucson |
907.677.3520 559.452.0182 303.985.1333 775.753.4151 775.828.6800 520.544.3688 |
Saskatoon Sudbury Toronto Vancouver Yellowknife |
306.955.4778 705.682.3270 416.601.1445 604.681.4196 867.873.8670 |
Africa Asia Australia Europe North America South America | ||||||
| SRK Consulting (U.S.), Inc. NI 43-101 Technical Report – Segovia 2021 PFS Update |
Page 2 |
Dated this 6th Day of May, 2022.
| “Signed” |
||||
| “Sealed” | ||||
| David Bird, MSc., PG, RM-SME |
|
|||
|
BP/KD |
May 2022 |
| SRK Consulting (U.S.), Inc. 999 Seventeenth Street Suite 400 Denver, CO 80202 | ||||
| T:303.985.1333 F:303.985.9947 | ||||
| denver@srk.com www.srk.com | ||||
CERTIFICATE OF QUALIFIED PERSON
I, Fredy Henriquez, MSc Eng, SME, ISRM do hereby certify that:
| 1. | I am Principal Consultant (Rock Mechanics) of SRK Consulting (U.S.), Inc., 999 17th St. Ste: 400, Denver, CO, 80202. |
| 2. | This certificate applies to the technical report titled “NI 43-101 Technical Report, Prefeasibility Study, Segovia Project, Antioquia, Colombia” with an Effective Date of December 31, 2021 (the “Technical Report”). |
| 3. | I graduated with a degree in Civil Mine Engineer from University of Santiago, Chile in 2000. In addition, I have obtained a Masters degree (MSc) in Engineering (Rock Mechanics) from WASM, Curtin University, Australia (2011). I am a Registered Member of the Society for Mining, Metallurgy, and Exploration (SME, register number 4196405RM). I have worked as a geotechnical engineer for a total of 25 years since my graduation from university. My relevant experience includes civil and mining geotechnical projects ranging from conceptual through feasibility design levels and operations support. I am skilled in both soil and rock mechanics engineering and specialize in the design and management of mine excavations. My primary areas of expertise include mine operations, mine planning, hard rock and soft rock characterization, underground and open pit stability analysis, database management, geotechnical data collection, probabilistic analysis, risk assessment, slope monitoring, modeling and pit wall pore pressure reductions. I have undertaken and managed large geotechnical projects for the mining industry throughout North, Central, South America, Australia and South Africa. |
| 4. | I have read the definition of “qualified person” set out in National Instrument 43-101 (NI 43-101) and certify that by reason of my education, affiliation with a professional association (as defined in NI 43-101) and past relevant work experience, I fulfill the requirements to be a “qualified person” for the purposes of NI 43-101. |
| 5. | I visited the Segovia property on February 7 to February 8, 2019 and May 3 to May 8, 2021. |
| 6. | I am responsible for geotechnical sections 1.7.1, 16.4, 25.3.1 and 26.2.2 of the Technical Report. |
| 7. | I am independent of the issuer applying all of the tests in section 1.5 of NI 43-101. |
| 8. | I have had prior involvement with the property that is the subject of the Technical Report. The nature of my prior involvement is acting as QP for the technical reports titled “NI 43-101 Technical Report, Prefeasibility Study Update, Segovia Project, Department of Antioquia, Colombia” with an effective date of December 31, 2020; “NI 43-101 Technical Report, Prefeasibility Study Update, Segovia Project, Department of Antioquia, Colombia” with an effective date of December 31, 2019; “NI 43-101 Technical Report, Prefeasibility Study, Segovia Project, Colombia” with an effective date of December 31, 2017. |
| 9. | I have read NI 43-101 and Form 43-101F1 and the sections of the Technical Report I am responsible for have been prepared in compliance with that instrument and form. |
| 10. | As of the aforementioned Effective Date, to the best of my knowledge, information and belief, the sections of the Technical Report I am responsible for contains all scientific and technical information that is required to be disclosed to make the Technical Report not misleading. |
| U.S. Offices: | Canadian Offices: | Group Offices: | ||||||||
| Anchorage Clovis Denver Elko Reno Tucson |
907.677.3520 559.452.0182 303.985.1333 775.753.4151 775.828.6800 520.544.3688 |
Saskatoon Sudbury Toronto Vancouver Yellowknife |
306.955.4778 705.682.3270 416.601.1445 604.681.4196 867.873.8670 |
Africa Asia Australia Europe North America South America | ||||||
| SRK Consulting (U.S.), Inc. |
Page 2 |
ted this 6th Day of May, 2022.
| “Signed” |
||||
|
|
“Sealed” | |||
| Fredy Henriquez, MSc Eng, SME, ISRM Principal Consultant (Rock Mechanics) |
||||
| SRK Consulting (U.S.), Inc. 999 Seventeenth Street Suite 400 Denver, CO 80202 | ||||
| T:303.985.1333 F:303.985.9947 | ||||
| denver@srk.com www.srk.com | ||||
CERTIFICATE OF QUALIFIED PERSON
I, Eric Olin, MSc, MBA, RM-SME do hereby certify that:
| 1. | I am a Principal Process Metallurgist of SRK Consulting (U.S.), Inc., 999 17th St. Ste: 400, Denver, CO, 80202. |
| 2. | This certificate applies to the technical report titled “NI 43-101 Technical Report, Prefeasibility Study, Segovia Project, Antioquia, Colombia” with an Effective Date of December 31, 2021 (the “Technical Report”). |
| 3. | I graduated with a Master of Science degree in Metallurgical Engineering from the Colorado School of Mines in 1976. I am a Registered Member of The Society for Mining, Metallurgy and Exploration, Inc. I have worked as a Metallurgist for a total of 40 years since my graduation from the Colorado School of Mines. My relevant experience includes extensive consulting, plant operations, process development, project management and research & development experience with base metals, precious metals, ferrous metals and industrial minerals. I have served as the plant superintendent for several gold and base metal mining operations. Additionally, I have been involved with numerous third-party due diligence audits, and preparation of project conceptual, pre-feasibility and full-feasibility studies. |
| 4. | I have read the definition of “qualified person” set out in National Instrument 43-101 (NI 43-101) and certify that by reason of my education, affiliation with a professional association (as defined in NI 43-101) and past relevant work experience, I fulfill the requirements to be a “qualified person” for the purposes of NI 43-101. |
| 5. | I visited the Segovia property on December 3 to December 4, 2019. |
| 6. | I am responsible for the preparation of Sections 1.4, 1.8, 5.4.6, 13, 17, 25.2, 25.4 and 26.3 of the Technical Report. |
| 7. | I am independent of the issuer applying all of the tests in section 1.5 of NI 43-101. |
| 8. | I have had prior involvement with the property that is the subject of the Technical Report. The nature of my prior involvement is acting as QP for the technical reports titled “NI 43-101 Technical Report, Prefeasibility Study Update, Segovia Project, Department of Antioquia, Colombia” with an effective date of December 31, 2020; “NI 43-101 Technical Report, Prefeasibility Study Update, Segovia Project, Department of Antioquia, Colombia” with an effective date of December 31, 2019; “NI 43-101 Technical Report, Prefeasibility Study, Segovia Project, Colombia” with an effective date of December 31, 2017. |
| 9. | I have read NI 43-101 and Form 43-101F1 and the sections of the Technical Report I am responsible for have been prepared in compliance with that instrument and form. |
| 10. | As of the aforementioned Effective Date, to the best of my knowledge, information and belief, the sections of the Technical Report I am responsible for contains all scientific and technical information that is required to be disclosed to make the Technical Report not misleading. |
| U.S. Offices: | Canadian Offices: | Group Offices: | ||||||||
| Anchorage Clovis Denver Elko Reno Tucson |
907.677.3520 559.452.0182 303.985.1333 775.753.4151 775.828.6800 520.544.3688 |
Saskatoon Sudbury Toronto Vancouver Yellowknife |
306.955.4778 705.682.3270 416.601.1445 604.681.4196 867.873.8670 |
Africa Asia Australia Europe North America South America | ||||||
| SRK Consulting | Page 2 |
| Dated this 6th Day of May, 2022. |
||||
|
“Signed” |
“Sealed” |
|||
|
Eric Olin, MSc, MBA, RM-SME |
||||
| SRK Consulting (U.S.), Inc. 999 Seventeenth Street Suite 400 Denver, CO 80202
T: 303.985.1333 F: 303.985.9947
denver@srk.com www.srk.com |
CERTIFICATE OF QUALIFIED PERSON
I, Giovanny Ortiz, BS Geology, FAusIMM do hereby certify that:
| 1. | I am Principal Resource Geologist of SRK Consulting (U.S.), Inc., 999 17th St. Ste: 400, Denver, CO, 80202. |
| 2. | This certificate applies to the technical report titled “NI 43-101 Technical Report, Prefeasibility Study, Segovia Project, Antioquia, Colombia” with an Effective Date of December 31, 2021 (the “Technical Report”). |
| 3. | I graduated with a degree in Geology from Universidad Industrial de Santander (Santander, Colombia) in 1994. In addition, I have obtained a Specialization in Energy Resources Management, 2007, Universidad Autónoma de Bucarmanga (Santander, Colombia). I am a registered Geologist with the Colombian Council of Geology, Bogotá, Colombia, and a fellow (FAusIMM) in good standing of the Australasian Institute of Mining and Metallurgy (AusIMM 304612). I have worked as Geologist for a total of 27 years since my graduation from university. My relevant experience includes over 24 years of working in mineral exploration and resource estimation in projects in Colombia, Panamá, Perú, Venezuela, Argentina, Mexico, Chile, United States and Nicaragua, occupying progressively responsible positions within the exploration industry. |
| 4. | I have read the definition of “qualified person” set out in National Instrument 43-101 (NI 43-101) and certify that by reason of my education, affiliation with a professional association (as defined in NI 43-101) and past relevant work experience, I fulfill the requirements to be a “qualified person” for the purposes of NI 43-101. |
| 5. | I visited the Segovia property on December 2 to December 7, 2020 and January 25 to January 28, 2022. |
| 6. | I am responsible for Sections 9,11.5, 12.1.2 and 14.2 |
| 7. | I am independent of the issuer applying all of the tests in section 1.5 of NI 43-101. |
| 8. | I have had prior involvement with the property that is the subject of the Technical Report. The nature of my prior involvement is acting as QP for the technical reports titled “NI 43-101 Technical Report, Prefeasibility Study Update, Segovia Project, Department of Antioquia, Colombia” with an effective date of December 31, 2020. |
| 9. | I have read NI 43-101 and Form 43-101F1 and the sections of the Technical Report I am responsible for have been prepared in compliance with that instrument and form. |
| 10. | As of the aforementioned Effective Date, to the best of my knowledge, information and belief, the sections of the Technical Report I am responsible for contains all scientific and technical information that is required to be disclosed to make the Technical Report not misleading. |
| Dated this 6th Day of May, 2022. |
||||
|
“Signed” |
“Sealed” |
|||
|
Giovanny Ortiz, BS Geology, FAusIMM |
||||
| U.S. Offices: | Canadian Offices: | Group Offices: | ||||||||
| Anchorage | 907.677.3520 | Saskatoon | 306.955.4778 | Africa | ||||||
| Clovis | 559.452.0182 | Sudbury | 705.682.3270 | Asia | ||||||
| Denver | 303.985.1333 | Toronto | 416.601.1445 | Australia | ||||||
| Elko | 775.753.4151 | Vancouver | 604.681.4196 | Europe | ||||||
| Reno | 775.828.6800 | Yellowknife | 867.873.8670 | NorthAmerica | ||||||
| Tucson | 520.544.3688 | SouthAmerica | ||||||||
| SRK Consulting (U.S.), Inc. 999 Seventeenth Street Suite 400 Denver, CO 80202
T: 303.985.1333 F: 303.985.9947
denver@srk.com www.srk.com |
CERTIFICATE OF QUALIFIED PERSON
I, Jeff Osborn, BEng Mining, MMSAQP do hereby certify that:
| 1. | I am a Principal Consultant (Mining Engineer) of SRK Consulting (U.S.), Inc., 999 17th St. Ste: 400, Denver, CO, 80202. |
| 2. | This certificate applies to the technical report titled “NI 43-101 Technical Report, Prefeasibility Study, Segovia Project, Antioquia, Colombia” with an Effective Date of December 31, 2021 (the “Technical Report”). |
| 3. | I graduated with a Bachelor of Science Mining Engineering degree from the Colorado School of Mines in 1986. I am a Qualified Professional (QP) Member of the Mining and Metallurgical Society of America. I have worked as a Mining Engineer for a total of 34 years since my graduation from university. My relevant experience includes responsibilities in operations, maintenance, engineering, management, and construction activities. |
| 4. | I have read the definition of “qualified person” set out in National Instrument 43-101 (NI 43-101) and certify that by reason of my education, affiliation with a professional association (as defined in NI 43-101) and past relevant work experience, I fulfill the requirements to be a “qualified person” for the purposes of NI 43-101. |
| 5. | I visited the Segovia property on March 11 to March 12, 2020, October 1 to October 4, 2018 and February 6 to February 8, 2018. |
| 6. | I am responsible for Sections 1-introduction, 1.9 (except for 1.9.1), 1.11, 1.12, 2, 3, 5.4 (except 5.4.4 and 5.4.6), 18 (except for 18.2), 19, 21, 22, 24, 25.5, 25.6, 25.8, 25.9, 26.4.1, 26.5.2, 26.7, 27 and 28. |
| 7. | I am independent of the issuer applying all of the tests in section 1.5 of NI 43-101. |
| 8. | I have had prior involvement with the property that is the subject of the Technical Report. The nature of my prior involvement is acting as QP for the technical reports titled “NI 43-101 Technical Report, Prefeasibility Study Update, Segovia Project, Department of Antioquia, Colombia” with an effective date of December 31, 2020; “NI 43-101 Technical Report, Prefeasibility Study Update, Segovia Project, Department of Antioquia, Colombia” with an effective date of December 31, 2019; “NI 43-101 Technical Report, Prefeasibility Study, Segovia Project, Colombia” with an effective date of December 31, 2017. |
| 9. | I have read NI 43-101 and Form 43-101F1 and the sections of the Technical Report I am responsible for have been prepared in compliance with that instrument and form. |
| 10. | As of the aforementioned Effective Date, to the best of my knowledge, information and belief, the sections of the Technical Report I am responsible for contains all scientific and technical information that is required to be disclosed to make the Technical Report not misleading. |
| Dated this 6th Day of May, 2022. |
||||
|
“Signed” |
||||
| “Sealed” |
||||
| Jeff Osborn, BEng Mining, MMSAQP [01458QP] Principal Consultant (Mining Engineer) |
| U.S. Offices: | Canadian Offices: | Group Offices: | ||||||||
| Anchorage | 907.677.3520 | Saskatoon | 306.955.4778 | Africa | ||||||
| Clovis | 559.452.0182 | Sudbury | 705.682.3270 | Asia | ||||||
| Denver | 303.985.1333 | Toronto | 416.601.1445 | Australia | ||||||
| Elko | 775.753.4151 | Vancouver | 604.681.4196 | Europe | ||||||
| Reno | 775.828.6800 | North America | ||||||||
| Tucson | 520.544.3688 | South America | ||||||||
| SRK Consulting (U.S.), Inc. 999 Seventeenth Street Suite 400 Denver, CO 80202
T: (775) 828-6800 F: (775) 828-6820
denver@srk.com www.srk.com |
CERTIFICATE OF QUALIFIED PERSON
I, Jeffrey Vaughan Parshley, CPG do hereby certify that:
| 1. | I am a Corporate Consultant for SRK Consulting (U.S.), Inc., 5250 Neil Road, Suite 300, Reno, NV, USA, 89502. |
| 2. | This certificate applies to the technical report titled “NI 43-101 Technical Report, Prefeasibility Study, Segovia Project, Antioquia, Colombia” with an Effective Date of December 31, 2021 (the “Technical Report”). |
| 3. | I graduated with a degree in B.A. in Geology from Dartmouth College in 1980. I am a Certified Professional Geologist of the American Institute of Professional Geologists. I have worked as a Geologist for a total of 41 years since my graduation from university. My relevant experience includes more than 33 years of mine permitting, closure and environmental studies in the U.S. and internationally. |
| 4. | I have read the definition of “qualified person” set out in National Instrument 43-101 (NI 43-101) and certify that by reason of my education, affiliation with a professional association (as defined in NI 43-101) and past relevant work experience, I fulfill the requirements to be a “qualified person” for the purposes of NI 43-101. |
| 5. | I have not visited the Segovia property. |
| 6. | I am responsible for Closure Sections 1.10.2 and 20.5 |
| 7. | I am independent of the issuer applying all of the tests in section 1.5 of NI 43-101. |
| 8. | I have had prior involvement with the property that is the subject of the Technical Report. The nature of my prior involvement is acting as QP for the technical reports titled “NI 43-101 Technical Report, Prefeasibility Study Update, Segovia Project, Department of Antioquia, Colombia” with an effective date of December 31, 2020. |
| 9. | I have read NI 43-101 and Form 43-101F1 and the sections of the Technical Report I am responsible for have been prepared in compliance with that instrument and form. |
| 10. | As of the aforementioned Effective Date, to the best of my knowledge, information and belief, the sections of the Technical Report I am responsible for contains all scientific and technical information that is required to be disclosed to make the Technical Report not misleading. |
| Dated this 6th Day of May, 2022. |
||||
| “Signed” |
||||
| “Sealed” |
||||
| Jeffrey Vaughan Parshley, CPG |
||||
| JP |
| SRK Consulting (U.S.), Inc. 999 Seventeenth Street Suite 400 Denver, CO 80202
T: 303.985.1333 F: 303.985.9947
denver@srk.com www.srk.com |
CERTIFICATE OF QUALIFIED PERSON
I, Benjamin Parsons, MSc, MAusIMM (CP) do hereby certify that:
| 1. | I am a Principal Consultant (Resource Geology) of SRK Consulting (U.S.), Inc., 999 17th St. Ste: 400, Denver, CO, 80202. |
| 2. | This certificate applies to the technical report titled “NI 43-101 Technical Report, Prefeasibility Study, Segovia Project, Antioquia, Colombia” with an Effective Date of December 31, 2021 (the “Technical Report”). |
| 3. | I graduated with a degree in Exploration Geology from Cardiff University, UK in 1999. In addition, I have obtained a Masters degree (MSc) in Mineral Resources from Cardiff University, UK in 2000 and have worked as a geologist for a total of 20 years since my graduation from university. I am a member of the Australian Institution of Materials Mining and Metallurgy (Membership Number 222568) and I am a Chartered Professional. |
| 4. | I have read the definition of “qualified person” set out in National Instrument 43-101 (NI 43-101) and certify that by reason of my education, affiliation with a professional association (as defined in NI 43-101) and past relevant work experience, I fulfill the requirements to be a “qualified person” for the purposes of NI 43-101. |
| 5. | I visited the Segovia property on January 22 to January 25, 2018, April 11 to April 13, 2018 and August 21 to August 23, 2018. |
| 6. | I am responsible for Sections 1.1 through 1.3, 1.5, 4 (except for 4.5), 5 (except for 5.4), 6, 7, 8, 10, 11 (except 11.5), 12 (except 12.1.2), 14 (except 14.2), 23, 25.1 and 26.1. |
| 7. | I am independent of the issuer applying all of the tests in section 1.5 of NI 43-101. |
| 8. | I have had prior involvement with the property that is the subject of the Technical Report. The nature of my prior involvement is acting as QP for the technical reports titled “NI 43-101 Technical Report, Prefeasibility Study Update, Segovia Project, Department of Antioquia, Colombia” with an effective date of December 31, 2020; “NI 43-101 Technical Report, Prefeasibility Study Update, Segovia Project, Department of Antioquia, Colombia” with an effective date of December 31, 2019; “NI 43-101 Technical Report, Prefeasibility Study, Segovia Project, Colombia” with an effective date of December 31, 2017. |
| 9. | I have read NI 43-101 and Form 43-101F1 and the sections of the Technical Report I am responsible for have been prepared in compliance with that instrument and form. |
| 10. | As of the aforementioned Effective Date, to the best of my knowledge, information and belief, the sections of the Technical Report I am responsible for contains all scientific and technical information that is required to be disclosed to make the Technical Report not misleading. |
| U.S. Offices: | anadian Offices: | Group Offices: | ||||||||
| Anchorage | 907.677.3520 | Saskatoon | 306.955.4778 | Africa | ||||||
| Clovis | 559.452.0182 | Sudbury | 705.682.3270 | Asia | ||||||
| Denver | 303.985.1333 | Toronto | 416.601.1445 | Australia | ||||||
| Elko | 775.753.4151 | Vancouver | 604.681.4196 | Europe | ||||||
| Fort Collins | 970.407.8302 | Yellowknife | 867.873.8670 | North America | ||||||
| Reno | 775.828.6800 | South America | ||||||||
| Tucson | 520.544.3688 | |||||||||
| SRK Consulting (U.S.), Inc. | Page 2 |
| Dated this 6th Day of May, 2022. |
||||
| “Signed” |
||||
| “Sealed” |
||||
|
Benjamin Parsons, MSc, MAusIMM |
||||
| SRK Consulting (U.S.), Inc. 999 Seventeenth Street Suite 400 Denver, CO 80202
T: 303.985.1333 F: 303.985.9947
denver@srk.com www.srk.com |
CERTIFICATE OF QUALIFIED PERSON
I, Cristian A. Pereira Farias, SME-RM, do hereby certify that:
| 1. | I am Senior Consultant (Hydrogeologist) of SRK Consulting (U.S.), Inc., 999 17th St. Ste: 400, Denver, CO, 80202. |
| 2. | This certificate applies to the technical report titled “NI 43-101 Technical Report, Prefeasibility Study, Segovia Project, Antioquia, Colombia” with an Effective Date of December 31, 2021 (the “Technical Report”). |
| 3. | I graduated with a degree in Bachelors of Science in Geology from Universidad de Chile in 1999. I am a registered member of the Society for Mining, Metallurgy, and Exploration. I have worked as a hydrogeologist for a total of 19 years since my graduation from university. My relevant experience includes the developing conceptual and numerical hydrogeological models, the evaluation of groundwater resources, mine dewatering requirements, environmental impacts of mining, pit lake infilling, brine extraction, and pore pressure analyses. |
| 4. | I have read the definition of “qualified person” set out in National Instrument 43-101 (NI 43-101) and certify that by reason of my education, affiliation with a professional association (as defined in NI 43-101) and past relevant work experience, I fulfill the requirements to be a “qualified person” for the purposes of NI 43-101. |
| 5. | I visited the Segovia property on August 9 to August 11, 2020. |
| 6. | I am responsible for Hydrogeology Sections 1.7.2, 1.7.3, 16.5, 16.7, 25.5 and 26.5.3 |
| 7. | I am independent of the issuer applying all of the tests in section 1.5 of NI 43-101. |
| 8. | I have had prior involvement with the property that is the subject of the Technical Report. The nature of my prior involvement is acting as QP for the technical reports titled “NI 43-101 Technical Report, Prefeasibility Study Update, Segovia Project, Department of Antioquia, Colombia” with an effective date of December 31, 2020; “NI 43-101 Technical Report, Prefeasibility Study Update, Segovia Project, Department of Antioquia, Colombia” with an effective date of December 31, 2019; “NI 43-101 Technical Report, Prefeasibility Study, Segovia Project, Colombia” with an effective date of December 31, 2017. |
| 9. | I have read NI 43-101 and Form 43-101F1 and the sections of the Technical Report I am responsible for have been prepared in compliance with that instrument and form. |
| 10. | As of the aforementioned Effective Date, to the best of my knowledge, information and belief, the sections of the Technical Report I am responsible for contains all scientific and technical information that is required to be disclosed to make the Technical Report not misleading. |
| Dated this 6th Day of May, 2022. |
||||
| “Signed” |
||||
| “Sealed” |
||||
| Cristian A. Pereira Farias, SME-RM |
||||
| U.S. Offices: | Canadian Offices: | Group Offices: | ||||||||
| Anchorage | 907.677.3520 | Saskatoon | 306.955.4778 | Africa | ||||||
| Clovis | 559.452.0182 | Sudbury | 705.682.3270 | Asia | ||||||
| Denver | 303.985.1333 | Toronto | 416.601.1445 | Australia | ||||||
| Elko | 775.753.4151 | Vancouver | 604.681.4196 | Europe | ||||||
| Reno | 775.828.6800 | North America | ||||||||
| Tucson | 520.544.3688 | South America | ||||||||
| SRK Consulting (U.S.), Inc. 999 Seventeenth Street Suite 400 Denver, CO 80202
T: 303.985.1333 F: 303.985.9947
denver@srk.com www.srk.com |
CERTIFICATE OF QUALIFIED PERSON
I, Fernando Rodrigues, BS Mining, MBA, MMSAQP do hereby certify that:
| 1. | I am Practice Leader and Principal Consultant (Mining Engineer) of SRK Consulting (U.S.), Inc., 999 17th St. Ste: 400, Denver, CO, 80202. |
| 2. | This certificate applies to the technical report titled “NI 43-101 Technical Report, Prefeasibility Study, Segovia Project, Antioquia, Colombia” with an Effective Date of December 31, 2021 (the “Technical Report”). |
| 3. | I graduated with a Bachelors of Science degree in Mining Engineering from South Dakota School of Mines and Technology in 1999. I am a QP member of the MMSA. I have worked as a Mining Engineer for a total of 23 years since my graduation from South Dakota School of Mines and Technology in 1999. My relevant experience includes mine design and implementation, short term mine design, dump design, haulage studies, blast design, ore control, grade estimation, database management. |
| 4. | I have read the definition of “qualified person” set out in National Instrument 43-101 (NI 43-101) and certify that by reason of my education, affiliation with a professional association (as defined in NI 43-101) and past relevant work experience, I fulfill the requirements to be a “qualified person” for the purposes of NI 43-101. |
| 5. | I visited the Segovia property on March 10 to March 11, 2022, March 11 to March 12, 2020, February 19 to February 20, 2020, February 7 to February 8, 2019, January 7 to January 10, 2019, February 6 to February 8, 2018, June 11 to June 14, 2018, November 11 to November 21, 2018 |
| 6. | I am responsible for Sections 1.6, 1.7 (except for 1.7.1, 1.7.2, 1.7.3), 15, 16 (except for 16.4, 16.5, 16.7 and 16.8), 25.3.2 and 26.2.1. |
| 7. | I am independent of the issuer applying all of the tests in section 1.5 of NI 43-101. |
| 8. | I have had prior involvement with the property that is the subject of the Technical Report. The nature of my prior involvement is acting as QP for the technical reports titled “NI 43-101 Technical Report, Prefeasibility Study Update, Segovia Project, Department of Antioquia, Colombia” with an effective date of December 31, 2020; “NI 43-101 Technical Report, Prefeasibility Study Update, Segovia Project, Department of Antioquia, Colombia” with an effective date of December 31, 2019; “NI 43-101 Technical Report, Prefeasibility Study, Segovia Project, Colombia” with an effective date of December 31, 2017. |
| 9. | I have read NI 43-101 and Form 43-101F1 and the sections of the Technical Report I am responsible for have been prepared in compliance with that instrument and form. |
| 10. | As of the aforementioned Effective Date, to the best of my knowledge, information and belief, the sections of the Technical Report I am responsible for contains all scientific and technical information that is required to be disclosed to make the Technical Report not misleading. |
| Dated this 6th Day of May, 2022. |
||||
| “Signed” |
||||
| “Sealed” | ||||
|
Fernando Rodrigues, BS Mining, MBA, MMSAQP [01405QP] |
||||
| U.S. Offices: | Canadian Offices: | Group Offices: | ||||||||||||
| Anchorage | 907.677.3520 | Saskatoon | 306.955.4778 | Africa | ||||||||||
| Clovis | 559.452.0182 | Sudbury | 705.682.3270 | Asia | ||||||||||
| Denver | 303.985.1333 | Toronto | 416.601.1445 | Australia | ||||||||||
| Elko | 775.753.4151 | Vancouver | 604.681.4196 | Europe | ||||||||||
| Reno | 775.828.6800 | North America | ||||||||||||
| Tucson | 520.544.3688 | South America | ||||||||||||
| SRK Consulting (U.S.), Inc. 999 Seventeenth Street Suite 400 Denver, CO 80202
T: 303.985.1333 F: 303.985.9947
denver@srk.com www.srk.com |
CERTIFICATE OF QUALIFIED PERSON
I, Joshua D. Sames, P.E. Civil, B.Sc., do hereby certify that:
| 1. | I am Principal Consultant at SRK Consulting (U.S.), Inc., 5250 Neil Road, Suite 300, Reno, NV, USA 89502. |
| 2. | This certificate applies to the technical report titled “NI 43-101 Technical Report, Prefeasibility Study, Segovia Project, Antioquia, Colombia” with an Effective Date of December 31, 2021 (the “Technical Report”). |
| 3. | I graduated with a degree in Civil Engineering from University of Newcastle Australia in 2005. I am a registered Professional Engineer in the State of Nevada (PE No. 22346). I have worked as an engineer for a total of 16 years. My relevant experience includes site investigations, conceptual and detailed design of tailing storage facilities, construction supervision, management and operational assessments, mine reclamation permitting and closure design and permitting at mining properties in the western United States and South and Central America. |
| 4. | I have read the definition of “qualified person” set out in National Instrument 43-101 (NI 43-101) and certify that by reason of my education, affiliation with a professional association (as defined in NI 43-101) and past relevant work experience, I fulfill the requirements to be a “qualified person” for the purposes of NI 43-101. |
| 5. | I visited the Segovia property on January 28 to January 29, 2020. |
| 6. | I am responsible for Sections 1.9.1, 5.4.4, 18.2 and 26.4.2. |
| 7. | I am independent of the issuer applying all of the tests in section 1.5 of NI 43-101. |
| 8. | I have had prior involvement with the property that is the subject of the Technical Report. The nature of my prior involvement is acting as QP for the technical reports titled “NI 43-101 Technical Report, Prefeasibility Study Update, Segovia Project, Department of Antioquia, Colombia” with an effective date of December 31, 2020; “NI 43-101 Technical Report, Prefeasibility Study Update, Segovia Project, Department of Antioquia, Colombia” with an effective date of December 31, 2019 |
| 9. | I have read NI 43-101 and Form 43-101F1 and the sections of the Technical Report I am responsible for have been prepared in compliance with that instrument and form. |
| 10. | As of the aforementioned Effective Date, to the best of my knowledge, information and belief, the sections of the Technical Report I am responsible for contain all scientific and technical information that is required to be disclosed to make the Technical Report not misleading. |
| Dated this 6th Day of May, 2022. |
||||
| “Signed” |
“Sealed” | |||
| Joshua D. Sames P.E |
||||
| U.S. Offices: | Canadian Offices: | Group Offices: | ||||||||||
| Anchorage | 907.677.3520 | Saskatoon | 306.955.4778 | Africa | ||||||||
| Clovis | 559.452.0182 | Sudbury | 705.682.3270 | Asia | ||||||||
| Denver | 303.985.1333 | Toronto | 416.601.1445 | Australia | ||||||||
| Elko | 775.753.4151 | Vancouver | 604.681.4196 | Europe | ||||||||
| Reno | 775.828.6800 | North America | ||||||||||
| Tucson | 520.544.3688 | South America | ||||||||||
| SRK Consulting (U.S.), Inc. 999 Seventeenth Street Suite 400 Denver, CO 80202
T: 303.985.1333 F: 303.985.9947
denver@srk.com www.srk.com |
CERTIFICATE OF QUALIFIED PERSON
I, Mark Allan Willow, MSc, CEM, SME-RM do hereby certify that:
| 1. | I am Practice Leader/Principal Environmental Scientist of SRK Consulting (U.S.), Inc., 5250 Neil Road, Reno, Nevada 89502. |
| 2. | This certificate applies to the technical report titled “NI 43-101 Technical Report, Prefeasibility Study, Segovia Project, Antioquia, Colombia” with an Effective Date of December 31, 2021 (the “Technical Report”). |
| 3. | I graduated with Bachelor’s degree in Fisheries and Wildlife Management from the University of Missouri in 1987 and a Master’s degree in Environmental Science and Engineering from the Colorado School of Mines in 1995. I have worked as Biologist/Environmental Scientist for over 27 years since my graduation from university. My relevant experience includes environmental due diligence/competent persons evaluations of developmental phase and operational phase mines through the world, including small gold mining projects in Panama, Senegal, Peru, Ecuador, Philippines, and Colombia; open pit and underground coal mines in Russia; large copper and iron mines and processing facilities in Mexico and Brazil; bauxite operations in Jamaica; and a coal mine/coking operation in the People’s Republic of China. My Project Manager experience includes several site characterization and mine closure projects. I work closely with the U.S. Forest Service and U.S. Bureau of Land Management on permitting and mine closure projects to develop uniquely successful and cost-effective closure alternatives for the abandoned mining operations. Finally, I draw upon this diverse background for knowledge and experience as a human health and ecological risk assessor with respect to potential environmental impacts associated with operating and closing mining properties and have experience in the development of Preliminary Remediation Goals and hazard/risk calculations for site remedial action plans under Superfund activities according to current U.S. EPA risk assessment guidance. |
| 4. | I am a Certified Environmental Manager (CEM) in the State of Nevada (#1832) in accordance with Nevada Administrative Code 459.970 through 459.9729. Before any person consults for a fee in matters concerning: the management of hazardous waste; the investigation of a release or potential release of a hazardous substance; the sampling of any media to determine the release of a hazardous substance; the response to a release or cleanup of a hazardous substance; or the remediation soil or water contaminated with a hazardous substance, they must be certified by the Nevada Division of Environmental Protection, Bureau of Corrective Action; |
| 5. | I am a Registered Member (No. 4104492) of the Society for Mining, Metallurgy & Exploration Inc. (SME). |
| 6. | I have read the definition of “qualified person” set out in National Instrument 43-101 (NI 43-101) and certify that by reason of my education, affiliation with a professional association (as defined in NI 43-101) and past relevant work experience, I fulfill the requirements to be a “qualified person” for the purposes of NI 43-101. |
| 7. | I visited the Segovia property on November 29 to November 30, 2016. |
| 8. | I am responsible for Environmental Sections 1.10 (except 1.10.1 and 1.10.2), 4.5, 20 (except 20.1.3, 20.5), 25.7 (except 25.7.1) and 26.6 |
| 9. | I am independent of the issuer applying all of the tests in section 1.5 of NI 43-101. |
| 10. | I have had prior involvement with the property that is the subject of the Technical Report. The nature of my prior involvement is acting as QP for the technical reports titled “NI 43-101 Technical Report, Prefeasibility Study Update, Segovia Project, Department of Antioquia, Colombia” with an effective date |
| U.S. Offices: | Canadian Offices: | Group Offices: | ||||||||
| Anchorage | 907.677.3520 | Saskatoon | 306.955.4778 | Africa | ||||||
| Clovis | 559.452.0182 | Sudbury | 705.682.3270 | Asia | ||||||
| Denver | 303.985.1333 | Toronto | 416.601.1445 | Australia | ||||||
| Elko | 775.753.4151 | Vancouver | 604.681.4196 | Europe | ||||||
| Reno | 775.828.6800 | North America | ||||||||
| Tucson | 520.544.3688 | South America | ||||||||
| Page 2 |
of December 31, 2020; “NI 43-101 Technical Report, Prefeasibility Study Update, Segovia Project, Department of Antioquia, Colombia” with an effective date of December 31, 2019; “NI 43-101 Technical Report, Prefeasibility Study, Segovia Project, Colombia” with an effective date of December 31, 2017.
| 11. | I have read NI 43-101 and Form 43-101F1 and the sections of the Technical Report I am responsible for have been prepared in compliance with that instrument and form. |
| 12. | As of the aforementioned Effective Date, to the best of my knowledge, information and belief, the sections of the Technical Report I am responsible for contains all scientific and technical information that is required to be disclosed to make the Technical Report not misleading. |
| Dated this 6th Day of May, 2022. |
||||
| “Signed” |
Sealed |
|||
| SME-RM# 4104492 |
||||
|
Mark Allan Willow, MSc, CEM, SME-RM |
||||
| SRK Consulting (U.S.), Inc. NI 43-101 Technical Report – Segovia 2021 PFS Update |
Appendices |
Appendix B: Detailed Production Scheduled Information
|
BP/KD |
May 2022 |
| Providencia |
|
|||||||||||||||||||||||||||||||||||||||||||||||||||||||||||||||||||||||||||||||||||||||||||||||||||||||||||||||||||
| Units | Totals | 1/1/2022 | 2/1/2022 | 3/1/2022 | 4/1/2022 | 5/1/2022 | 6/1/2022 | 7/1/2022 | 8/1/2022 | 9/1/2022 | 10/1/2022 | 11/1/2022 | 12/1/2022 | 1/1/2023 | 2/1/2023 | 3/1/2023 | 4/1/2023 | 5/1/2023 | 6/1/2023 | 7/1/2023 | 8/1/2023 | 9/1/2023 | 10/1/2023 | 11/1/2023 | 12/1/2023 | 1/1/2024 | 2/1/2024 | 3/1/2024 | ||||||||||||||||||||||||||||||||||||||||||||||||||||||||||||||||||||||||||||||||||||||||
| Total Ore Tonnes |
(t) | 358,381 | 12,211 | 11,732 | 12,128 | 11,747 | 12,122 | 12,108 | 11,788 | 12,124 | 11,720 | 12,098 | 12,198 | 10,928 | 12,148 | 11,730 | 12,111 | 11,745 | 12,097 | 10,551 | 9,903 | 10,225 | 9,926 | 10,240 | 10,238 | 9,575 | 10,239 | 9,900 | 10,258 | |||||||||||||||||||||||||||||||||||||||||||||||||||||||||||||||||||||||||||||||||||||||
| Grade Au |
(g/t) | 11.10 | 12.20 | 12.20 | 12.31 | 13.28 | 13.03 | 13.79 | 14.21 | 11.97 | 14.46 | 13.35 | 16.03 | 14.56 | 14.13 | 13.68 | 12.98 | 13.44 | 11.92 | 12.78 | 13.02 | 9.62 | 8.62 | 7.89 | 8.49 | 8.09 | 7.40 | 9.15 | 7.01 | |||||||||||||||||||||||||||||||||||||||||||||||||||||||||||||||||||||||||||||||||||||||
| Total Ore Oz In Situ |
(oz) | 127,927 | 4,789 | 4,603 | 4,802 | 5,015 | 5,080 | 5,367 | 5,386 | 4,666 | 5,447 | 5,193 | 6,285 | 5,115 | 5,518 | 5,160 | 5,054 | 5,074 | 4,635 | 4,334 | 4,145 | 3,163 | 2,751 | 2,599 | 2,794 | 2,491 | 2,436 | 2,911 | 2,313 | |||||||||||||||||||||||||||||||||||||||||||||||||||||||||||||||||||||||||||||||||||||||
| Total TPD |
(t) | 394 | 419 | 391 | 392 | 404 | 391 | 380 | 391 | 391 | 390 | 407 | 353 | 392 | 419 | 391 | 392 | 403 | 340 | 319 | 330 | 331 | 330 | 341 | 309 | 330 | 341 | 331 | ||||||||||||||||||||||||||||||||||||||||||||||||||||||||||||||||||||||||||||||||||||||||
| Owner Ore Tonnes |
(t) | 10,265 | 9,932 | 10,268 | 9,932 | 10,262 | 10,247 | 9,988 | 10,238 | 9,917 | 10,236 | 10,312 | 9,248 | 10,260 | 9,905 | 10,242 | 9,908 | 10,239 | 10,230 | 9,903 | 10,225 | 9,926 | 10,240 | 10,238 | 9,575 | 10,239 | 9,900 | 10,258 | 12,090 | |||||||||||||||||||||||||||||||||||||||||||||||||||||||||||||||||||||||||||||||||||||||
| Owner Ore Au |
(g/t) | 11.98 | 10.88 | 11.71 | 12.91 | 12.72 | 11.33 | 9.22 | 9.70 | 13.07 | 12.32 | 15.37 | 13.08 | 11.95 | 12.11 | 10.91 | 12.44 | 10.37 | 12.67 | 13.02 | 9.62 | 8.62 | 7.89 | 8.49 | 8.09 | 7.40 | 9.15 | 7.01 | 6.30 | |||||||||||||||||||||||||||||||||||||||||||||||||||||||||||||||||||||||||||||||||||||||
| Owner Au Oz Mined |
(oz) | 3,953 | 3,474 | 3,865 | 4,121 | 4,198 | 3,732 | 2,962 | 3,193 | 4,168 | 4,054 | 5,095 | 3,890 | 3,942 | 3,857 | 3,593 | 3,963 | 3,415 | 4,168 | 4,145 | 3,163 | 2,751 | 2,599 | 2,794 | 2,491 | 2,436 | 2,911 | 2,313 | 2,449 | |||||||||||||||||||||||||||||||||||||||||||||||||||||||||||||||||||||||||||||||||||||||
| Waste Tonnes |
(t) | 3,444 | 3,351 | 3,034 | 3,664 | 3,867 | 3,518 | 3,929 | 4,105 | 3,928 | 4,195 | 3,919 | 3,406 | 3,152 | 3,163 | 2,393 | 1,341 | 1,314 | 1,114 | 978 | 1,011 | 978 | 1,011 | 913 | 945 | 938 | ||||||||||||||||||||||||||||||||||||||||||||||||||||||||||||||||||||||||||||||||||||||||||
| Owner Cut & Fill Tonnes |
(t) | 938 | 908 | 938 | 908 | 938 | 848 | 908 | 938 | 1,628 | 1,958 | 2,036 | 1,688 | 959 | 908 | 532 | ||||||||||||||||||||||||||||||||||||||||||||||||||||||||||||||||||||||||||||||||||||||||||||||||||||
| Owner Cut & Fill Au |
(g/t) | 57.99 | 27.15 | 36.08 | 39.64 | 39.64 | 39.64 | 39.64 | 39.64 | 37.60 | 29.94 | 28.54 | 20.93 | 24.23 | 42.02 | 40.70 | ||||||||||||||||||||||||||||||||||||||||||||||||||||||||||||||||||||||||||||||||||||||||||||||||||||
| Owner Cut & Fill Oz |
(oz) | 1,749 | 793 | 1,088 | 1,157 | 1,195 | 1,081 | 1,157 | 1,195 | 1,968 | 1,885 | 1,868 | 1,136 | 747 | 1,227 | 696 | ||||||||||||||||||||||||||||||||||||||||||||||||||||||||||||||||||||||||||||||||||||||||||||||||||||
|
Owner Room & Pillar Tonnes |
(t) | 9,327 | 9,024 | 9,330 | 9,024 | 9,324 | 9,399 | 9,080 | 9,300 | 8,289 | 8,278 | 8,277 | 7,560 | 9,301 | 8,997 | 9,711 | 9,908 | 10,239 | 10,230 | 9,903 | 10,225 | 9,926 | 10,240 | 10,238 | 9,575 | 10,239 | 9,900 | 10,258 | 12,090 | |||||||||||||||||||||||||||||||||||||||||||||||||||||||||||||||||||||||||||||||||||||||
| Owner Room & Pillar Au |
(g/t) | 7.35 | 9.24 | 9.26 | 10.22 | 10.02 | 8.77 | 6.18 | 6.68 | 8.26 | 8.15 | 12.13 | 11.33 | 10.68 | 9.09 | 9.28 | 12.44 | 10.37 | 12.67 | 13.02 | 9.62 | 8.62 | 7.89 | 8.49 | 8.09 | 7.40 | 9.15 | 7.01 | 6.30 | |||||||||||||||||||||||||||||||||||||||||||||||||||||||||||||||||||||||||||||||||||||||
| Owner Room & Pillar Oz |
(oz) | 2,204 | 2,681 | 2,777 | 2,964 | 3,003 | 2,652 | 1,805 | 1,998 | 2,200 | 2,169 | 3,227 | 2,754 | 3,195 | 2,630 | 2,898 | 3,963 | 3,415 | 4,168 | 4,145 | 3,163 | 2,751 | 2,599 | 2,794 | 2,491 | 2,436 | 2,911 | 2,313 | 2,449 | |||||||||||||||||||||||||||||||||||||||||||||||||||||||||||||||||||||||||||||||||||||||
| Masora Contractor-Tonnes |
(t) | 1,947 | 1,800 | 1,860 | 1,815 | 1,860 | 1,860 | 1,801 | 1,886 | 1,803 | 1,862 | 1,886 | 1,680 | 1,888 | 1,825 | 1,868 | 1,837 | 1,858 | 321 | |||||||||||||||||||||||||||||||||||||||||||||||||||||||||||||||||||||||||||||||||||||||||||||||||
| Masora Au |
(g/t) | 13.35 | 19.52 | 15.66 | 15.32 | 14.75 | 27.34 | 41.88 | 24.28 | 22.06 | 19.02 | 19.63 | 22.68 | 25.96 | 22.21 | 24.32 | 18.80 | 20.42 | 16.10 | |||||||||||||||||||||||||||||||||||||||||||||||||||||||||||||||||||||||||||||||||||||||||||||||||
| Masora Contractor Oz |
(oz) | 835 | 1,130 | 936 | 894 | 882 | 1,635 | 2,424 | 1,472 | 1,279 | 1,139 | 1,190 | 1,225 | 1,576 | 1,303 | 1,461 | 1,110 | 1,220 | 166 | |||||||||||||||||||||||||||||||||||||||||||||||||||||||||||||||||||||||||||||||||||||||||||||||||
| Development meters total |
(m) | 2,850 | 161 | 145 | 120 | 136 | 170 | 156 | 187 | 199 | 187 | 210 | 176 | 162 | 148 | 157 | 131 | 90 | 68 | 43 | 30 | 31 | 30 | 31 | 28 | 29 | 28 | - | - | |||||||||||||||||||||||||||||||||||||||||||||||||||||||||||||||||||||||||||||||||||||||
| GL - Galeria (3x3.5) |
(m) | 618 | 25 | 69 | 40 | 35 | 51 | 46 | 49 | 51 | 49 | 51 | 51 | 39 | 25 | 25 | 12 | |||||||||||||||||||||||||||||||||||||||||||||||||||||||||||||||||||||||||||||||||||||||||||||||||||
| TB - Tambor (1.5x2) |
(m) | 1,041 | 54 | 37 | 20 | 20 | 58 | 55 | 79 | 87 | 79 | 98 | 64 | 68 | 61 | 73 | 74 | 65 | 37 | 13 | ||||||||||||||||||||||||||||||||||||||||||||||||||||||||||||||||||||||||||||||||||||||||||||||||
| CH - Cruzada ( x ) |
(m) | 1,006 | 19 | 58 | 61 | 55 | 59 | 61 | 59 | 61 | 61 | 55 | 61 | 59 | 45 | 25 | 31 | 31 | 30 | 31 | 30 | 31 | 28 | 29 | 28 | |||||||||||||||||||||||||||||||||||||||||||||||||||||||||||||||||||||||||||||||||||||||||||
| RP - Galeria (3x3.5) |
(m) | 185.15753 | 81.478365 | 39.754758 | 40.739182 | 23.185224 | ||||||||||||||||||||||||||||||||||||||||||||||||||||||||||||||||||||||||||||||||||||||||||||||||||||||||||||||
| Providencia |
Units | 4/1/2024 | 5/1/2024 | 6/1/2024 | 7/1/2024 | 8/1/2024 | 9/1/2024 | 10/1/2024 | 11/1/2024 | 12/1/2024 | ||||||||||||||||||||||||||||||||||||||||||||||||||||||||||||||||||||||||||||||||||||||||||||||||||||||||||
| Total Ore Tonnes |
(t) | 9,914 | 10,231 | 10,236 | 9,921 | 9,923 | 1,933 | 930 | 930 | 572 | ||||||||||||||||||||||||||||||||||||||||||||||||||||||||||||||||||||||||||||||||||||||||||||||||||||||||||
| Grade Au |
(g/t) | 6.56 | 6.06 | 5.25 | 4.97 | 6.71 | 7.96 | 10.04 | 10.04 | 8.90 | ||||||||||||||||||||||||||||||||||||||||||||||||||||||||||||||||||||||||||||||||||||||||||||||||||||||||||
| Total Ore Oz In Situ |
(oz) | 2,092 | 1,995 | 1,727 | 1,587 | 2,142 | 495 | 300 | 300 | 164 | ||||||||||||||||||||||||||||||||||||||||||||||||||||||||||||||||||||||||||||||||||||||||||||||||||||||||||
| Total TPD |
(t) | 330 | 341 | 330 | 320 | 320 | 64 | 30 | 31 | 18 | ||||||||||||||||||||||||||||||||||||||||||||||||||||||||||||||||||||||||||||||||||||||||||||||||||||||||||
| Owner Ore Tonnes |
(t) | 9,914 | 10,231 | 10,236 | 9,921 | 9,923 | 1,933 | 930 | 930 | 572 | ||||||||||||||||||||||||||||||||||||||||||||||||||||||||||||||||||||||||||||||||||||||||||||||||||||||||||
| Owner Ore Au |
(g/t) | 6.56 | 6.06 | 5.25 | 4.97 | 6.71 | 7.96 | 10.04 | 10.04 | 8.90 | ||||||||||||||||||||||||||||||||||||||||||||||||||||||||||||||||||||||||||||||||||||||||||||||||||||||||||
| Owner Au Oz Mined |
(oz) | 2,092 | 1,995 | 1,727 | 1,587 | 2,142 | 495 | 300 | 300 | 164 | ||||||||||||||||||||||||||||||||||||||||||||||||||||||||||||||||||||||||||||||||||||||||||||||||||||||||||
| Waste Tonnes |
(t) | |||||||||||||||||||||||||||||||||||||||||||||||||||||||||||||||||||||||||||||||||||||||||||||||||||||||||||||||||||
| Owner Cut & Fill Tonnes |
(t) | |||||||||||||||||||||||||||||||||||||||||||||||||||||||||||||||||||||||||||||||||||||||||||||||||||||||||||||||||||
| Owner Cut & Fill Au |
(g/t) | |||||||||||||||||||||||||||||||||||||||||||||||||||||||||||||||||||||||||||||||||||||||||||||||||||||||||||||||||||
| Owner Cut & Fill Oz |
(oz) | |||||||||||||||||||||||||||||||||||||||||||||||||||||||||||||||||||||||||||||||||||||||||||||||||||||||||||||||||||
|
Owner Room & Pillar Tonnes |
(t) | 9,914 | 10,231 | 10,236 | 9,921 | 9,923 | 1,933 | 930 | 930 | 572 | ||||||||||||||||||||||||||||||||||||||||||||||||||||||||||||||||||||||||||||||||||||||||||||||||||||||||||
| Owner Room & Pillar Au |
(g/t) | 6.56 | 6.06 | 5.25 | 4.97 | 6.71 | 7.96 | 10.04 | 10.04 | 8.90 | ||||||||||||||||||||||||||||||||||||||||||||||||||||||||||||||||||||||||||||||||||||||||||||||||||||||||||
| Owner Room & Pillar Oz |
(oz) | 2,092 | 1,995 | 1,727 | 1,587 | 2,142 | 495 | 300 | 300 | 164 | ||||||||||||||||||||||||||||||||||||||||||||||||||||||||||||||||||||||||||||||||||||||||||||||||||||||||||
|
Masora Contractor-Tonnes |
(t) | |||||||||||||||||||||||||||||||||||||||||||||||||||||||||||||||||||||||||||||||||||||||||||||||||||||||||||||||||||
| Masora Au |
(g/t) | |||||||||||||||||||||||||||||||||||||||||||||||||||||||||||||||||||||||||||||||||||||||||||||||||||||||||||||||||||
| Masora Contractor Oz |
(oz) | |||||||||||||||||||||||||||||||||||||||||||||||||||||||||||||||||||||||||||||||||||||||||||||||||||||||||||||||||||
| Development meters total |
(m) | |||||||||||||||||||||||||||||||||||||||||||||||||||||||||||||||||||||||||||||||||||||||||||||||||||||||||||||||||||
| GL - Galeria (3x3.5) |
(m) | |||||||||||||||||||||||||||||||||||||||||||||||||||||||||||||||||||||||||||||||||||||||||||||||||||||||||||||||||||
| TB -Tambor (1.5x2) |
(m) | |||||||||||||||||||||||||||||||||||||||||||||||||||||||||||||||||||||||||||||||||||||||||||||||||||||||||||||||||||
| CH - Cruzada ( x ) |
(m) | |||||||||||||||||||||||||||||||||||||||||||||||||||||||||||||||||||||||||||||||||||||||||||||||||||||||||||||||||||
| RP - Galeria (3x3.5) |
(m) | |||||||||||||||||||||||||||||||||||||||||||||||||||||||||||||||||||||||||||||||||||||||||||||||||||||||||||||||||||
|
Page 1 of 5 |
| Carla | Units | Totals | 1/1/2022 | 2/1/2022 | 3/1/2022 | 4/1/2022 | 5/1/2022 | 6/1/2022 | 7/1/2022 | 8/1/2022 | 9/1/2022 | 10/1/2022 | 11/1/2022 | 12/1/2022 | 1/1/2023 | 2/1/2023 | 3/1/2023 | 4/1/2023 | 5/1/2023 | 6/1/2023 | 7/1/2023 | 8/1/2023 | 9/1/2023 | 10/1/2023 | 11/1/2023 | 12/1/2023 | 1/1/2024 | 2/1/2024 | 3/1/2024 | |||||||||||||||||||||||||||||||||||||||||||||||||||||||||||||||||||||||||||||||||||||||||
| Total_Ore_Tonnes |
(t) | 72,193 | 1,660 | 2,260 | 2,400 | 2,400 | 2,400 | 2,400 | 2,080 | 1,800 | 1,860 | 1,001 | 1,391 | 1,860 | 1,680 | 1,820 | 1,800 | 1,860 | 1,800 | 1,860 | 1,860 | 1,800 | 1,521 | 1,800 | 1,860 | 1,860 | 1,740 | 1,860 | 1,800 | |||||||||||||||||||||||||||||||||||||||||||||||||||||||||||||||||||||||||||||||||||||||||
| Grade Au |
(g/t | ) | 9.55 | 6.12 | 4.97 | 5.57 | 9.29 | 9.74 | 8.13 | 8.71 | 8.97 | 9.08 | 8.75 | 7.39 | 7.37 | 7.37 | 8.49 | 13.23 | 13.23 | 13.23 | 13.23 | 17.48 | 17.92 | 18.20 | 12.49 | 12.49 | 12.49 | 12.49 | 12.49 | 12.49 | ||||||||||||||||||||||||||||||||||||||||||||||||||||||||||||||||||||||||||||||||||||||||
| Total Au Oz Mined |
(oz | ) | 22,157 | 327 | 361 | 430 | 717 | 752 | 627 | 582 | 519 | 543 | 282 | 330 | 441 | 398 | 497 | 766 | 791 | 766 | 791 | 1,045 | 1,037 | 890 | 723 | 747 | 747 | 699 | 747 | 723 | ||||||||||||||||||||||||||||||||||||||||||||||||||||||||||||||||||||||||||||||||||||||||
| TPD |
(t) | 54 | 81 | 77 | 80 | 80 | 77 | 67 | 58 | 62 | 32 | 46 | 60 | 54 | 65 | 58 | 62 | 60 | 60 | 60 | 58 | 51 | 58 | 62 | 60 | 56 | 64 | 58 | ||||||||||||||||||||||||||||||||||||||||||||||||||||||||||||||||||||||||||||||||||||||||||
| Waste Tonnes |
(t) | 42,489 | 504 | 2,066 | 2,541 | 2,596 | 2,067 | 1,720 | 1,903 | 2,614 | 1,424 | 1,042 | 785 | 903 | 801 | 1,213 | 1,011 | 601 | 390 | 573 | 536 | 390 | 403 | 615 | 1,272 | 787 | 821 | 817 | 1,408 | |||||||||||||||||||||||||||||||||||||||||||||||||||||||||||||||||||||||||||||||||||||||||
| TPD Waste |
(t) | 16 | 74 | 82 | 87 | 69 | 55 | 61 | 84 | 47 | 34 | 26 | 29 | 26 | 43 | 33 | 20 | 13 | 18 | 17 | 13 | 13 | 20 | 42 | 25 | 26 | 28 | 45 | ||||||||||||||||||||||||||||||||||||||||||||||||||||||||||||||||||||||||||||||||||||||||||
|
Capacity Extraction APQ 8230 |
160 | 160 | 160 | 160 | 160 | 160 | 160 | 250 | 250 | 250 | 250 | 250 | 250 | 250 | 250 | 250 | 250 | 250 | 250 | 250 | 250 | 250 | 250 | 250 | 250 | 250 | 250 | |||||||||||||||||||||||||||||||||||||||||||||||||||||||||||||||||||||||||||||||||||||||||||
| Development meters |
(m) | 3,153 | 45.5 | 164.0 | 201.3 | 170.5 | 124.0 | 103.1 | 131.4 | 172.3 | 134.7 | 109.5 | 81.0 | 91.7 | 85.2 | 114.0 | 75.0 | 34.4 | 14.8 | 26.7 | 24.2 | 14.8 | 15.3 | 33.5 | 95.7 | 60.5 | 61.9 | 51.5 | 104.2 | |||||||||||||||||||||||||||||||||||||||||||||||||||||||||||||||||||||||||||||||||||||||||
| Galeria |
(m) | 808 | 10.5 | 85.9 | 99.0 | 81.5 | 78.9 | 22.3 | 28.7 | 39.4 | 40.7 | 39.4 | 9.2 | 40.7 | 3.3 | 17.3 | 24.6 | 7.3 | 39.4 | |||||||||||||||||||||||||||||||||||||||||||||||||||||||||||||||||||||||||||||||||||||||||||||||||||
| Crucero |
(m) | 416 | 14.9 | 30.6 | 47.0 | 30.6 | 0.8 | 18.4 | 24.8 | 23.7 | 25.2 | 49.6 | 8.3 | 1.4 | 30.6 | 4.5 | 23.5 | |||||||||||||||||||||||||||||||||||||||||||||||||||||||||||||||||||||||||||||||||||||||||||||||||||||
| Chimenea |
(m) | 195 | 4.1 | 30.6 | 29.6 | 30.6 | 32.0 | 59.1 | 9.4 | |||||||||||||||||||||||||||||||||||||||||||||||||||||||||||||||||||||||||||||||||||||||||||||||||||||||||||||
| Tambor |
(m) | 1,103 | 18.0 | 32.3 | 36.5 | 12.7 | 16.5 | 30.6 | 58.9 | 81.9 | 70.0 | 48.2 | 51.0 | 56.8 | 57.4 | 37.1 | 12.7 | 25.3 | 40.7 | 38.1 | 13.7 | 18.8 | ||||||||||||||||||||||||||||||||||||||||||||||||||||||||||||||||||||||||||||||||||||||||||||||||
| |
(m) | 219 | 4.4 | 15.3 | 14.8 | 2.7 | 2.8 | 14.8 | 6.4 | 11.4 | 8.9 | 9.5 | 15.3 | 7.7 | ||||||||||||||||||||||||||||||||||||||||||||||||||||||||||||||||||||||||||||||||||||||||||||||||||||||||
| Apique |
(m) | 413 | 2.0 | 15.3 | 14.8 | 15.3 | 14.8 | 10.9 | 4.1 | 14.8 | 15.3 | 14.8 | 15.3 | 15.3 | 14.8 | 15.3 | 14.8 | 15.3 | 15.3 | 14.3 | 15.3 | 14.8 | ||||||||||||||||||||||||||||||||||||||||||||||||||||||||||||||||||||||||||||||||||||||||||||||||
| Carla |
Units | 4/1/2024 | 5/1/2024 | 6/1/2024 | 7/1/2024 | 8/1/2024 | 9/1/2024 | 10/1/2024 | 11/1/2024 | 12/1/2024 | 1/1/2025 | 2/1/2025 | 3/1/2025 | 4/1/2025 | 5/1/2025 | 6/1/2025 | 7/1/2025 | |||||||||||||||||||||||||||||||||||||||||||||||||||||||||||||||||||||||||||||||||||||||||||||||||||||
| Total_Ore_Tonnes |
(t) | 1,860 | 1,800 | 1,799 | 1,860 | 1,800 | 1,762 | 1,132 | 1,518 | 930 | 840 | 1,655 | 1,800 | 992 | 900 | 930 | 183 | |||||||||||||||||||||||||||||||||||||||||||||||||||||||||||||||||||||||||||||||||||||||||||||||||||||
| Grade Au |
(g/t | ) | 12.49 | 12.40 | 5.09 | 4.82 | 4.82 | 4.73 | 4.97 | 5.50 | 6.05 | 6.05 | 6.76 | 6.86 | 7.56 | 7.66 | 7.66 | 7.66 | ||||||||||||||||||||||||||||||||||||||||||||||||||||||||||||||||||||||||||||||||||||||||||||||||||||
| Total Au Oz Mined |
(oz | ) | 747 | 717 | 294 | 288 | 279 | 268 | 181 | 269 | 181 | 163 | 359 | 397 | 241 | 222 | 229 | 45 | ||||||||||||||||||||||||||||||||||||||||||||||||||||||||||||||||||||||||||||||||||||||||||||||||||||
| TPD |
(t) | 62 | 60 | 58 | 60 | 58 | 59 | 37 | 51 | 30 | 27 | 59 | 58 | 33 | 30 | 30 | 6 | |||||||||||||||||||||||||||||||||||||||||||||||||||||||||||||||||||||||||||||||||||||||||||||||||||||
| Waste Tonnes |
(t) | 1,025 | 622 | 882 | 1,687 | 949 | 832 | 1,054 | 1,563 | 973 | 765 | 333 | ||||||||||||||||||||||||||||||||||||||||||||||||||||||||||||||||||||||||||||||||||||||||||||||||||||||||||
| TPD Waste |
(t) | 34 | 21 | 28 | 54 | 31 | 28 | 34 | 52 | 31 | 25 | 12 | ||||||||||||||||||||||||||||||||||||||||||||||||||||||||||||||||||||||||||||||||||||||||||||||||||||||||||
|
Capacity Extraction APQ 8230 |
250 | 250 | 250 | 250 | 250 | 250 | 250 | 250 | 250 | 250 | 250 | 250 | 250 | 250 | 250 | 250 | ||||||||||||||||||||||||||||||||||||||||||||||||||||||||||||||||||||||||||||||||||||||||||||||||||||||
| Development meters |
(m) | 79.0 | 39.6 | 54.9 | 124.7 | 73.6 | 63.0 | 73.5 | 119.5 | 82.1 | 73.7 | 29.2 | - | - | - | - | - | |||||||||||||||||||||||||||||||||||||||||||||||||||||||||||||||||||||||||||||||||||||||||||||||||||||
| Galeria |
(m) | 13.9 | 16.5 | 51.0 | 8.1 | 24.7 | 25.9 | |||||||||||||||||||||||||||||||||||||||||||||||||||||||||||||||||||||||||||||||||||||||||||||||||||||||||||||||
| Crucero |
(m) | 12.9 | 26.7 | 8.8 | 0.1 | 30.6 | 2.8 | |||||||||||||||||||||||||||||||||||||||||||||||||||||||||||||||||||||||||||||||||||||||||||||||||||||||||||||||
| Chimenea |
(m) | |||||||||||||||||||||||||||||||||||||||||||||||||||||||||||||||||||||||||||||||||||||||||||||||||||||||||||||||||||||
| Tambor |
(m) | 36.9 | 19.7 | 7.9 | 16.5 | 39.4 | 40.7 | 19.1 | 34.0 | 61.1 | 55.2 | 15.0 | ||||||||||||||||||||||||||||||||||||||||||||||||||||||||||||||||||||||||||||||||||||||||||||||||||||||||||
| |
(m) | 5.1 | 15.3 | 15.3 | 2.6 | 7.0 | 14.8 | 13.8 | 2.9 | 13.8 | 14.3 | |||||||||||||||||||||||||||||||||||||||||||||||||||||||||||||||||||||||||||||||||||||||||||||||||||||||||||
| Apique |
(m) | 15.3 | 14.8 | 15.3 | 15.3 | 14.8 | 15.3 | 14.8 | 15.3 | 15.3 | 4.7 | |||||||||||||||||||||||||||||||||||||||||||||||||||||||||||||||||||||||||||||||||||||||||||||||||||||||||||
Page 2 of 5
| Sandra K |
Units | Totals | 1/1/2022 | 2/1/2022 | 3/1/2022 | 4/1/2022 | 5/1/2022 | 6/1/2022 | 7/1/2022 | 8/1/2022 | 9/1/2022 | 10/1/2022 | 11/1/2022 | 12/1/2022 | 1/1/2023 | 2/1/2023 | 3/1/2023 | 4/1/2023 | 5/1/2023 | 6/1/2023 | 7/1/2023 | 8/1/2023 | 9/1/2023 | 10/1/2023 | 11/1/2023 | 12/1/2023 1/1/2024 2/1/2024 3/1/2024 | ||||||||||||||||||||||||||||||||||||||||||||||||||||||||||||||||||||||||||||||||||||||||||||
| Total Ore_Tonnes |
(t) | 399,036 | 11,388 | 10,892 | 11,249 | 10,861 | 11,247 | 11,249 | 10,893 | 11,241 | 10,884 | 11,268 | 11,138 | 10,081 | 11,201 | 10,734 | 11,177 | 10,806 | 11,170 | 11,169 | 10,829 | 11,240 | 10,799 | 11,134 | 11,160 | 10,443 | 11,303 | 11,289 | 11,160 | |||||||||||||||||||||||||||||||||||||||||||||||||||||||||||||||||||||||||||||||||||||||||
| Grade Au |
(g/t) | 8.01 | 7.65 | 8.93 | 7.84 | 7.78 | 9.10 | 7.96 | 8.21 | 6.99 | 6.55 | 6.80 | 7.98 | 10.91 | 10.70 | 10.35 | 10.50 | 8.22 | 6.67 | 8.23 | 7.96 | 8.21 | 7.91 | 8.64 | 8.68 | 8.56 | 8.16 | 6.97 | 7.06 | |||||||||||||||||||||||||||||||||||||||||||||||||||||||||||||||||||||||||||||||||||||||||
| Total Au Oz Mined |
(oz) | 102,754 | 2,800 | 3,126 | 2,835 | 2,718 | 3,292 | 2,879 | 2,874 | 2,526 | 2,292 | 2,465 | 2,856 | 3,538 | 3,853 | 3,571 | 3,772 | 2,855 | 2,394 | 2,955 | 2,772 | 2,967 | 2,747 | 3,092 | 3,115 | 2,874 | 2,966 | 2,530 | 2,533 | |||||||||||||||||||||||||||||||||||||||||||||||||||||||||||||||||||||||||||||||||||||||||
| TPD |
(t) | 367 | 389 | 363 | 362 | 375 | 363 | 351 | 363 | 363 | 363 | 371 | 325 | 361 | 383 | 361 | 360 | 372 | 360 | 349 | 363 | 360 | 359 | 372 | 337 | 365 | 389 | 360 | ||||||||||||||||||||||||||||||||||||||||||||||||||||||||||||||||||||||||||||||||||||||||||
| Waste Tonnes |
(t) | 205,976 | 3,630 | 5,563 | 6,338 | 5,581 | 5,325 | 5,371 | 5,010 | 6,508 | 6,992 | 6,657 | 6,459 | 5,489 | 6,187 | 7,134 | 6,865 | 5,975 | 5,376 | 7,102 | 8,014 | 9,004 | 7,915 | 7,334 | 6,415 | 6,849 | 6,686 | 6,362 | 4,899 | |||||||||||||||||||||||||||||||||||||||||||||||||||||||||||||||||||||||||||||||||||||||||
| TPD Waste |
(t) | 117 | 199 | 204 | 186 | 178 | 173 | 162 | 210 | 233 | 215 | 215 | 177 | 200 | 255 | 221 | 199 | 179 | 229 | 259 | 290 | 264 | 237 | 214 | 221 | 216 | 219 | 158 | ||||||||||||||||||||||||||||||||||||||||||||||||||||||||||||||||||||||||||||||||||||||||||
|
Capacity Extraction APQ 6400 |
720 | 720 | 720 | 720 | 720 | 720 | 720 | 720 | 920 | 920 | 920 | 920 | 920 | 920 | 920 | 920 | 920 | 920 | 920 | 920 | 920 | 920 | 920 | 920 | 920 | 920 | 920 | |||||||||||||||||||||||||||||||||||||||||||||||||||||||||||||||||||||||||||||||||||||||||||
| Development meters total |
(m) | 10,869 | 278 | 284 | 285 | 285 | 299 | 316 | 294 | 304 | 348 | 378 | 387 | 363 | 366 | 340 | 366 | 365 | 324 | 361 | 372 | 381 | 379 | 381 | 343 | 344 | 336 | 313 | 260 | |||||||||||||||||||||||||||||||||||||||||||||||||||||||||||||||||||||||||||||||||||||||||
| Gl_Conv_meters (2.5x2.5) |
(m) | 1,243 | 3 | 65 | 127 | 141 | 54 | 28 | 16 | 83 | 67 | 55 | 37 | 28 | 31 | 30 | 28 | 61 | 59 | 61 | 59 | 61 | 61 | 41 | 31 | 16 | ||||||||||||||||||||||||||||||||||||||||||||||||||||||||||||||||||||||||||||||||||||||||||||
| Gl_Mec_meters (3.5x3.5) |
(m) | 3,240 | 61 | 59 | 41 | 30 | 4 | 17 | 50 | 55 | 30 | 31 | 73 | 66 | 92 | 95 | 13 | 59 | 92 | 122 | 140 | 160 | 155 | 147 | 152 | 142 | 142 | 162 | 124 | |||||||||||||||||||||||||||||||||||||||||||||||||||||||||||||||||||||||||||||||||||||||||
| Rai_meters (3m dia) |
(m) | 442 | 19 | 17 | 31 | 30 | 28 | 32 | 54 | 31 | 23 | 29 | 31 | 21 | ||||||||||||||||||||||||||||||||||||||||||||||||||||||||||||||||||||||||||||||||||||||||||||||||||||||||
| Ap_meters (3.7x3.0) |
(m) | 165 | 15 | 7 | 15 | 15 | 15 | 14 | 15 | 14 | 15 | 15 | 14 | 11 | ||||||||||||||||||||||||||||||||||||||||||||||||||||||||||||||||||||||||||||||||||||||||||||||||||||||||
| Rp_meters (3.5x3.5) |
(m) | 1,313 | 84 | 122 | 84 | 81 | 48 | 35 | 77 | 109 | 81 | 55 | 37 | 41 | 53 | 81 | 44 | 12 | 41 | 49 | 81 | 44 | 41 | 13 | ||||||||||||||||||||||||||||||||||||||||||||||||||||||||||||||||||||||||||||||||||||||||||||||
| Tb_meters (2.0x1.5) |
(m) | 3,481 | 178 | 107 | 55 | 22 | 9 | 39 | 103 | 74 | 109 | 132 | 141 | 159 | 135 | 56 | 99 | 149 | 129 | 94 | 70 | 48 | 80 | 122 | 117 | 102 | 107 | 114 | 136 | |||||||||||||||||||||||||||||||||||||||||||||||||||||||||||||||||||||||||||||||||||||||||
| Xc_meters (2.5x2.5 to 3.5x3.5) |
(m) | 985 | 36 | 34 | 67 | 69 | 71 | 71 | 52 | 51 | 52 | 36 | 36 | 32 | 46 | 94 | 96 | 38 | 21 | 18 | 10 | 30 | 25 | |||||||||||||||||||||||||||||||||||||||||||||||||||||||||||||||||||||||||||||||||||||||||||||||
| Sandra K |
Units | 4/1/2024 5/1/2024 | 6/1/2024 | 7/1/2024 | 8/1/2024 | 9/1/2024 | 10/1/2024 | 11/1/2024 | 12/1/2024 | 1/1/2025 | 2/1/2025 | 3/1/2025 | 4/1/2025 | 5/1/2025 | 6/1/2025 | 7/1/2025 | 8/1/2025 | 9/1/2025 | 10/1/2025 | 11/1/2025 | 12/1/2025 | 01/2026 | 02/2026 | 03/2026 | 04/2026 | 05/2026 | 06/2026 | |||||||||||||||||||||||||||||||||||||||||||||||||||||||||||||||||||||||||||||||||||||||||||
| Total Ore_Tonnes |
(t) | 10,982 | 9,118 | 7,803 | 6,456 | 6,510 | 4,875 | 4,594 | 3,720 | 3,360 | 3,360 | 3,600 | 3,720 | 3,431 | 2,790 | 2,790 | 3,597 | 3,440 | 2,520 | 4,556 | 2,245 | 840 | 930 | 900 | 930 | 900 | 930 | 840 | ||||||||||||||||||||||||||||||||||||||||||||||||||||||||||||||||||||||||||||||||||||||||||
| Grade Au |
(g/t) | 6.86 | 6.38 | 6.21 | 6.12 | 5.73 | 5.58 | 5.78 | 6.79 | 6.79 | 6.79 | 6.79 | 6.79 | 6.91 | 7.59 | 7.59 | 13.14 | 13.51 | 14.73 | 12.12 | 5.41 | 4.68 | 4.68 | 4.68 | 4.68 | 4.68 | 4.68 | 4.68 | ||||||||||||||||||||||||||||||||||||||||||||||||||||||||||||||||||||||||||||||||||||||||||
| Total Au Oz Mined |
(oz) | 2,424 | 1,869 | 1,557 | 1,269 | 1,200 | 874 | 854 | 812 | 734 | 734 | 786 | 812 | 762 | 681 | 681 | 1,520 | 1,494 | 1,193 | 1,775 | 390 | 126 | 140 | 135 | 140 | 135 | 140 | 126 | ||||||||||||||||||||||||||||||||||||||||||||||||||||||||||||||||||||||||||||||||||||||||||
| TPD |
(t) | 366 | 304 | 252 | 208 | 210 | 163 | 148 | 124 | 108 | 108 | 129 | 120 | 114 | 93 | 90 | 116 | 111 | 84 | 147 | 75 | 27 | 30 | 32 | 30 | 30 | 31 | 27 | ||||||||||||||||||||||||||||||||||||||||||||||||||||||||||||||||||||||||||||||||||||||||||
| Waste Tonnes |
(t) | 4,087 | 5,588 | 5,738 | 5,129 | 4,249 | 2,881 | 2,097 | 1,894 | 935 | 935 | 918 | 121 | 141 | 145 | 78 | — | — | — | — | — | — | ||||||||||||||||||||||||||||||||||||||||||||||||||||||||||||||||||||||||||||||||||||||||||||||||
| TPD Waste |
(t) | 136 | 186 | 185 | 165 | 137 | 96 | 68 | 63 | 30 | 30 | 33 | 4 | 5 | 5 | 3 | — | — | — | — | — | — | ||||||||||||||||||||||||||||||||||||||||||||||||||||||||||||||||||||||||||||||||||||||||||||||||
|
Capacity Extraction APQ 6400 |
920 | 920 | 920 | 920 | 920 | 920 | 920 | 920 | 920 | 920 | 920 | 920 | 920 | 920 | 920 | 920 | 920 | 920 | 920 | 920 | 920 | 920 | 920 | 920 | 920 | 920 | 920 | |||||||||||||||||||||||||||||||||||||||||||||||||||||||||||||||||||||||||||||||||||||||||||
| Development meters total |
(m) | 241 | 285 | 270 | 245 | 213 | 164 | 110 | 85 | 46 | 46 | 44 | 17 | 20 | 20 | 11 | — | — | — | — | — | — | ||||||||||||||||||||||||||||||||||||||||||||||||||||||||||||||||||||||||||||||||||||||||||||||||
| Gl_Conv_meters (2.5x2.5) |
(m) | |||||||||||||||||||||||||||||||||||||||||||||||||||||||||||||||||||||||||||||||||||||||||||||||||||||||||||||||||||||
| Gl_Mec_meters (3.5x3.5) |
(m) | 99 | 134 | 153 | 141 | 121 | 78 | 59 | 58 | 28 | 28 | 27 | ||||||||||||||||||||||||||||||||||||||||||||||||||||||||||||||||||||||||||||||||||||||||||||||||||||||||||
| Rai_meters (3m dia) |
(m) | 31 | 31 | 30 | 4 | |||||||||||||||||||||||||||||||||||||||||||||||||||||||||||||||||||||||||||||||||||||||||||||||||||||||||||||||||
Page 3 of 5
| El Silencio |
Units | Totals |
1/1/2022 | 2/1/2022 | 3/1/2022 | 4/1/2022 | 5/1/2022 | 6/1/2022 | 7/1/2022 | 8/1/2022 | 9/1/2022 | 10/1/2022 | 11/1/2022 | 12/1/2022 | 1/1/2023 | 2/1/2023 | 3/1/2023 | 4/1/2023 | 5/1/2023 | 6/1/2023 | 7/1/2023 | 8/1/2023 | 9/1/2023 | 10/1/2023 | 11/1/2023 | 12/1/2023 | 1/1/2024 | 2/1/2024 | 3/1/2024 | |||||||||||||||||||||||||||||||||||||||||||||||||||||||||||||||||||||||||||||||||||||||
| Total Ore Tonnes |
(t) | 1,460,863 | 23,473 | 22,525 | 19,617 | 21,469 | 23,653 | 23,534 | 22,132 | 23,272 | 23,059 | 24,215 | 21,986 | 21,905 | 21,867 | 20,839 | 21,928 | 21,140 | 22,034 | 21,614 | 21,390 | 21,215 | 21,569 | 22,445 | 22,089 | 21,338 | 22,594 | 21,960 | 22,773 | |||||||||||||||||||||||||||||||||||||||||||||||||||||||||||||||||||||||||||||||||||||||
| Grade Au |
(g/t) | 10 | 14 | 14 | 13 | 13 | 14 | 13 | 16 | 15 | 15 | 14 | 12 | 13 | 13 | 13 | 13 | 13 | 13 | 13 | 13 | 12 | 11 | 11 | 11 | 12 | 12 | 11 | 11 | |||||||||||||||||||||||||||||||||||||||||||||||||||||||||||||||||||||||||||||||||||||||
| Total Au Oz Mined |
(oz) | 491,823 | 10,234 | 10,242 | 8,274 | 9,058 | 10,818 | 10,185 | 11,395 | 11,430 | 11,423 | 10,874 | 8,485 | 9,380 | 9,265 | 8,633 | 9,234 | 8,965 | 9,470 | 9,246 | 9,138 | 8,277 | 7,751 | 7,851 | 7,507 | 8,061 | 8,925 | 7,828 | 7,735 | |||||||||||||||||||||||||||||||||||||||||||||||||||||||||||||||||||||||||||||||||||||||
| Total TPD |
(t) | 757 | 804 | 633 | 716 | 788 | 759 | 714 | 751 | 769 | 781 | 733 | 707 | 705 | 744 | 707 | 705 | 734 | 697 | 690 | 684 | 719 | 724 | 736 | 688 | 729 | 757 | 735 | ||||||||||||||||||||||||||||||||||||||||||||||||||||||||||||||||||||||||||||||||||||||||
| Waste Tonnes |
(t) | 160,638 | 5,633 | 4,900 | 5,118 | 4,320 | 4,931 | 5,930 | 7,412 | 6,449 | 7,132 | 7,849 | 7,584 | 7,792 | 7,342 | 5,334 | 4,292 | 3,848 | 4,767 | 4,681 | 5,005 | 4,878 | 4,084 | 3,142 | 3,178 | 2,812 | 2,927 | 2,771 | 2,475 | |||||||||||||||||||||||||||||||||||||||||||||||||||||||||||||||||||||||||||||||||||||||
| Development meters total |
(m) | 8,670 | 286 | 248 | 253 | 217 | 237 | 265 | 335 | 286 | 308 | 352 | 338 | 386 | 374 | 290 | 217 | 208 | 294 | 296 | 327 | 287 | 230 | 198 | 192 | 168 | 180 | 171 | 146 | |||||||||||||||||||||||||||||||||||||||||||||||||||||||||||||||||||||||||||||||||||||||
| Metros_RP |
(m) | 636 | 41 | 37 | 41 | 39 | 41 | 39 | 69 | 81 | 79 | 49 | 39 | 41 | 39 | |||||||||||||||||||||||||||||||||||||||||||||||||||||||||||||||||||||||||||||||||||||||||||||||||||||
| Metros Gl Mec |
(m) | 1,171 | 73 | 37 | 41 | 40 | 81 | 79 | 81 | 41 | 39 | 41 | 78 | 81 | 81 | 74 | 71 | 39 | 41 | 39 | 41 | 41 | 31 | |||||||||||||||||||||||||||||||||||||||||||||||||||||||||||||||||||||||||||||||||||||||||||||
| Metros XC 3.5_3.5 |
(m) | 183 | 10 | 37 | 32 | 26 | 24 | 42 | 1 | 12 | ||||||||||||||||||||||||||||||||||||||||||||||||||||||||||||||||||||||||||||||||||||||||||||||||||||||||||
| Metros XC 2.2_2.3 |
(m) | 1,066 | 31 | 28 | 11 | 19 | 13 | 11 | 30 | 46 | 42 | 56 | 61 | 24 | 9 | 47 | 47 | 41 | 30 | 2 | 16 | 52 | 61 | |||||||||||||||||||||||||||||||||||||||||||||||||||||||||||||||||||||||||||||||||||||||||||||
| Metros AP 2.5x2.5 |
(m) | 85 | 20 | 18 | 20 | 20 | 6 | |||||||||||||||||||||||||||||||||||||||||||||||||||||||||||||||||||||||||||||||||||||||||||||||||||||||||||||
| Metros AP 3.7_3.0 |
(m) | 405 | 17 | 20 | 20 | 20 | 20 | 20 | 20 | 20 | 18 | 20 | 20 | 20 | 20 | 20 | 20 | 20 | 20 | 20 | 20 | 20 | 8 | |||||||||||||||||||||||||||||||||||||||||||||||||||||||||||||||||||||||||||||||||||||||||||||
| Metros CH 2_2 |
(m) | 175 | 1 | 31 | 31 | 52 | 31 | 28 | 2 | |||||||||||||||||||||||||||||||||||||||||||||||||||||||||||||||||||||||||||||||||||||||||||||||||||||||||||
| Metros TB |
(m) | 2,413 | 61 | 55 | 61 | 84 | 73 | 74 | 105 | 92 | 85 | 73 | 52 | 71 | 78 | 76 | 57 | 61 | 124 | 132 | 142 | 71 | 46 | 46 | 34 | 61 | 57 | 29 | 19 | |||||||||||||||||||||||||||||||||||||||||||||||||||||||||||||||||||||||||||||||||||||||
| Metros CH 3.5_3.5 |
(m) | 1,020 | 29 | 31 | 31 | 30 | 47 | 58 | 31 | 31 | 28 | 16 | 30 | 31 | 30 | 31 | 31 | 30 | 31 | 30 | 31 | 31 | 29 | 31 | ||||||||||||||||||||||||||||||||||||||||||||||||||||||||||||||||||||||||||||||||||||||||||||
| Metros GL 2.2_2.3 |
(m) | 1,277 | 31 | 28 | 31 | 3 | 14 | 29 | 9 | 11 | 31 | 28 | 37 | 59 | 61 | 62 | 84 | 61 | 43 | 59 | 59 | 33 | 47 | 54 | 36 | |||||||||||||||||||||||||||||||||||||||||||||||||||||||||||||||||||||||||||||||||||||||||||
| Metros PKT |
(m) | 240 | 20 | 9 | 18 | 5 | 17 | 4 | 16 | 10 | 2 | 15 | 13 | 17 | 13 | 16 | 15 | 1 | 20 | 20 | 10 | |||||||||||||||||||||||||||||||||||||||||||||||||||||||||||||||||||||||||||||||||||||||||||||||
| Contractor Ore Tonnes |
(t) | 436,067 | 10,965 | 10,440 | 7,933 | 9,604 | 10,367 | 9,653 | 9,592 | 9,922 | 9,641 | 10,002 | 9,200 | 9,240 | 9,584 | 8,689 | 9,528 | 9,430 | 9,320 | 8,930 | 9,735 | 9,735 | 9,735 | 9,735 | 9,735 | 9,735 | 9,271 | 9,271 | 9,271 | |||||||||||||||||||||||||||||||||||||||||||||||||||||||||||||||||||||||||||||||||||||||
| Contractor Ore Au |
(g/t) | 13 | 19 | 18 | 14 | 16 | 17 | 18 | 23 | 20 | 21 | 19 | 14 | 17 | 17 | 17 | 17 | 17 | 17 | 17 | 14 | 12 | 11 | 10 | 10 | 10 | 10 | 10 | 10 | |||||||||||||||||||||||||||||||||||||||||||||||||||||||||||||||||||||||||||||||||||||||
| Contractor Oz |
(oz) | 179,206 | 6,539 | 5,944 | 3,688 | 4,973 | 5,740 | 5,494 | 7,022 | 6,504 | 6,589 | 6,112 | 4,055 | 5,197 | 5,205 | 4,719 | 5,175 | 5,122 | 5,062 | 4,850 | 4,448 | 3,828 | 3,349 | 3,091 | 3,023 | 3,023 | 2,879 | 2,879 | 2,879 | |||||||||||||||||||||||||||||||||||||||||||||||||||||||||||||||||||||||||||||||||||||||
| Owner Ore Tonnes |
(t) | 1,024,797 | 12,508 | 12,084 | 11,685 | 11,865 | 13,286 | 13,881 | 12,540 | 13,350 | 13,418 | 14,213 | 12,786 | 12,665 | 12,283 | 12,150 | 12,400 | 11,710 | 12,714 | 12,684 | 11,655 | 11,480 | 11,834 | 12,710 | 12,354 | 11,603 | 13,323 | 12,689 | 13,501 | |||||||||||||||||||||||||||||||||||||||||||||||||||||||||||||||||||||||||||||||||||||||
| Owner Ore Au |
(g/t) | 9 | 9 | 11 | 12 | 11 | 12 | 11 | 11 | 11 | 11 | 10 | 11 | 10 | 10 | 10 | 10 | 10 | 11 | 11 | 13 | 12 | 12 | 12 | 11 | 14 | 14 | 12 | 11 | |||||||||||||||||||||||||||||||||||||||||||||||||||||||||||||||||||||||||||||||||||||||
| Owner Oz |
(oz) | 312,618 | 3,695 | 4,299 | 4,585 | 4,085 | 5,078 | 4,691 | 4,373 | 4,926 | 4,835 | 4,762 | 4,430 | 4,183 | 4,060 | 3,914 | 4,059 | 3,844 | 4,408 | 4,396 | 4,690 | 4,449 | 4,402 | 4,760 | 4,484 | 5,038 | 6,047 | 4,949 | 4,856 | |||||||||||||||||||||||||||||||||||||||||||||||||||||||||||||||||||||||||||||||||||||||
| Owner TPD |
(t) | 403 | 432 | 377 | 396 | 443 | 448 | 405 | 431 | 447 | 458 | 426 | 409 | 396 | 434 | 400 | 390 | 424 | 409 | 376 | 370 | 394 | 410 | 412 | 374 | 430 | 438 | 436 | ||||||||||||||||||||||||||||||||||||||||||||||||||||||||||||||||||||||||||||||||||||||||
| El Silencio |
Units | 4/1/2024 | 5/1/2024 | 6/1/2024 | 7/1/2024 | 8/1/2024 | 9/1/2024 | 10/1/2024 | 11/1/2024 | 12/1/2024 | 1/1/2025 | 2/1/2025 | 3/1/2025 | 4/1/2025 | 5/1/2025 | 6/1/2025 | 7/1/2025 | 8/1/2025 | 9/1/2025 | 10/1/2025 | 11/1/2025 | 12/1/2025 | 1/1/2026 | 2/1/2026 | 3/1/2026 | 4/1/2026 | 5/1/2026 | 6/1/2026 | 7/1/2026 | |||||||||||||||||||||||||||||||||||||||||||||||||||||||||||||||||||||||||||||||||||||||
| Total Ore Tonnes |
(t) | 22,471 | 22,971 | 22,911 | 22,369 | 23,427 | 23,009 | 22,504 | 23,828 | 21,762 | 22,591 | 21,485 | 22,253 | 20,095 | 22,500 | 23,392 | 21,389 | 22,111 | 21,728 | 22,344 | 13,028 | 11,888 | 14,247 | 14,247 | 14,247 | 14,247 | 14,247 | 14,247 | 13,654 | |||||||||||||||||||||||||||||||||||||||||||||||||||||||||||||||||||||||||||||||||||||||
| Grade Au |
(g/t) | 10 | 10 | 11 | 11 | 10 | 10 | 10 | 10 | 10 | 10 | 10 | 10 | 9 | 9 | 10 | 9 | 9 | 9 | 9 | 10 | 10 | 9 | 9 | 9 | 9 | 9 | 9 | 9 | |||||||||||||||||||||||||||||||||||||||||||||||||||||||||||||||||||||||||||||||||||||||
| Total Au Oz Mined |
(oz) | 7,338 | 7,660 | 8,044 | 7,586 | 7,863 | 7,715 | 7,536 | 8,005 | 7,274 | 7,380 | 7,008 | 7,266 | 6,047 | 6,857 | 7,158 | 6,355 | 6,591 | 6,466 | 6,667 | 4,256 | 3,883 | 4,232 | 4,232 | 4,232 | 4,232 | 4,232 | 4,232 | 4,056 | |||||||||||||||||||||||||||||||||||||||||||||||||||||||||||||||||||||||||||||||||||||||
| Total TPD |
(t) | 749 | 766 | 739 | 722 | 756 | 767 | 726 | 794 | 702 | 729 | 767 | 718 | 670 | 750 | 755 | 690 | 713 | 724 | 721 | 434 | 383 | 460 | 509 | 460 | 475 | 475 | 460 | 440 | |||||||||||||||||||||||||||||||||||||||||||||||||||||||||||||||||||||||||||||||||||||||
| Waste Tonnes |
(t) | 2,052 | 1,803 | 1,690 | 1,746 | 1,746 | 1,865 | 2,076 | 2,219 | 2,461 | 2,635 | 2,128 | 1,017 | 595 | 20 | |||||||||||||||||||||||||||||||||||||||||||||||||||||||||||||||||||||||||||||||||||||||||||||||||||||
| Development meters total |
(m) | 118 | 96 | 89 | 92 | 92 | 110 | 132 | 154 | 180 | 201 | 151 | 104 | 59 | 2 | 0 | 0 | 0 | 0 | 0 | 0 | 0 | 0 | 0 | 0 | 0 | 0 | 0 | 0 | |||||||||||||||||||||||||||||||||||||||||||||||||||||||||||||||||||||||||||||||||||||||
| Metros_RP |
(m) | |||||||||||||||||||||||||||||||||||||||||||||||||||||||||||||||||||||||||||||||||||||||||||||||||||||||||||||||||||
| Metros Gl Mec |
(m) | |||||||||||||||||||||||||||||||||||||||||||||||||||||||||||||||||||||||||||||||||||||||||||||||||||||||||||||||||||
| Metros XC 3.5_3.5 |
(m) | |||||||||||||||||||||||||||||||||||||||||||||||||||||||||||||||||||||||||||||||||||||||||||||||||||||||||||||||||||
| Metros XC 2.2_2.3 |
(m) | 59 | 61 | 59 | 61 | 61 | 36 | 31 | 21 | |||||||||||||||||||||||||||||||||||||||||||||||||||||||||||||||||||||||||||||||||||||||||||||||||||||||||||
| Metros AP 2.5x2.5 |
(m) | |||||||||||||||||||||||||||||||||||||||||||||||||||||||||||||||||||||||||||||||||||||||||||||||||||||||||||||||||||
| Metros AP 3.7_3.0 |
(m) | |||||||||||||||||||||||||||||||||||||||||||||||||||||||||||||||||||||||||||||||||||||||||||||||||||||||||||||||||||
| Metros CH 2_2 |
(m) | |||||||||||||||||||||||||||||||||||||||||||||||||||||||||||||||||||||||||||||||||||||||||||||||||||||||||||||||||||
| Metros TB |
(m) | 22 | 41 | 65 | 88 | 110 | 68 | 67 | 30 | 2 | ||||||||||||||||||||||||||||||||||||||||||||||||||||||||||||||||||||||||||||||||||||||||||||||||||||||||||
| Metros CH 3.5_3.5 |
(m) | 30 | 31 | 30 | 31 | 31 | 30 | 31 | 30 | 31 | 31 | 28 | 1 | |||||||||||||||||||||||||||||||||||||||||||||||||||||||||||||||||||||||||||||||||||||||||||||||||||||||
| Metros GL 2.2_2.3 |
(m) | 30 | 5 | 24 | 31 | 38 | 61 | 61 | 55 | 35 | 30 | 0 | ||||||||||||||||||||||||||||||||||||||||||||||||||||||||||||||||||||||||||||||||||||||||||||||||||||||||
| Metros PKT |
(m) | |||||||||||||||||||||||||||||||||||||||||||||||||||||||||||||||||||||||||||||||||||||||||||||||||||||||||||||||||||
| Contractor Ore Tonnes |
(t) | 9,271 | 9,271 | 9,271 | 9,934 | 9,934 | 9,934 | 9,934 | 9,934 | 9,934 | 8,830 | 8,830 | 8,830 | 9,128 | 9,128 | 9,128 | 9,128 | 9,128 | 9,128 | 9,128 | ||||||||||||||||||||||||||||||||||||||||||||||||||||||||||||||||||||||||||||||||||||||||||||||||
| Contractor Ore Au |
(g/t) | 10 | 10 | 10 | 10 | 10 | 10 | 10 | 10 | 10 | 10 | 10 | 10 | 8 | 8 | 8 | 8 | 8 | 8 | 8 | ||||||||||||||||||||||||||||||||||||||||||||||||||||||||||||||||||||||||||||||||||||||||||||||||
| Contractor Oz |
(oz) | 2,879 | 2,879 | 2,879 | 3,084 | 3,084 | 3,084 | 3,084 | 3,084 | 3,084 | 2,742 | 2,742 | 2,742 | 2,350 | 2,350 | 2,350 | 2,350 | 2,350 | 2,350 | 2,350 | 0 | 0 | ||||||||||||||||||||||||||||||||||||||||||||||||||||||||||||||||||||||||||||||||||||||||||||||
| Owner Ore Tonnes |
(t) | 13,200 | 13,700 | 13,640 | 12,436 | 13,493 | 13,075 | 12,570 | 13,895 | 11,828 | 13,761 | 12,655 | 13,423 | 10,967 | 13,372 | 14,264 | 12,261 | 12,983 | 12,600 | 13,216 | 13,028 | 11,888 | 14,247 | 14,247 | 14,247 | 14,247 | 14,247 | 14,247 | 13,654 | |||||||||||||||||||||||||||||||||||||||||||||||||||||||||||||||||||||||||||||||||||||||
| Owner Ore Au |
(g/t) | 11 | 11 | 12 | 11 | 11 | 11 | 11 | 11 | 11 | 10 | 10 | 10 | 10 | 10 | 10 | 10 | 10 | 10 | 10 | 10 | 10 | 9 | 9 | 9 | 9 | 9 | 9 | 9 | |||||||||||||||||||||||||||||||||||||||||||||||||||||||||||||||||||||||||||||||||||||||
| Owner Oz |
(oz) | 4,459 | 4,782 | 5,165 | 4,501 | 4,779 | 4,631 | 4,452 | 4,921 | 4,189 | 4,639 | 4,266 | 4,524 | 3,697 | 4,507 | 4,808 | 4,005 | 4,241 | 4,116 | 4,317 | 4,256 | 3,883 | 4,232 | 4,232 | 4,232 | 4,232 | 4,232 | 4,232 | 4,056 | |||||||||||||||||||||||||||||||||||||||||||||||||||||||||||||||||||||||||||||||||||||||
| Owner TPD |
(t) | 440 | 457 | 440 | 401 | 435 | 436 | 405 | 463 | 382 | 444 | 452 | 433 | 366 | 446 | 460 | 396 | 419 | 420 | 426 | 434 | 383 | 460 | 509 | 460 | 475 | 475 | 460 | 440 | |||||||||||||||||||||||||||||||||||||||||||||||||||||||||||||||||||||||||||||||||||||||
Page 4 of 5
| El Silencio |
Units | 8/1/2026 | 9/1/2026 | 10/1/2026 | 11/1/2026 | 12/1/2026 | 1/1/2027 | 2/1/2027 | 3/1/2027 | 4/1/2027 | 5/1/2027 | 6/1/2027 | 7/1/2027 | 8/1/2027 | 9/1/2027 | 10/1/2027 | 11/1/2027 | 12/1/2027 | 1/1/2028 | 2/1/2028 | 3/1/2028 | 4/1/2028 | 5/1/2028 | 6/1/2028 | 7/1/2028 | 8/1/2028 | 9/1/2028 | |||||||||||||||||||||||||||||||||||||||||||||||||||||||||||||||||||||||||||||||||
| Total Ore Tonnes |
(t) | 13,654 | 13,654 | 13,654 | 13,654 | 13,654 | 13,654 | 13,654 | 13,654 | 13,654 | 13,654 | 13,654 | 10,240 | 10,240 | 10,240 | 10,240 | 10,240 | 10,240 | 11,378 | 11,378 | 11,378 | 11,378 | 11,378 | 11,378 | 11,378 | 11,378 | 11,378 | |||||||||||||||||||||||||||||||||||||||||||||||||||||||||||||||||||||||||||||||||
| Grade Au |
(g/t) | 9 | 9 | 9 | 9 | 9 | 8 | 8 | 8 | 8 | 8 | 6 | 6 | 6 | 6 | 6 | 6 | 6 | 5 | 5 | 5 | 5 | 5 | 5 | 5 | 5 | 5 | |||||||||||||||||||||||||||||||||||||||||||||||||||||||||||||||||||||||||||||||||
| Total Au Oz Mined |
(oz) | 3,956 | 3,956 | 3,956 | 3,956 | 3,956 | 3,543 | 3,543 | 3,543 | 3,543 | 3,543 | 2,664 | 1,998 | 1,998 | 1,998 | 1,998 | 1,998 | 1,998 | 1,732 | 1,732 | 1,732 | 1,732 | 1,732 | 1,732 | 1,732 | 1,732 | 1,732 | |||||||||||||||||||||||||||||||||||||||||||||||||||||||||||||||||||||||||||||||||
| Total TPD |
(t) | 440 | 455 | 440 | 455 | 440 | 440 | 488 | 440 | 455 | 455 | 440 | 330 | 330 | 341 | 330 | 341 | 330 | 367 | 406 | 367 | 379 | 379 | 367 | 367 | 367 | 379 | |||||||||||||||||||||||||||||||||||||||||||||||||||||||||||||||||||||||||||||||||
| Waste Tonnes |
(t) | |||||||||||||||||||||||||||||||||||||||||||||||||||||||||||||||||||||||||||||||||||||||||||||||||||||||||||
| Development meters total |
(m) | 0 | 0 | 0 | 0 | 0 | 0 | 0 | 0 | 0 | 0 | 0 | 0 | 0 | 0 | 0 | 0 | 0 | 0 | 0 | 0 | 0 | 0 | 0 | 0 | 0 | 0 | |||||||||||||||||||||||||||||||||||||||||||||||||||||||||||||||||||||||||||||||||
| Metros_RP |
(m) | |||||||||||||||||||||||||||||||||||||||||||||||||||||||||||||||||||||||||||||||||||||||||||||||||||||||||||
| Metros Gl Mec |
(m) | |||||||||||||||||||||||||||||||||||||||||||||||||||||||||||||||||||||||||||||||||||||||||||||||||||||||||||
| Metros XC 3.5_3.5 |
(m) | |||||||||||||||||||||||||||||||||||||||||||||||||||||||||||||||||||||||||||||||||||||||||||||||||||||||||||
| Metros XC 2.2_2.3 |
(m) | |||||||||||||||||||||||||||||||||||||||||||||||||||||||||||||||||||||||||||||||||||||||||||||||||||||||||||
| Metros AP 2.5x2.5 |
(m) | |||||||||||||||||||||||||||||||||||||||||||||||||||||||||||||||||||||||||||||||||||||||||||||||||||||||||||
| Metros AP 3.7_3.0 |
(m) | |||||||||||||||||||||||||||||||||||||||||||||||||||||||||||||||||||||||||||||||||||||||||||||||||||||||||||
| Metros CH 2_2 |
(m) | |||||||||||||||||||||||||||||||||||||||||||||||||||||||||||||||||||||||||||||||||||||||||||||||||||||||||||
| Metros TB |
(m) | |||||||||||||||||||||||||||||||||||||||||||||||||||||||||||||||||||||||||||||||||||||||||||||||||||||||||||
| Metros CH 3.5_3.5 |
(m) | |||||||||||||||||||||||||||||||||||||||||||||||||||||||||||||||||||||||||||||||||||||||||||||||||||||||||||
| Metros GL 2.2_2.3 |
(m) | |||||||||||||||||||||||||||||||||||||||||||||||||||||||||||||||||||||||||||||||||||||||||||||||||||||||||||
| Metros PKT |
(m) | |||||||||||||||||||||||||||||||||||||||||||||||||||||||||||||||||||||||||||||||||||||||||||||||||||||||||||
| Contractor Ore Tonnes |
(t) | |||||||||||||||||||||||||||||||||||||||||||||||||||||||||||||||||||||||||||||||||||||||||||||||||||||||||||
| Contractor Ore Au | (g/t) | |||||||||||||||||||||||||||||||||||||||||||||||||||||||||||||||||||||||||||||||||||||||||||||||||||||||||||
| Contractor Oz | (oz) | |||||||||||||||||||||||||||||||||||||||||||||||||||||||||||||||||||||||||||||||||||||||||||||||||||||||||||
| Owner Ore Tonnes |
(t) | 13,654 | 13,654 | 13,654 | 13,654 | 13,654 | 13,654 | 13,654 | 13,654 | 13,654 | 13,654 | 13,654 | 10,240 | 10,240 | 10,240 | 10,240 | 10,240 | 10,240 | 11,378 | 11,378 | 11,378 | 11,378 | 11,378 | 11,378 | 11,378 | 11,378 | 11,378 | |||||||||||||||||||||||||||||||||||||||||||||||||||||||||||||||||||||||||||||||||
| Owner Ore Au |
(g/t) | 9 | 9 | 9 | 9 | 9 | 8 | 8 | 8 | 8 | 8 | 6 | 6 | 6 | 6 | 6 | 6 | 6 | 5 | 5 | 5 | 5 | 5 | 5 | 5 | 5 | 5 | |||||||||||||||||||||||||||||||||||||||||||||||||||||||||||||||||||||||||||||||||
| Owner Oz |
(oz) | 3,956 | 3,956 | 3,956 | 3,956 | 3,956 | 3,543 | 3,543 | 3,543 | 3,543 | 3,543 | 2,664 | 1,998 | 1,998 | 1,998 | 1,998 | 1,998 | 1,998 | 1,732 | 1,732 | 1,732 | 1,732 | 1,732 | 1,732 | 1,732 | 1,732 | 1,732 | |||||||||||||||||||||||||||||||||||||||||||||||||||||||||||||||||||||||||||||||||
| Owner TPD |
(t) | 440 | 455 | 440 | 455 | 440 | 440 | 488 | 440 | 455 | 455 | 440 | 330 | 330 | 341 | 330 | 341 | 330 | 367 | 406 | 367 | 379 | 379 | 367 | 367 | 367 | 379 | |||||||||||||||||||||||||||||||||||||||||||||||||||||||||||||||||||||||||||||||||
Page 5 of 5
| SRK Consulting (U.S.), Inc. NI 43-101 Technical Report – Segovia 2021 PFS Update |
Appendices |
Appendix C: Annual TEM Detail
|
BP/KD |
May 2022 |
| BUSINESS UNIT | Segovia Gold |
|||||||||||||||||||||||||||||||||||||||||||||||||||||||||||
| OPERATION | Q1 2022 Costs & Prices |
|||||||||||||||||||||||||||||||||||||||||||||||||||||||||||
| Period |
units / | Total | 2022 | 2023 | 2024 | 2025 | 2026 | 2027 | 2028 | 2029 | 2030 | 2031 | 2032 | |||||||||||||||||||||||||||||||||||||||||||||||
| Project Timeline |
sensit. | or Avg. | 1 | 2 | 3 | 4 | 5 | 6 | 7 | 8 | 9 | 10 | 11 | |||||||||||||||||||||||||||||||||||||||||||||||
| Discount Factors |
EOP @ 5 | % | (Start January, 2022) | 1.0000 | 0.9524 | 0.9070 | 0.8638 | 0.8227 | 0.7835 | 0.7462 | 0.7107 | 0.6768 | 0.6446 | 0.6139 | ||||||||||||||||||||||||||||||||||||||||||||||
| Market Prices |
||||||||||||||||||||||||||||||||||||||||||||||||||||||||||||
| Gold (US$/oz) |
1.00 | $/oz | $1,650 | $1,650 | $1,650 | $1,650 | $1,650 | $1,650 | $1,650 | $1,650 | $1,650 | $1,650 | $1,650 | $1,650 | ||||||||||||||||||||||||||||||||||||||||||||||
| Silver (US$/oz) |
1.00 | $/oz | $20.00 | $20.00 | $20.00 | $20.00 | $20.00 | $20.00 | $20.00 | $20.00 | $20.00 | $20.00 | $20.00 | $20.00 | ||||||||||||||||||||||||||||||||||||||||||||||
| Physicals Summary |
||||||||||||||||||||||||||||||||||||||||||||||||||||||||||||
| Total Ore Mined |
kt | 2,290 | 570 | 543 | 469 | 289 | 174 | 143 | 102 | - | - | - | - | |||||||||||||||||||||||||||||||||||||||||||||||
| Total Waste Mined |
kt | 458 | 210 | 156 | 88 | 5 | - | - | - | - | - | - | - | |||||||||||||||||||||||||||||||||||||||||||||||
| Total Material Mined |
kt | 2,749 | 779 | 699 | 557 | 293 | 174 | 143 | 102 | - | - | - | - | |||||||||||||||||||||||||||||||||||||||||||||||
| Total Ore Tons Processed |
kt | 2,290 | 570 | 543 | 469 | 289 | 174 | 143 | 102 | - | - | - | - | |||||||||||||||||||||||||||||||||||||||||||||||
| Processed Ore Gold Grade |
g/t | 10.11 | 12.21 | 11.29 | 9.09 | 9.53 | 8.97 | 7.02 | 4.74 | - | - | - | - | |||||||||||||||||||||||||||||||||||||||||||||||
| Processed Ore Silver Grade |
g/t | - | - | - | - | - | - | - | - | - | - | - | - | |||||||||||||||||||||||||||||||||||||||||||||||
| Contained Gold, Processed |
koz | 745 | 224 | 197 | 137 | 89 | 50 | 32 | 16 | - | - | - | - | |||||||||||||||||||||||||||||||||||||||||||||||
| Contained Silver, Processed |
koz | - | - | - | - | - | - | - | - | - | - | - | - | |||||||||||||||||||||||||||||||||||||||||||||||
| Average Gold Recovery, Doré |
|
% recovery |
|
90.5 | % | 90.5 | % | 90.5 | % | 90.5 | % | 90.5 | % | 90.5 | % | 90.5 | % | 90.5 | % | - | - | - | - | |||||||||||||||||||||||||||||||||||||
| Average Silver Recovery, Doré |
|
% recovery |
|
- | - | - | - | - | - | - | - | - | - | - | - | |||||||||||||||||||||||||||||||||||||||||||||
| Recovered Gold, Doré |
koz | 674 | 202 | 179 | 124 | 80 | 45 | 29 | 14 | - | - | - | - | |||||||||||||||||||||||||||||||||||||||||||||||
| Recovered Silver, Doré |
koz | - | - | - | - | - | - | - | - | - | - | - | - | |||||||||||||||||||||||||||||||||||||||||||||||
| Doré |
koz | 674 | 202 | 179 | 124 | 80 | 45 | 29 | 14 | - | - | - | - | |||||||||||||||||||||||||||||||||||||||||||||||
| Cash Flow |
||||||||||||||||||||||||||||||||||||||||||||||||||||||||||||
| Gold Revenue |
100 | % | $000s | 1,111,966 | 333,977 | 294,586 | 204,553 | 132,222 | 75,018 | 48,330 | 23,281 | - | - | - | - | |||||||||||||||||||||||||||||||||||||||||||||
| Silver Revenue |
0 | % | $000s | - | - | - | - | - | - | - | - | - | - | - | - | |||||||||||||||||||||||||||||||||||||||||||||
| Gross Revenue |
$000s | 1,111,966 | 333,977 | 294,586 | 204,553 | 132,222 | 75,018 | 48,330 | 23,281 | - | - | - | - | |||||||||||||||||||||||||||||||||||||||||||||||
| Gold Revenue |
$000s | 1,111,966 | 333,977 | 294,586 | 204,553 | 132,222 | 75,018 | 48,330 | 23,281 | - | - | - | - | |||||||||||||||||||||||||||||||||||||||||||||||
| Gross Revenue After By-Product Credits |
$000s | 1,111,966 | 333,977 | 294,586 | 204,553 | 132,222 | 75,018 | 48,330 | 23,281 | - | - | - | - | |||||||||||||||||||||||||||||||||||||||||||||||
| Mining Cost |
$000s | (365,010 | ) | (105,073 | ) | (87,083 | ) | (67,762 | ) | (43,614 | ) | (25,621 | ) | (21,472 | ) | (14,384 | ) | - | - | - | - | |||||||||||||||||||||||||||||||||||||||
| Process Cost |
$000s | (76,489 | ) | (18,236 | ) | (17,660 | ) | (16,137 | ) | (9,779 | ) | (6,176 | ) | (5,007 | ) | (3,493 | ) | - | - | - | - | |||||||||||||||||||||||||||||||||||||||
| Site G&A Cost |
$000s | (57,917 | ) | (13,591 | ) | (12,185 | ) | (12,185 | ) | (8,394 | ) | (5,761 | ) | (3,689 | ) | (2,112 | ) | - | - | - | - | |||||||||||||||||||||||||||||||||||||||
| Smelting & Refining Charges |
$000s | (5,560 | ) | (1,670 | ) | (1,473 | ) | (1,023 | ) | (661 | ) | (375 | ) | (242 | ) | (116 | ) | - | - | - | - | |||||||||||||||||||||||||||||||||||||||
| Impurities Penalties |
$000s | - | - | - | - | - | - | - | - | - | - | - | - | |||||||||||||||||||||||||||||||||||||||||||||||
| Freight |
$000s | - | - | - | - | - | - | - | - | - | - | - | - | |||||||||||||||||||||||||||||||||||||||||||||||
| By-Product Credits |
$000s | - | - | - | - | - | - | - | - | - | - | - | - | |||||||||||||||||||||||||||||||||||||||||||||||
| Direct Cash Costs |
$000s | (504,975 | ) | (138,571 | ) | (118,401 | ) | (97,107 | ) | (62,448 | ) | (37,933 | ) | (30,410 | ) | (20,105 | ) | - | - | - | - | |||||||||||||||||||||||||||||||||||||||
| Royalties |
$000s | (39,141 | ) | (11,756 | ) | (10,369 | ) | (7,200 | ) | (4,654 | ) | (2,641 | ) | (1,701 | ) | (819 | ) | - | - | - | - | |||||||||||||||||||||||||||||||||||||||
| Total Operating Expense |
$000s | (544,117 | ) | (150,327 | ) | (128,771 | ) | (104,307 | ) | (67,102 | ) | (40,574 | ) | (32,111 | ) | (20,925 | ) | - | - | - | - | |||||||||||||||||||||||||||||||||||||||
| Operating Margin |
$000s | 567,850 | 183,650 | 165,816 | 100,246 | 65,119 | 34,444 | 16,219 | 2,356 | - | - | - | - | |||||||||||||||||||||||||||||||||||||||||||||||
| Earnings & Cash Flow |
||||||||||||||||||||||||||||||||||||||||||||||||||||||||||||
| Earnings Before Taxes & Depreciation |
$000s | 567,850 | 183,650 | 165,816 | 100,246 | 65,119 | 34,444 | 16,219 | 2,356 | - | - | - | - | |||||||||||||||||||||||||||||||||||||||||||||||
| Depreciation Allowance |
$000s | (122,805 | ) | (34,510 | ) | (25,157 | ) | (19,193 | ) | (10,754 | ) | (11,632 | ) | (12,192 | ) | (9,366 | ) | - | - | - | - | |||||||||||||||||||||||||||||||||||||||
| Other Non-Cash Tax Adjustments |
$000s | - | - | - | - | - | - | - | - | - | - | - | - | |||||||||||||||||||||||||||||||||||||||||||||||
| Earnings Before Taxes |
$000s | 445,045 | 149,140 | 140,659 | 81,053 | 54,365 | 22,812 | 4,027 | (7,011 | ) | - | - | - | - | ||||||||||||||||||||||||||||||||||||||||||||||
| Income Tax |
$000s | (156,149 | ) | (51,245 | ) | (48,331 | ) | (27,611 | ) | (18,820 | ) | (7,902 | ) | (2,240 | ) | - | - | - | - | - | ||||||||||||||||||||||||||||||||||||||||
| Net Income |
$000s | 288,896 | 97,895 | 92,328 | 53,441 | 35,545 | 14,909 | 1,787 | (7,011 | ) | - | - | - | - | ||||||||||||||||||||||||||||||||||||||||||||||
| Non-Cash Add Back—Depreciation |
$000s | 122,805 | 34,510 | 25,157 | 19,193 | 10,754 | 11,632 | 12,192 | 9,366 | - | - | - | - | |||||||||||||||||||||||||||||||||||||||||||||||
| Working Capital |
$000s | 3,770 | - | 456 | 1,227 | 768 | 628 | 245 | 251 | 196 | - | - | - | |||||||||||||||||||||||||||||||||||||||||||||||
| Operating Cash Flow |
$000s | 415,471 | 132,405 | 117,941 | 73,862 | 47,067 | 27,170 | 14,224 | 2,606 | 196 | - | - | - | |||||||||||||||||||||||||||||||||||||||||||||||
| Capital |
||||||||||||||||||||||||||||||||||||||||||||||||||||||||||||
| Initial Capital |
$000s | - | - | - | - | - | - | - | - | - | - | - | - | |||||||||||||||||||||||||||||||||||||||||||||||
| CAPEX |
$000s | (151,453 | ) | (51,278 | ) | (44,078 | ) | (23,968 | ) | (15,342 | ) | (5,675 | ) | (3,885 | ) | (2,165 | ) | (4,827 | ) | (235 | ) | - | - | |||||||||||||||||||||||||||||||||||||
| Other Capital |
$000s | - | - | - | - | - | - | - | - | - | - | - | - | |||||||||||||||||||||||||||||||||||||||||||||||
| Total Capital |
$000s | (151,453 | ) | (51,278 | ) | (44,078 | ) | (23,968 | ) | (15,342 | ) | (5,675 | ) | (3,885 | ) | (2,165 | ) | (4,827 | ) | (235 | ) | - | - | |||||||||||||||||||||||||||||||||||||
| Acquisition Cost |
$000s | - | - | - | - | - | - | - | - | - | - | - | - | |||||||||||||||||||||||||||||||||||||||||||||||
| Other Cash Flow Adjustments |
$000s | - | - | - | - | - | - | - | - | - | - | - | - | |||||||||||||||||||||||||||||||||||||||||||||||
| Summary Metrics |
||||||||||||||||||||||||||||||||||||||||||||||||||||||||||||
| Before-Tax Metrics |
||||||||||||||||||||||||||||||||||||||||||||||||||||||||||||
| O Free Cash flow |
$000s | 420,166 | 132,372 | 122,194 | 77,505 | 50,545 | 29,397 | 12,579 | 441 | (4,631 | ) | (235 | ) | - | - | |||||||||||||||||||||||||||||||||||||||||||||
| Cumulative Cash Flow |
$000s | 132,372 | 254,566 | 332,071 | 382,616 | 412,013 | 424,591 | 425,033 | 420,401 | 420,166 | 420,166 | 420,166 | ||||||||||||||||||||||||||||||||||||||||||||||||
| NPV @ |
5.00 | % | $000s | 385,446 | 129,301 | 114,457 | 69,182 | 42,829 | 23,051 | 9,805 | 331 | (3,355 | ) | (156 | ) | - | - | |||||||||||||||||||||||||||||||||||||||||||
| Cumulative NPV |
$000s | 129,301 | 243,758 | 312,940 | 355,768 | 378,820 | 388,625 | 388,956 | 385,601 | 385,446 | 385,446 | 385,446 | ||||||||||||||||||||||||||||||||||||||||||||||||
| After-Tax Metrics |
||||||||||||||||||||||||||||||||||||||||||||||||||||||||||||
| O Free Cash flow |
$000s | 264,017 | 81,127 | 73,863 | 49,894 | 31,725 | 21,494 | 10,339 | 441 | (4,631 | ) | (235 | ) | - | - | |||||||||||||||||||||||||||||||||||||||||||||
| Cumulative Cash Flow |
$000s | 81,127 | 154,990 | 204,883 | 236,609 | 258,103 | 268,442 | 268,884 | 264,252 | 264,017 | 264,017 | 264,017 | ||||||||||||||||||||||||||||||||||||||||||||||||
| NPV @ |
5.00 | % | $000s | 241,584 | 79,193 | 69,351 | 44,581 | 26,894 | 16,680 | 8,064 | 331 | (3,355 | ) | (156 | ) | - | - | |||||||||||||||||||||||||||||||||||||||||||
| Cumulative NPV |
$000s | 79,193 | 148,544 | 193,125 | 220,019 | 236,699 | 244,763 | 245,095 | 241,740 | 241,584 | 241,584 | 241,584 | ||||||||||||||||||||||||||||||||||||||||||||||||
| Operating Metrics |
||||||||||||||||||||||||||||||||||||||||||||||||||||||||||||
| Mine Life |
Years | 7 | ||||||||||||||||||||||||||||||||||||||||||||||||||||||||||
| Average Mining Rate (Ore + Waste) |
MTPA | 779 | ||||||||||||||||||||||||||||||||||||||||||||||||||||||||||
| Average Processing Rate |
MTPA | 570 | ||||||||||||||||||||||||||||||||||||||||||||||||||||||||||
| Mining Cost |
$ / t ore | $ 159.36 | $184.45 | $160.27 | $144.61 | $150.92 | $147.14 | $149.77 | $140.47 | $- | $- | $- | $- | |||||||||||||||||||||||||||||||||||||||||||||||
|
SRK Consulting CONFIDENTIAL |
1 of 6 |
| Processing Cost |
$ | / t ore | $ | 33.39 | $ | 32.01 | $ | 32.50 | $ | 34.44 | $ | 33.84 | $ | 35.47 | $ | 34.93 | $ | 34.11 | $ | - | $ | - | $ | - | $ | - | ||||||||||||||||||||||||||||||||||
| G&A Cost |
$ | /t ore | $ | 25.29 | $ | 17.44 | $ | 17.42 | $ | 21.89 | $ | 28.60 | $ | 33.08 | $ | 25.73 | $ | 20.62 | $ | - | $ | - | $ | - | $ | - | ||||||||||||||||||||||||||||||||||
| Metal Sales (Payable Metal) |
||||||||||||||||||||||||||||||||||||||||||||||||||||||||||||
| LOM Gold Sales |
koz | 673.9 | 202.4 | 178.5 | 124.0 | 80.1 | 45.5 | 29.3 | 14.1 | - | - | - | - | |||||||||||||||||||||||||||||||||||||||||||||||
| 1st 5 Years Avg. Gold Sales |
koz / yr | 126.1 | ||||||||||||||||||||||||||||||||||||||||||||||||||||||||||
| Direct+Indirect Cash Costs (incl. By-Product Credits) |
||||||||||||||||||||||||||||||||||||||||||||||||||||||||||||
| LOM Cash Costs / tAu-oz |
$ | / Au-oz | $ | 807.39 | 742.68 | 721.25 | 841.38 | 837.37 | 892.42 | 1,096.28 | 1,483.04 | - | - | - | - |
|
SRK Consulting CONFIDENTIAL |
2 of 6 |
| PRODUCTION SUMMARY |
|
|||||||||||||||||||||||||||||||||||||||||||||||||||||||||||
| Mining Summary | ||||||||||||||||||||||||||||||||||||||||||||||||||||||||||||
| Open Pit |
||||||||||||||||||||||||||||||||||||||||||||||||||||||||||||
| Mined Ore | kt | 0 | - | - | - | - | - | - | - | - | - | - | - | |||||||||||||||||||||||||||||||||||||||||||||||
| Mined Waste | kt | 0 | - | - | - | - | - | - | - | - | - | - | - | |||||||||||||||||||||||||||||||||||||||||||||||
| Total Material Mined | kt | 0 | - | - | - | - | - | - | - | - | - | - | - | |||||||||||||||||||||||||||||||||||||||||||||||
| Strip Ratio | W/O | N/A | - | |||||||||||||||||||||||||||||||||||||||||||||||||||||||||
| Daily Mining Rate | 329 | tpd | 0 | - | - | - | - | - | - | - | - | - | - | - | ||||||||||||||||||||||||||||||||||||||||||||||
| Gold Grade, Mined | g/t | - | - | - | - | - | - | - | - | - | - | - | - | |||||||||||||||||||||||||||||||||||||||||||||||
| Silver Grade, Mined | g/t | - | - | - | - | - | - | - | - | - | - | - | - | |||||||||||||||||||||||||||||||||||||||||||||||
| Contained Gold, Mined | koz | 0 | - | - | - | - | - | - | - | - | - | - | - | |||||||||||||||||||||||||||||||||||||||||||||||
| Contained Silver, Mined | koz | 0 | - | - | - | - | - | - | - | - | - | - | - | |||||||||||||||||||||||||||||||||||||||||||||||
| Underground |
- | |||||||||||||||||||||||||||||||||||||||||||||||||||||||||||
| Mined Ore | kt | 2,290 | 570 | 543 | 469 | 289 | 174 | 143 | 102 | - | - | - | - | |||||||||||||||||||||||||||||||||||||||||||||||
| Mined Waste | kt | 458 | 210 | 156 | 88 | 5 | - | - | - | - | - | - | - | |||||||||||||||||||||||||||||||||||||||||||||||
| Total Material Mined | kt | 2,749 | 779 | 699 | 557 | 293 | 174 | 143 | 102 | - | - | - | - | |||||||||||||||||||||||||||||||||||||||||||||||
| Strip Ratio | W/O | 0.20 | 0.4 | 0.3 | 0.2 | 0.0 | 0.0 | 0.0 | 0.0 | - | ||||||||||||||||||||||||||||||||||||||||||||||||||
| Daily Mining Rate | 329 | tpd | 1,534 | 4,744 | 2,129 | 1,694 | 893 | 530 | 436 | 312 | - | - | - | - | ||||||||||||||||||||||||||||||||||||||||||||||
| Gold Grade, Mined | g/t | 10.11 | 12.21 | 11.29 | 9.09 | 9.53 | 8.97 | 7.02 | 4.74 | - | - | - | - | |||||||||||||||||||||||||||||||||||||||||||||||
| Silver Grade, Mined | g/t | - | - | - | - | - | - | - | - | - | - | - | - | |||||||||||||||||||||||||||||||||||||||||||||||
| Contained Gold, Mined | koz | 745 | 224 | 197 | 137 | 89 | 50 | 32 | 16 | - | - | - | - | |||||||||||||||||||||||||||||||||||||||||||||||
| Contained Silver, Mined | koz | 0 | - | - | - | - | - | - | - | - | - | - | - | |||||||||||||||||||||||||||||||||||||||||||||||
| Total Mined |
- | |||||||||||||||||||||||||||||||||||||||||||||||||||||||||||
| Mined Ore | kt | 2,290 | 570 | 543 | 469 | 289 | 174 | 143 | 102 | - | - | - | - | |||||||||||||||||||||||||||||||||||||||||||||||
| Mined Waste | kt | 458 | 210 | 156 | 88 | 5 | - | - | - | - | - | - | - | |||||||||||||||||||||||||||||||||||||||||||||||
| Total Material Mined | kt | 2,749 | 779 | 699 | 557 | 293 | 174 | 143 | 102 | - | - | - | - | |||||||||||||||||||||||||||||||||||||||||||||||
| Daily Mining Rate | 329 | tpd | 1,534 | 4,744 | 2,129 | 1,694 | 893 | 530 | 436 | 312 | - | - | - | - | ||||||||||||||||||||||||||||||||||||||||||||||
| Gold Grade, Mined | g/t | 10.11 | 12.21 | 11.29 | 9.09 | 9.53 | 8.97 | 7.02 | 4.74 | - | - | - | - | |||||||||||||||||||||||||||||||||||||||||||||||
| Silver Grade, Mined | g/t | - | - | - | - | |||||||||||||||||||||||||||||||||||||||||||||||||||||||
| Contained Gold, Mined | koz | 745 | 224 | 197 | 137 | 89 | 50 | 32 | 16 | - | - | - | - | |||||||||||||||||||||||||||||||||||||||||||||||
| Contained Silver, Mined | koz | 0 | - | - | - | - | - | - | - | - | - | - | - | |||||||||||||||||||||||||||||||||||||||||||||||
| Stockpile |
- | - | - | - | - | - | - | - | - | - | ||||||||||||||||||||||||||||||||||||||||||||||||||
| Begin Ore | kt | - | - | - | - | - | - | - | - | - | - | - | ||||||||||||||||||||||||||||||||||||||||||||||||
| Ore Mined | kt | 2,290 | 570 | 543 | 469 | 289 | 174 | 143 | 102 | - | - | - | - | |||||||||||||||||||||||||||||||||||||||||||||||
| RoM to Plant | kt | 2,290 | 570 | 543 | 469 | 289 | 174 | 143 | 102 | - | - | - | - | |||||||||||||||||||||||||||||||||||||||||||||||
| End Ore | kt | - | - | - | - | - | - | - | - | - | - | - | ||||||||||||||||||||||||||||||||||||||||||||||||
| Begin Gold | g/t | - | - | - | - | - | - | - | - | - | - | - | ||||||||||||||||||||||||||||||||||||||||||||||||
| Gold Mined | g/t | 12.21 | 11.29 | 9.09 | 9.53 | 8.97 | 7.02 | 4.74 | - | - | - | - | ||||||||||||||||||||||||||||||||||||||||||||||||
| Gold to Plant | g/t | 12.21 | 11.29 | 9.09 | 9.53 | 8.97 | 7.02 | 4.74 | - | - | - | - | ||||||||||||||||||||||||||||||||||||||||||||||||
| End Gold | g/t | - | - | - | - | - | - | - | - | - | - | - | ||||||||||||||||||||||||||||||||||||||||||||||||
| Begin Gold | koz | - | - | - | - | - | - | - | - | - | - | - | ||||||||||||||||||||||||||||||||||||||||||||||||
| Gold Mined | koz | 745 | 224 | 197 | 137 | 89 | 50 | 32 | 16 | - | - | - | - | |||||||||||||||||||||||||||||||||||||||||||||||
| Gold to Plant | koz | 745 | 224 | 197 | 137 | 89 | 50 | 32 | 16 | - | - | - | - | |||||||||||||||||||||||||||||||||||||||||||||||
| End Gold | koz | - | - | - | - | - | - | - | - | - | - | - | ||||||||||||||||||||||||||||||||||||||||||||||||
| Begin Silver | g/t | - | - | - | - | - | - | - | - | - | - | - | ||||||||||||||||||||||||||||||||||||||||||||||||
| Silver Mined | g/t | - | - | - | - | - | - | - | - | - | - | - | ||||||||||||||||||||||||||||||||||||||||||||||||
| Silver to Plant | g/t | - | - | - | - | - | - | - | - | - | - | - | ||||||||||||||||||||||||||||||||||||||||||||||||
| End Silver | g/t | - | - | - | - | - | - | - | - | - | - | - | ||||||||||||||||||||||||||||||||||||||||||||||||
| Begin Silver | koz | - | - | - | - | - | - | - | - | - | - | - | ||||||||||||||||||||||||||||||||||||||||||||||||
| Silver Mined | koz | 0 | - | - | - | - | - | - | - | - | - | - | - | |||||||||||||||||||||||||||||||||||||||||||||||
| Silver to Plant | koz | 0 | - | - | - | - | - | - | - | - | - | - | - | |||||||||||||||||||||||||||||||||||||||||||||||
| End Silver | koz | - | - | - | - | - | - | - | - | - | - | - | ||||||||||||||||||||||||||||||||||||||||||||||||
| Process Summary |
660 | - | ||||||||||||||||||||||||||||||||||||||||||||||||||||||||||
| Milled Ore | kt | 2,290 | 570 | 543 | 469 | 289 | 174 | 143 | 102 | - | - | - | - | |||||||||||||||||||||||||||||||||||||||||||||||
| Daily Ore Process Rate | 329 | tpd | 996 | 1,734 | 1,654 | 1,426 | 880 | 530 | 436 | 312 | - | - | - | - | ||||||||||||||||||||||||||||||||||||||||||||||
| Ore Gold Grade, Processed | g/t | 10.11 | 12.21 | 11.29 | 9.09 | 9.53 | 8.97 | 7.02 | 4.74 | - | - | - | - | |||||||||||||||||||||||||||||||||||||||||||||||
| Ore Silver Grade, Processed | g/t | - | - | - | - | - | - | - | - | - | - | - | - | |||||||||||||||||||||||||||||||||||||||||||||||
| Ore Gold Content, Processed | koz | 745 | 224 | 197 | 137 | 89 | 50 | 32 | 16 | - | - | - | - | |||||||||||||||||||||||||||||||||||||||||||||||
| Ore Silver Content, Processed | koz | 0 | - | - | - | - | - | - | - | - | - | - | - | |||||||||||||||||||||||||||||||||||||||||||||||
|
SRK Consulting CONFIDENTIAL |
3 of 6 |
|
DORÉ NET SMELTER RETURN |
| |||||||||||||||||||||||||||||||||||||||||||||||||||||||||||||
| Doré |
||||||||||||||||||||||||||||||||||||||||||||||||||||||||||||||
|
|
Gold Met. Recovery | % | 90.5% | 90.5 | % | 90.5 | % | 90.5 | % | 90.5 | % | 90.5 | % | 90.5 | % | 90.5 | % | - | - | - | - | |||||||||||||||||||||||||||||||||||||||||
| Silver Met. Recovery | % | 0.0% | - | - | - | - | -- | - | - | - | - | - | - | |||||||||||||||||||||||||||||||||||||||||||||||||
| Doré Produced | - | koz | 674 | 202 | 179 | 123.97 | 80 | 45 | 29 | 14 | - | - | - | - | ||||||||||||||||||||||||||||||||||||||||||||||||
| Gold Recovered | koz | 674 | 202 | 179 | 124 | 80 | 45 | 29 | 14 | - | - | - | ||||||||||||||||||||||||||||||||||||||||||||||||||
| Silver Recovered | koz | 0 | - | - | - | - | - | - | - | - | - | - | - | |||||||||||||||||||||||||||||||||||||||||||||||||
| Payable Gold |
- | - | - | - | ||||||||||||||||||||||||||||||||||||||||||||||||||||||||||
| Au in Doré |
koz | 674 | 202 | 179 | 124 | 80 | 45 | 29 | 14 | - | - | - | - | |||||||||||||||||||||||||||||||||||||||||||||||||
| Au Payfor |
100 | % | koz | 0 | - | - | - | - | - | - | - | - | - | - | - | |||||||||||||||||||||||||||||||||||||||||||||||
| Payable Gold |
674 | 202 | 179 | 124 | 80 | 45 | 29 | 14 | - | - | - | - | ||||||||||||||||||||||||||||||||||||||||||||||||||
| Gold Gross revenue |
$ | 000s | 1,111,966 | 333,977 | 294,586 | 204,553 | 132,222 | 75,018 | 48,330 | 23,281 | - | - | - | - | ||||||||||||||||||||||||||||||||||||||||||||||||
| Gold Deductions |
- | |||||||||||||||||||||||||||||||||||||||||||||||||||||||||||||
| S&R Charge |
$ | 8.25 | $ | 000s | (5,560 | ) | (1670 | ) | (1473 | ) | (1023 | ) | (661 | ) | (375 | ) | (242 | ) | (116 | ) | - | - | - | - | ||||||||||||||||||||||||||||||||||||||
| Gold Revenue |
$ | 000s | 1,106,406 | 332,307 | 293,113 | 203,530 | 131,560 | 74,643 | 48,089 | 23,164 | - | - | - | - | ||||||||||||||||||||||||||||||||||||||||||||||||
|
SRK Consulting CONFIDENTIAL |
4 of 6 |
| Payable Silver |
||||||||||||||||||||||||||||||||||||||||||||||||||||||||||||||
| Ag in Doré |
koz | 0 | - | - | - | - | - | - | - | - | - | - | - | |||||||||||||||||||||||||||||||||||||||||||||||||
| Ag Payfor |
85 | % | koz | 0 | - | - | - | - | - | - | - | - | - | - | - | |||||||||||||||||||||||||||||||||||||||||||||||
| Payable Silver |
0 | - | - | - | - | - | - | - | - | - | - | - | ||||||||||||||||||||||||||||||||||||||||||||||||||
| Silver Gross revenue |
$000s | 0 | - | - | - | - | - | - | - | - | - | - | - | |||||||||||||||||||||||||||||||||||||||||||||||||
| Silver Deductions |
||||||||||||||||||||||||||||||||||||||||||||||||||||||||||||||
| S&R Charge |
$0.00 | $000s | 0 | - | - | - | - | - | - | - | - | - | - | - | ||||||||||||||||||||||||||||||||||||||||||||||||
|
Silver Revenue |
$000s | 0 | - | - | - | - | - | - | - | - | - | - | - | |||||||||||||||||||||||||||||||||||||||||||||||||
| Doré Freight & Impurities |
||||||||||||||||||||||||||||||||||||||||||||||||||||||||||||||
| Doré Transported |
0.00 | % | koz | 674 | 202 | 179 | 124 | 80 | 45 | 29 | 14 | - | - | - | - | |||||||||||||||||||||||||||||||||||||||||||||||
| Freight |
$0 | $000s | 0 | - | ||||||||||||||||||||||||||||||||||||||||||||||||||||||||||
| Impurities |
$0.00 | $000s | 0 | - | ||||||||||||||||||||||||||||||||||||||||||||||||||||||||||
| Freight & Third Parties |
$0.00 | $000s | 0 | - | - | - | - | - | - | - | - | - | - | - | ||||||||||||||||||||||||||||||||||||||||||||||||
| (741.06 | ) | |||||||||||||||||||||||||||||||||||||||||||||||||||||||||||||
| Doré Net Smelter Revenue |
- | $000s | 1,106,406 | 332,307 | 293,113 | 203,530 | 131,560 | 74,643 | 48,089 | 23,164 | - | - | - | - | ||||||||||||||||||||||||||||||||||||||||||||||||
| ROYALTY (Extraordinary Mining Right) |
| |||||||||||||||||||||||||||||||||||||||||||||||||||||||||||||
| 4.4% Over Gold and Silver |
|
|||||||||||||||||||||||||||||||||||||||||||||||||||||||||||||
|
|
Gold Sales |
- | $000s | 1,111,966 | 333,977 | 294,586 | 204,553 | 132,222 | 75,018 | 48,330 | 23,281 | - | - | - | - | |||||||||||||||||||||||||||||||||||||||||||||||
| Silver Sales |
- | $000s | 0 | - | - | - | - | - | - | - | - | - | - | - | ||||||||||||||||||||||||||||||||||||||||||||||||
| Total |
- | $000s | 1,111,966 | 333,977 | 294,586 | 204,553 | 132,222 | 75,018 | 48,330 | 23,281 | - | - | - | - | ||||||||||||||||||||||||||||||||||||||||||||||||
| Total Extraordinary Right |
4.4 | % | $000s | (39,141 | ) | (11,756 | ) | (10,369 | ) | (7,200 | ) | (4,654 | ) | (2,641 | ) | (1,701 | ) | (819 | ) | - | - | - | - | |||||||||||||||||||||||||||||||||||||||
| Royalty Factor |
80 | % | ||||||||||||||||||||||||||||||||||||||||||||||||||||||||||||
| 3.52% | ||||||||||||||||||||||||||||||||||||||||||||||||||||||||||||||
| ECONOMIC VALUE (FREE CASH FLOW CHECK) |
| |||||||||||||||||||||||||||||||||||||||||||||||||||||||||||||
| NSR |
||||||||||||||||||||||||||||||||||||||||||||||||||||||||||||||
| Doré NSR |
$000s | 1,106,406 | 332,307 | 293,113 | 203,530 | 131,560 | 74,643 | 48,089 | 23,164 | - | - | - | - | |||||||||||||||||||||||||||||||||||||||||||||||||
| Total NSR |
$000s | 1,106,406 | 332,307 | 293,113 | 203,530 | 131,560 | 74,643 | 48,089 | 23,164 | - | - | - | - | |||||||||||||||||||||||||||||||||||||||||||||||||
| Royalties |
$000s | (39,141 | ) | (11,756 | ) | (10,369 | ) | (7,200 | ) | (4,654 | ) | (2,641 | ) | (1,701 | ) | (819 | ) | - | - | - | - | |||||||||||||||||||||||||||||||||||||||||
| - |
||||||||||||||||||||||||||||||||||||||||||||||||||||||||||||||
|
Total NSR After Royalties |
$000s | 1,067,265 | 320,551 | 282,744 | 196,330 | 126,906 | 72,002 | 46,388 | 22,345 | - | - | - | - | |||||||||||||||||||||||||||||||||||||||||||||||||
| Operating Costs |
||||||||||||||||||||||||||||||||||||||||||||||||||||||||||||||
| Mining |
1.00 | (365,010 | ) | (105,073 | ) | (87,083 | ) | (67,762 | ) | (43,614 | ) | (25,621 | ) | (21,472 | ) | (14,384 | ) | - | - | - | - | |||||||||||||||||||||||||||||||||||||||||
| Re-Handle |
1.00 | 0 | - | - | - | - | - | - | - | - | - | - | - | |||||||||||||||||||||||||||||||||||||||||||||||||
| Process |
1.00 | (76,489 | ) | (18,236 | ) | (17,660 | ) | (16,137 | ) | (9,779 | ) | (6,176 | ) | (5,007 | ) | (3,493 | ) | - | - | - | - | |||||||||||||||||||||||||||||||||||||||||
| G&A |
1.00 | (57,917 | ) | (13,591 | ) | (12,185 | ) | (12,185 | ) | (8,394 | ) | (5,761 | ) | (3,689 | ) | (2,112 | ) | - | - | - | - | |||||||||||||||||||||||||||||||||||||||||
| Operating Costs |
- | $000s | (499,416 | ) | (136,901 | ) | (116,928 | ) | (96,084 | ) | (61,787 | ) | (37,558 | ) | (30,168 | ) | (19,989 | ) | - | - | - | - | ||||||||||||||||||||||||||||||||||||||||
| $/t-ore | $218.040 | $210.43 | $195.20 | |||||||||||||||||||||||||||||||||||||||||||||||||||||||||||
| Operating Cost as % of Revenue |
|
% | 47 | % | ||||||||||||||||||||||||||||||||||||||||||||||||||||||||||
|
OPERATING MARGIN |
US$000 | 567,850 | 183,650 | 165,816 | 100,246 | 65,119 | 34,444 | 16,219 | 2,356 | - | - | - | - | |||||||||||||||||||||||||||||||||||||||||||||||||
| Operating Margin |
$000s | 567,850 | 183,650 | 165,816 | 100,246 | 65,119 | 34,444 | 16,219 | 2,356 | - | - | - | - | |||||||||||||||||||||||||||||||||||||||||||||||||
| Capital |
$000s | (151,453 | ) | (51,278 | ) | (44,078 | ) | (23,968 | ) | (15,342 | ) | (5,675 | ) | (3,885 | ) | (2,165 | ) | (4,827 | ) | (235 | ) | - | - | |||||||||||||||||||||||||||||||||||||||
| Working Capital |
$000s | 3,770 | - | 456 | 1,227 | 768 | 628 | 245 | 251 | 196 | - | - | - | |||||||||||||||||||||||||||||||||||||||||||||||||
| Pre Tax Free Cash Flow |
$000s | 420,166 | 132,372 | 122,194 | 77,505 | 50,545 | 29,397 | 12,579 | 441 | (4,631 | ) | (235 | ) | - | - | |||||||||||||||||||||||||||||||||||||||||||||||
| 132,372 | 254,566 | 332,071 | 382,616 | 412,013 | 424,591 | 425,033 | 420,401 | 420,166 | 420,166 | 420,166 | ||||||||||||||||||||||||||||||||||||||||||||||||||||
| Income Tax |
$000s | (156,149 | ) | (51,245 | ) | (48,331 | ) | (27,611 | ) | (18,820 | ) | (7,902 | ) | (2,240 | ) | - | - | - | - | - | ||||||||||||||||||||||||||||||||||||||||||
| After Tax Free Cash Flow |
$000s | 264,017 | 81,127 | 73,863 | 49,894 | 31,725 | 21,494 | 10,339 | 441 | (4,631 | ) | (235 | ) | - | - | |||||||||||||||||||||||||||||||||||||||||||||||
| 81,127 | 154,990 | 204,883 | 236,609 | 258,103 | 268,442 | 268,884 | 264,252 | 264,017 | 264,017 | 264,017 | ||||||||||||||||||||||||||||||||||||||||||||||||||||
|
SRK Consulting CONFIDENTIAL |
5 of 6 |
| PROJECT CAPITAL - See backup tabs for capital cost details. |
|
2022 | 2023 | 2024 | 2025 | 2026 | 2027 | 2028 | 2029 | 2030 | 2031 | 2032 | ||||||||||||||||||||||||||||||||||||||||||||||||||
| Development | $ | 000s | 35,833 | 15,935 | 12,646 | 6,996 | 256 | - | - | - | - | - | - | - | ||||||||||||||||||||||||||||||||||||||||||||||||
|
|
Exploration | $ | 000s | 24,324 | 7,224 | 7,405 | 5,166 | 2,460 | 1,260 | 660 | 150 | - | - | - | - | |||||||||||||||||||||||||||||||||||||||||||||||
| Providencia Mine | $ | 000s | 6,895 | 2,204 | 4,690 | - | - | - | - | - | - | - | - | - | ||||||||||||||||||||||||||||||||||||||||||||||||
| El Silencio Mine | $ | 000s | 22,090 | 6,439 | 6,971 | 5,259 | 2,421 | 500 | 250 | 250 | - | - | - | - | ||||||||||||||||||||||||||||||||||||||||||||||||
| Sandra K | $ | 000s | 7,356 | 3,810 | 2,567 | 979 | - | - | - | - | - | - | - | - | ||||||||||||||||||||||||||||||||||||||||||||||||
| Carla | $ | 000s | 4,647 | 2,049 | 2,534 | 64 | - | - | - | - | - | - | - | - | ||||||||||||||||||||||||||||||||||||||||||||||||
| Mine Engineering Costs | $ | 000s | 1,917 | 590 | 531 | 265 | 265 | 133 | 133 | - | - | - | - | - | ||||||||||||||||||||||||||||||||||||||||||||||||
| Geology Exploration Drilling | $ | 000s | 2,853 | 2,853 | - | - | - | - | - | - | - | - | - | - | ||||||||||||||||||||||||||||||||||||||||||||||||
| Small Mining | $ | 000s | 84 | 84 | - | - | - | - | - | - | - | - | - | - | ||||||||||||||||||||||||||||||||||||||||||||||||
| Mill | $ | 000s | 3,978 | 1,312 | 950 | 660 | 420 | 360 | 190 | 86 | - | - | - | - | ||||||||||||||||||||||||||||||||||||||||||||||||
| Laboratory | $ | 000s | 969 | 404 | 200 | 140 | 100 | 70 | 35 | 20 | - | - | - | - | ||||||||||||||||||||||||||||||||||||||||||||||||
| Maintenance | $ | 000s | 1,314 | 314 | 320 | 240 | 180 | 140 | 80 | 40 | - | - | - | - | ||||||||||||||||||||||||||||||||||||||||||||||||
| Civils | $ | 000s | 134 | 19 | 40 | 20 | 20 | 15 | 10 | 10 | - | - | - | - | ||||||||||||||||||||||||||||||||||||||||||||||||
| Logistics & Weighing | $ | 000s | 166 | 61 | 30 | 22 | 18 | 15 | 10 | 10 | - | - | - | - | ||||||||||||||||||||||||||||||||||||||||||||||||
| Environment | $ | 000s | 17,866 | 3,626 | 4,090 | 2,800 | 4,950 | 1,200 | 1,200 | - | - | - | - | - | ||||||||||||||||||||||||||||||||||||||||||||||||
| O&H | $ | 000s | 2,353 | 1,039 | 580 | 230 | 155 | 171 | 158 | 20 | - | - | - | - | ||||||||||||||||||||||||||||||||||||||||||||||||
| Administration | $ | 000s | 1,475 | 654 | 293 | 165 | 165 | 145 | 53 | - | - | - | - | - | ||||||||||||||||||||||||||||||||||||||||||||||||
| IT | $ | 000s | 1,916 | 1,610 | 112 | 74 | 45 | 47 | 29 | - | - | - | - | - | ||||||||||||||||||||||||||||||||||||||||||||||||
| Security | $ | 000s | 1,334 | 992 | 120 | 60 | 40 | 70 | 52 | - | - | - | - | - | ||||||||||||||||||||||||||||||||||||||||||||||||
| Finance | $ | 000s | 0 | - | - | - | - | - | - | - | - | - | - | - | ||||||||||||||||||||||||||||||||||||||||||||||||
| Mine Closure | $ | 000s | 10,852 | - | - | - | 3,018 | 1,274 | 749 | 749 | 4,827 | 235 | - | - | ||||||||||||||||||||||||||||||||||||||||||||||||
| TSF Closure | $ | 000s | 3,098 | 60 | - | 828 | 828 | 276 | 276 | 830 | - | - | - | - | ||||||||||||||||||||||||||||||||||||||||||||||||
| Carry Over (2021 Projects) | $ | 000s | 0 | - | - | - | - | - | - | - | - | - | - | - | ||||||||||||||||||||||||||||||||||||||||||||||||
| Total Capital |
1.00 | $ | 000s | 151,453 | 51,278 | 44,078 | 23,968 | 15,342 | 5,675 | 3,885 | 2,165 | 4,827 | 235 | - | - | |||||||||||||||||||||||||||||||||||||||||||||||
| Initial |
$ | 000s | 0 | - | - | - | - | - | - | - | - | - | - | - | ||||||||||||||||||||||||||||||||||||||||||||||||
| Sustaining |
$ | 000s | 151,453 | 51,278 | 44,078 | 23,968 | 15,342 | 5,675 | 3,885 | 2,165 | 4,827 | 235 | - | - | ||||||||||||||||||||||||||||||||||||||||||||||||
| CHANGES IN WORKING CAPITAL |
| |||||||||||||||||||||||||||||||||||||||||||||||||||||||||||||
| Receivables |
||||||||||||||||||||||||||||||||||||||||||||||||||||||||||||||
| Gross Revenues | $ | 000s | $ | 1,111,966 | 333,977 | 294,586 | 204,553 | 132,222 | 75,018 | 48,330 | 23,281 | - | - | - | - | |||||||||||||||||||||||||||||||||||||||||||||||
| Less Metal Deducts | $ | 000s | $ | (5,560 | ) | (1,670 | ) | (1,473 | ) | (1,023 | ) | (661 | ) | (375 | ) | (242 | ) | (116 | ) | - | - | - | - | |||||||||||||||||||||||||||||||||||||||
| Net Receivables | 332,307 | $ | 000s | $ | 1,106,406 | 332,307 | 293,113 | 203,530 | 131,560 | 74,643 | 48,089 | 23,164 | - | - | - | - | ||||||||||||||||||||||||||||||||||||||||||||||
| Delay In Receivables | 5 | $ | 000s | $ | (4,552.2 | ) | - | (537 | ) | (1,227 | ) | (986 | ) | (780 | ) | (364 | ) | (341 | ) | (317 | ) | - | - | - | ||||||||||||||||||||||||||||||||||||||
| Payables | ||||||||||||||||||||||||||||||||||||||||||||||||||||||||||||||
| Mining | $ | 000s | $ | 365,010 | 105,073 | 87,083 | 67,762 | 43,614 | 25,621 | 21,472 | 14,384 | - | - | - | - | |||||||||||||||||||||||||||||||||||||||||||||||
| Processing | $ | 000s | $ | 76,489 | 18,236 | 17,660 | 16,137 | 9,779 | 6,176 | 5,007 | 3,493 | - | - | - | - | |||||||||||||||||||||||||||||||||||||||||||||||
| G&A | $ | 000s | $ | 57,917 | 13,591 | 12,185 | 12,185 | 8,394 | 5,761 | 3,689 | 2,112 | - | - | - | - | |||||||||||||||||||||||||||||||||||||||||||||||
| Labor Cost Deduct (30%) | $ | 000s | $ | (149,825 | ) | (41,070 | ) | (35,078 | ) | (28,825 | ) | (18,536 | ) | (11,267 | ) | (9,051 | ) | (5,997 | ) | - | - | - | - | |||||||||||||||||||||||||||||||||||||||
| Net Payables | 95,830 | $ | 000s | $ | 349,591 | 95,830 | 81,850 | 67,259 | 43,251 | 26,291 | 21,118 | 13,992 | - | - | - | - | ||||||||||||||||||||||||||||||||||||||||||||||
| Delay In Payables | 30 | $ | 000s | $ | 7,876.5 | - | 1,149 | 1,199 | 1,973 | 1,394 | 425 | 586 | 1,150 | - | - | - | ||||||||||||||||||||||||||||||||||||||||||||||
| Inventories | ||||||||||||||||||||||||||||||||||||||||||||||||||||||||||||||
| Mining COGS | $ | 000s | $ | 365,010 | 105,073 | 87,083 | 67,762 | 43,614 | 25,621 | 21,472 | 14,384 | - | - | - | - | |||||||||||||||||||||||||||||||||||||||||||||||
| Processing COGS | $ | 000s | $ | 76,489 | 18,236 | 17,660 | 16,137 | 9,779 | 6,176 | 5,007 | 3,493 | - | - | - | - | |||||||||||||||||||||||||||||||||||||||||||||||
| Labor Cost Deduct (30%) | $ | 000s | $ | (132,450 | ) | (36,993 | ) | (31,423 | ) | (25,170 | ) | (16,018 | ) | (9,539 | ) | (7,944 | ) | (5,363 | ) | - | - | - | - | |||||||||||||||||||||||||||||||||||||||
| Total COGS | 86,317 | $ | 309,049 | 86,317 | 73,320 | 58,729 | 37,375 | 22,258 | 18,536 | 12,514 | - | - | - | - | ||||||||||||||||||||||||||||||||||||||||||||||||
| Net Inventories | 30 | $ | 000s | $ | (7,094.53 | ) | - | (1,068 | ) | (1,199 | ) | (1,755 | ) | (1,242 | ) | (306 | ) | (495 | ) | (1,029 | ) | - | - | - | ||||||||||||||||||||||||||||||||||||||
| Total Changes in Working Capital | $ | 000s | (3,770 | ) | - | (456 | ) | (1,227 | ) | (768 | ) | (628 | ) | (245 | ) | (251 | ) | (196 | ) | - | - | - | ||||||||||||||||||||||||||||||||||||||||
|
SRK Consulting CONFIDENTIAL |
6 of 6 |